Gordon T Long
Global Macro Research | Macro-Technical Analysis
TIPPING POINTS
ENERGY INFLATION
FITCH’S DOWNGRADE A VOTE OF NON-CONFIDENCE IN BIDENOMICS!
In downgrading the US Credit Rating to AA+ this week, Fitch cited: “there has been a steady deterioration in standards of governance over the last 20 years, including on fiscal and debt matters, notwithstanding the June bipartisan agreement to suspend the debt limit until January 2025. The repeated debt-limit political standoffs and last-minute resolutions have eroded confidence in fiscal management. In addition, the government lacks a medium-term fiscal framework, unlike most peers….”
When S&P downgraded the U.S. credit rating in 2011, it cited as one factor the growing U.S. debt as a percent of GDP. It said it anticipated U.S. debt reaching “an estimated 74% of GDP by the end of 2011 to 79% in 2015 and 85% in 2021,” while noting that these ratios were “high in relation to those of peer credits….” Those ratios look positively Goldilocks compared to today. One of the points made by Fitch in its ratings downgrade on Tuesday was this:
“Lower deficits and high nominal GDP growth reduced the debt-to-GDP ratio over the last two years from the pandemic high of 122.3% in 2020; however, at 112.9% this year it is still well above the pre-pandemic 2019 level of 100.1%. The GG [General Government] debt-to-GDP ratio is projected to rise over the forecast period, reaching 118.4% by 2025. The debt ratio is over two-and-a-half times higher than the ‘AAA’ median of 39.3% of GDP and ‘AA’ median of 44.7% of GDP. Fitch’s longer-term projections forecast additional debt/GDP rises, increasing the vulnerability of the U.S. fiscal position to future economic shocks.”
Fitch also said the rating downgrade reflects an expected fiscal deterioration over the next 3 years, as well as a high and growing general government debt burden, while it expects the US general government deficit to rise to 6.3% of GDP in 2023 from 3.7% in 2022.
US Treasury Secretary Yellen said she strongly disagrees with Fitch’s decision to downgrade the US and noted that President Biden is committed to fiscal sustainability. Furthermore, the White House also said it strongly disagrees with Fitch’s decision and that it defies reality to downgrade the US at a moment when President Biden has delivered the strongest recovery of any major economy in the world; while an administration official said Fitch’s decision to downgrade the US ignores resilience and the underlying strength of the US economy with the downgrade a bizarre and baseless decision for Fitch to make, according to Reuters.
Who do you believe? With Biden holding the 2nd lowest rating of any US president since polls were initiated it is fairly safe to conclude few any longer believe Biden or Yellen. This is especially true since it is being reported that tax revenues have plummeted, resulting in interest on the US debt to exceed $1T this year and the US will sell over $1T in debt this quarter – the 2nd biggest in US history!
WHAT YOU NEED TO KNOW
US CREDIT DOWNGRADED: Bidenomics Breaks The US ‘Credit Credibility’ Dam!
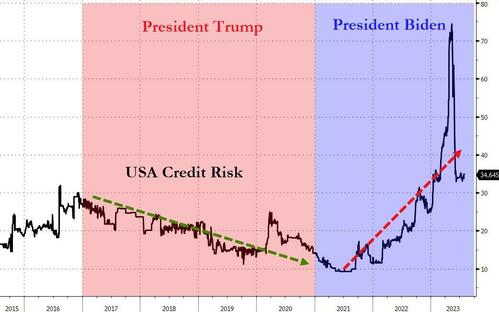 The USA’s Long-Term Foreign-Currency Issuer Default Rating (IDR), once the global paramount credit rating, has been dropped from ‘AAA’ to ‘AA+’ by Fitch. The US Credit Dam has been breached as others are expected to follow.
- 2011 – S&P 500 drops US Debt from ‘AAA’ to ‘AA+’
- March 2023 – China’s Chengxin International Credit Rating drops US Debt from ‘AAA’ to ‘AA+’
- August 2023 – Fitch drops US Debt from ‘AAA’ to ‘AA+’
- Next Up – Moody’s and DBRS PENDING
We strongly recommend you read Fitch’s Full Assessment of the Harsh Reality of the US Economic Situtation
Posted in its uncensored entirety at MATASII.com
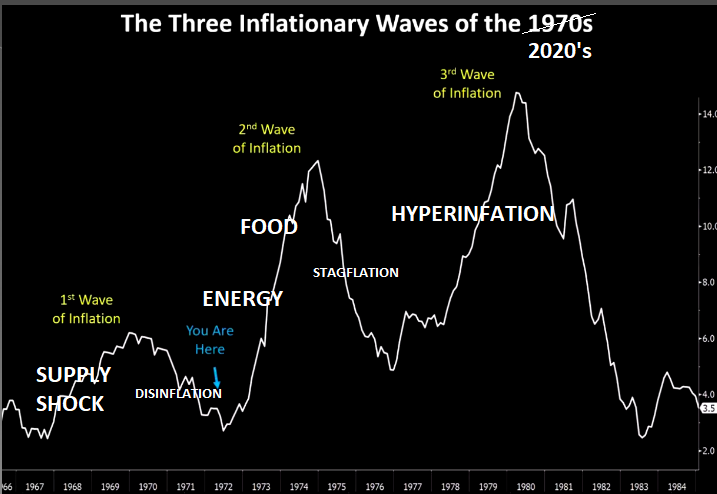
INFLATION – The Wave 2 Energy Resurgence Cometh!
-
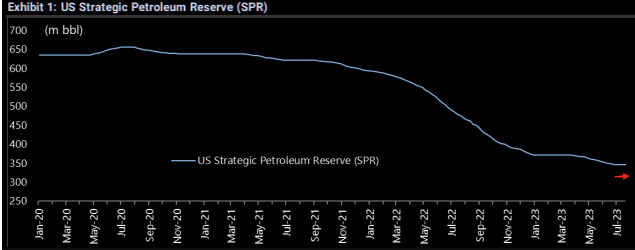
- The fall in US Gasoline and Energy prices has been the almost complete depletion of the US Strategic Petroleum Reserves (SPR) as a political tool to offset global energy pressures and the strategic policy decision on Fossil Fuels resulting in the US becoming Energy dependent as we were in the 1970’s.
- In the 1970’s, increasing energy dependence lead to Saudi Arabian oil price pressures creating exploding energy prices. The Biden administration has now given up on its attempt to buy 6 million barrels of oil to replenish the Strategic Petroleum Reserve as oil prices are expected to keep rising after an output cut from Saudi Arabia.
- This is starting to become the 1970’s all over again, as Saudi Arabia and the BRICS increasingly align against the US.
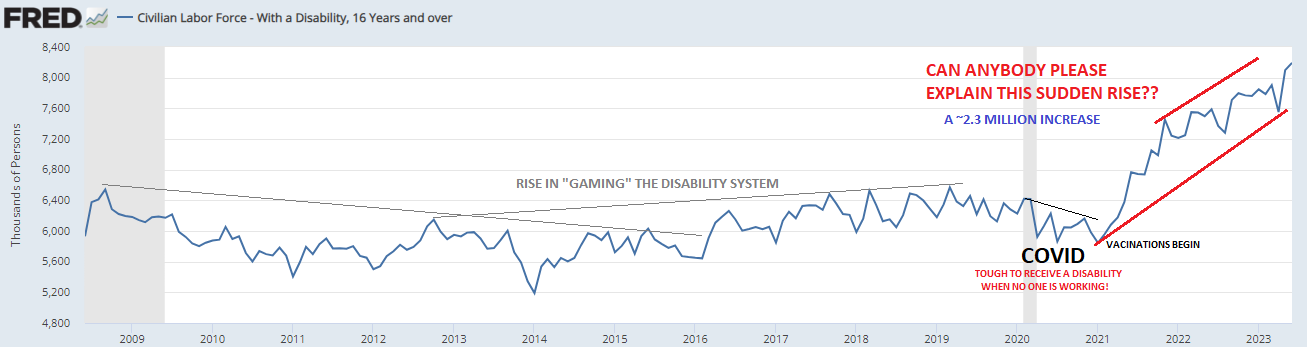
EXPLODING DISABILITY CLAIMS – Why Is No One Willing To Talk About This?
-
- Last month we had ~866K Disability Claims in a single month!!! Meanwhile we created only 200k jobs in June of which ~70K was government jobs. Is it any wonder Unemployment Claims are at historic lows and layoffs have yet to explode?
EARNINGS SEASON – Pricing Power Holds Earnings Up
-
- It was quite evident during the earnings conference calls that overall companies have been able to pass inflation on to their customers. They currently have Price Power which was somewhat of a surprise, considering how tapped out the consumer is. The answer lies in consumers drawing down their Covid savings from forbearnace et al and we have a two tier system in the US – The ‘have’s’ and ‘have nots’! The Have nots are disappearing quickly as they shop at DollarStore, non-name brands and substitution (hot dogs versus steak).
- Earnings have been better than feared with 54% of companies beating consensus estimates by at least 1SD (vs historical avg of 48%). 14% of companies have missed consensus estimates by at least 1SD (vs historical avg of 13%).
- Earnings season has been net positive, certainly with respect to the percentage of companies beating final estimates.
- There was a presumption coming in that the bar for S&P was particularly low … the 9% expected drop, however, was heavily influenced by the energy space … and, once taken out, the median stock was expected to grow earnings by 5%.
- “Tricky” or “Uneven” is the word choice I’d use to characterize the reporting period. Specifically, while mega cap tech earnings have been generally been somewhere between “fine” and “impressive,” given recent positioning dynamics, this specific bar was high and it wasn’t easy to live up to sky-high estimates all over again this quarter.
GLOBAL ECONOMIC REPORTING – What This Week’s Key Global Economic Reports Tell Us
-
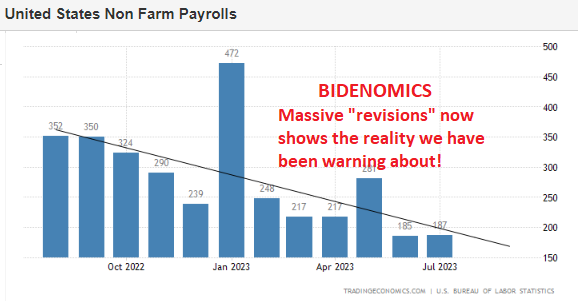
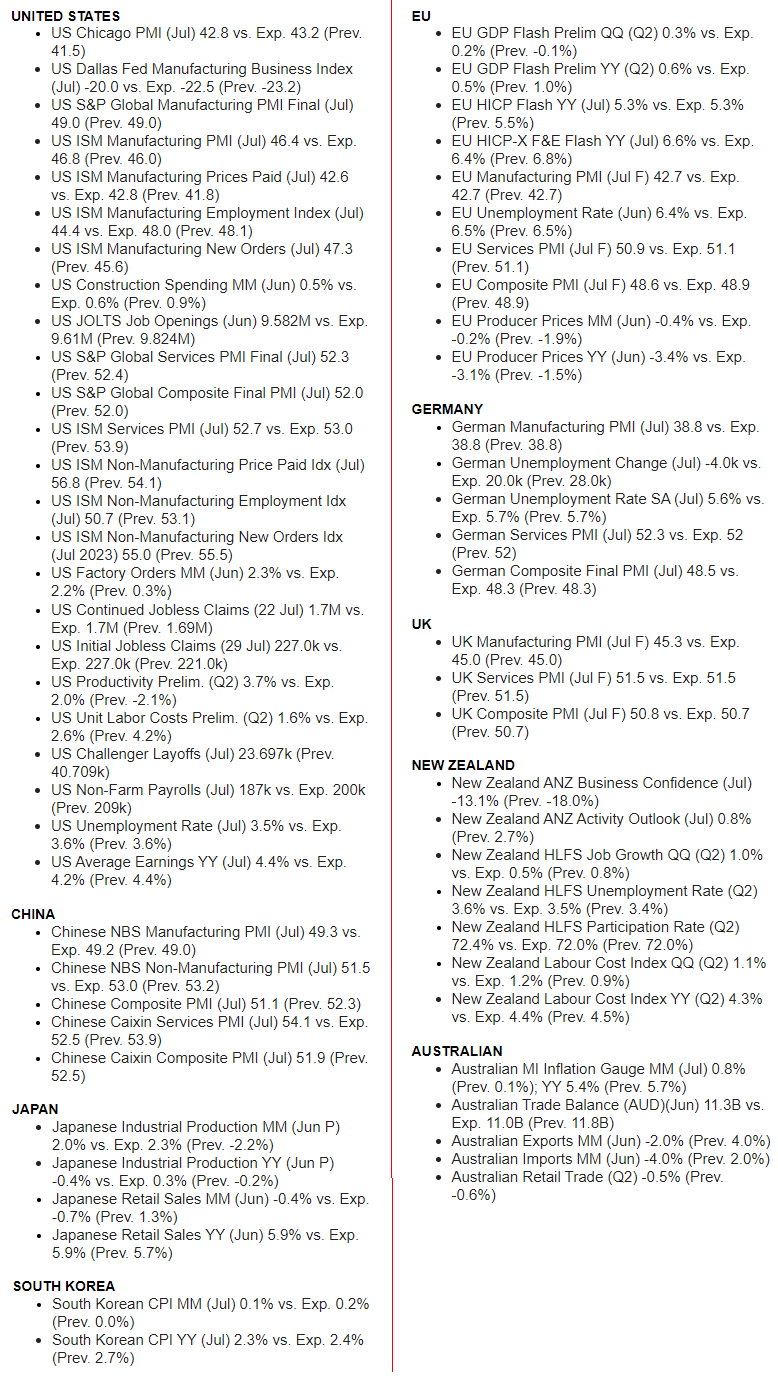
- The US economy created 187K jobs in July of 2023, below market expectations of 200K and following a downwardly revised 185K in June.
- The reading is also below the average monthly gain of 312K over the prior 12 months, but remains about twice the 70K-100K needed per month to keep up with growth in the working-age population.
 CONCLUSION
-
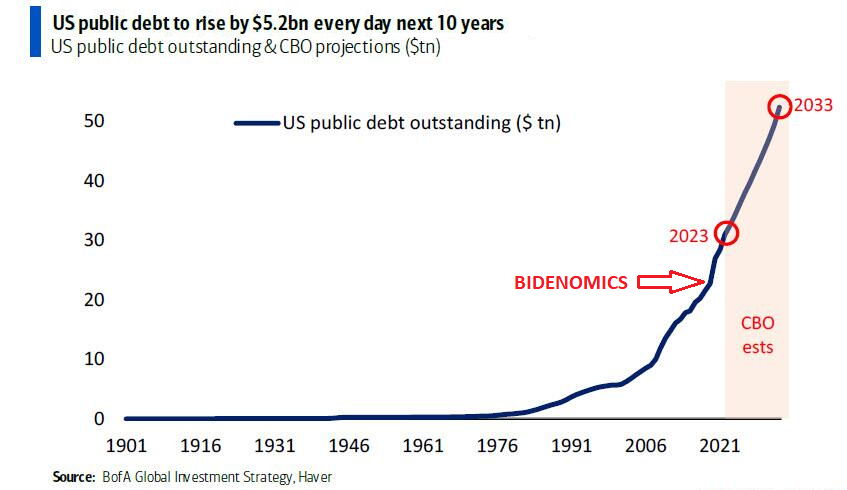
- Between the 1st US debt downgrade in Aug’11 and the second on this week (Aug’23) US sovereign debt is up $18 trillion to $30 trillion.
- The CBO predicts that US debt will rise to $52 trillion in one decade, by 2033 or rising by $5.2 billion every day for the next 10 years!
- The US government is spending a crisis-like 44% of GDP, which is higher than the WW2 peak, and suggesting that the US is currently at war with someone? (CHART RIGHT)
- Debt downgrades ≠ fiscal discipline, because just like central banks are still in the business of bailing out Wall St, so governments are very much in business of bailing out Main St.
“Ultimately, the policy destination is Yield Curve Control across G7 once the next recession provokes fiscal policy panic and even higher government default risk.” – Michael Hartnett BoAML
INFLATION: The Wave 2 Energy Resurgence Cometh!
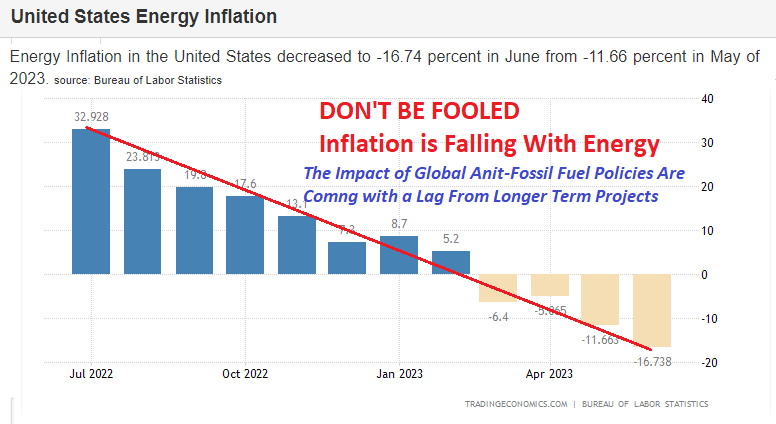
 As it always does, the market has planted the seeds of its own destruction! We believe that seed is wave 2 of Inflation, which is likely to be a resurgence in Energy costs.
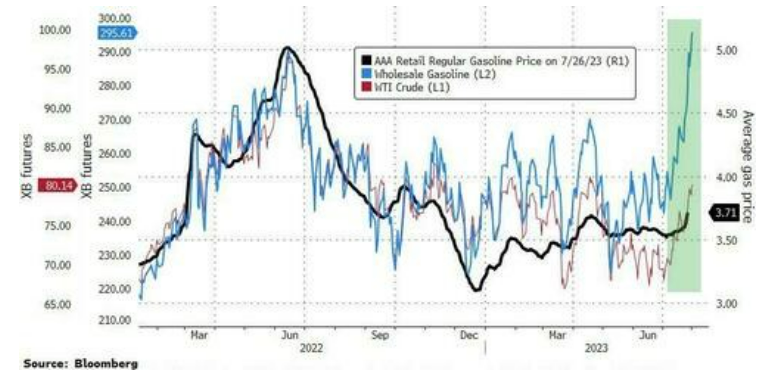
Inflation has tumbled with energy prices being the main component bringing global inflation down this year – most specifically the US from tumbling gasoline prices at the pump. Meanwhile overall core inflation has been stubbrnly maintained.
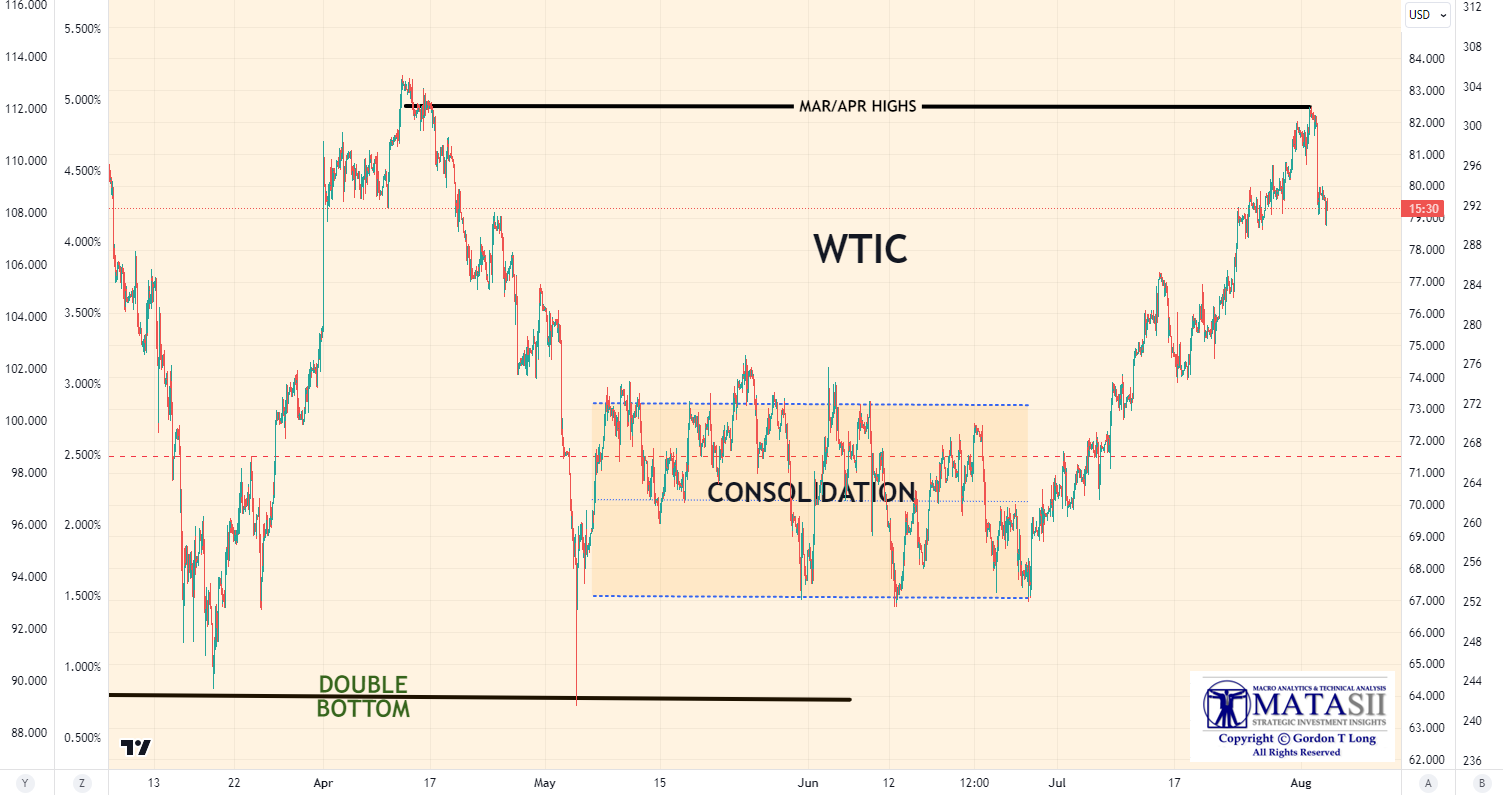
Behind all the exuberance of new highs in the equity indices, the energy scenario seems to be changing. Gasoline prices hit a 2023 high as wholesale gasoline has suddenly exploded (chart above right). July was Oil’s best month since Jan 2022, with WTI hitting $82, back above pre-OPEC-Cut levels from March/Apr.
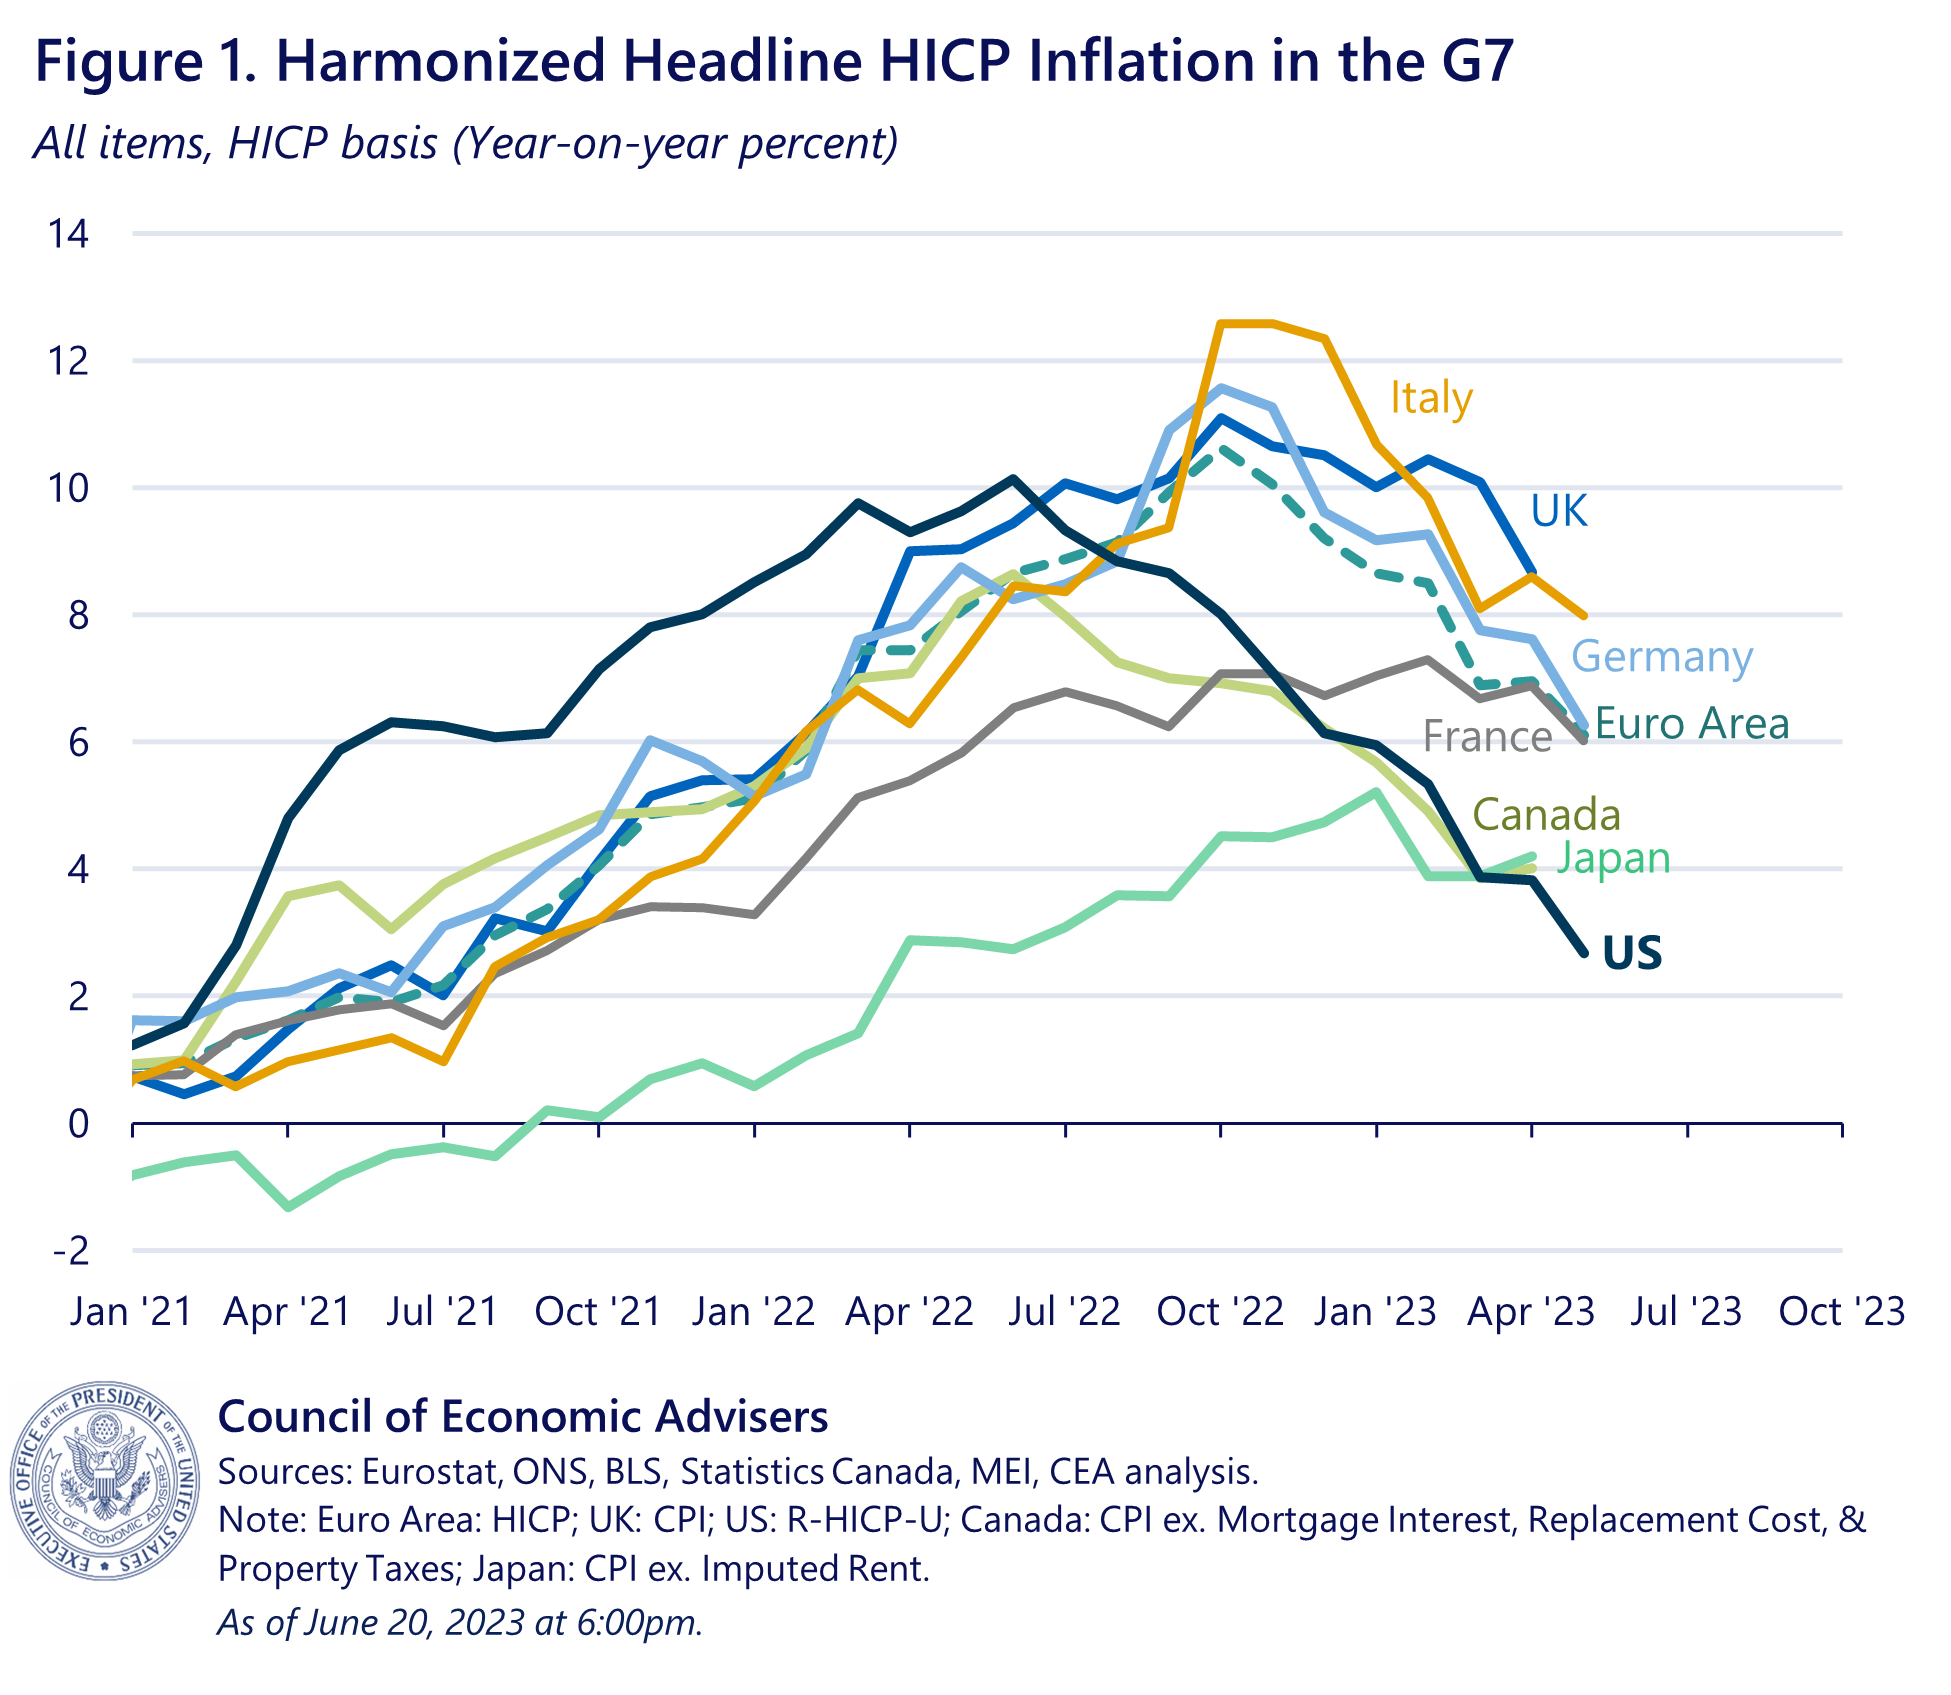
 This is a cause for worry for governments around the world because gasoline, along with diesel, plays a lead role when it comes to inflation. Though inflation remains elevated across all countries, the U.S. now has the lowest 12-month harmonized inflation in the G7, both for overall and core inflation (White House Chart Below).
However, what we need to fully appreciate is that the fall in US Gasoline and Energy prices has been the almost complete depletion of the US Strategic Petroleum Reserves (SPR) as a political tool to offset global energy pressures and the strategic policy decision on Fossil Fuels, resulting in the US becoming Energy dependent as we were in the 1970’s. In the 1970’s increasing energy dependence lead to Saudi Arabian oil price pressures creating exploding energy prices. The Biden administration has now given up on its attempt to buy 6 million barrels of oil to replenish the Strategic Petroleum Reserve, as oil prices are expected to keep rising after an output cut from Saudi Arabia. This is starting to become the 1970’s all over again as Saudi Arabia and the BRICS increasingly align against the US.
CRUDE IS SHOWING SIGNS OF WANTING TO BREAK-OUT
SAUDI ARABIA CUTS IS DRIVING THIS LIFT IN CRUDE
Saudi came out and affirmed an extension of its production cuts with the potential to deepen them (more below), seeing prices rebound higher in the NY morning. There was some consolidation as the dust settled, but heading into the NY afternoon, combined with the Dollar paring some strength as the UST sell-off lost momentum, crude prices extended to highs ahead of their settlement, bringing prices back into their upward channel seen through July.
OPEC+: Saudi Arabia announced it would extend its voluntary oil production cut of 1mln BPD for another month to include September, which could be extended or, crucially, “extended and deepened”, suggesting the Kingdom could go even further beyond what was largely considered the floor. The extension means Saudi will be producing 9mln BPD until at least the end of September, far beneath its maximum capacity of 12mln BPD. Meanwhile, Russian Deputy PM Novak announced Russia would continue to voluntarily reduce its oil supply in September, but at a smaller export reduction of 300k BPD vs the 500k BPD cut in August.
MORE ENERGY CHARTS IN THIS WEEKS “CURRENT MARKET PERSPECTIVE'”
The Fed may be forced to do more tightening in coming months, as CPI comes in far hotter than expected due to rising energy.
No less than Germany’s Green Economic Affairs Minister Robert Habeck recently strongly warned that Germany is facing several tough years due to a combination of transitioning to sustainable energy sources and the rising costs of energy.
According to Remix
“The federal minister, who has long called for a radical energy policy change, said that Germany faces “five tough years ahead” and revealed the country will have to borrow to support companies’ energy costs or lose their industry. “Tough years of green industrial transition will put a burden on people,” Habeck said, noting that the IMF expects the German economy to shrink by 0.3 percent this year. The German statistical office warned in May that the country was entering a recession, and some big companies are already thinking of moving out of Germany, fueling fears of a loss of industrial production.”
FOOD
The Food and Agriculture Organization of the United Nations (FAO) reported Friday that the global food index, which tracks monthly changes in the international prices of globally-traded food commodities, averaged 123.9 in July, up 1.3% from the previous month. FAO explained the FAO Vegetable Oil Price subcomponent of the index was responsible for the monthly increase. The FAO All Rice Price Index increased 2.8% on the month and 19.7% on the year due to “India’s 20 July prohibition of non-parboiled Indica exports fostered expectations of greater sales in other origins, amplifying upward pressure already exerted on prices by seasonally tighter supplies and Asian purchases,” the report said. This upward pressure on rice prices “raises substantial food security concerns for a large swathe of the world population, especially those that are most poor and who dedicate a larger share of their incomes to purchase food,” FAO warned.
EXPLODING DISABILITY CLAIMS – Why Is No One Willing To Talk About This?
Last month we had ~866K Disability claims in a single month!!! Meanwhile we created only 200k jobs in June of which ~70K were government jobs. Is it any wonder Unemployment Claims are at historic lows and layoffs have yet to explode? Treasury Secretary Janet Yellen has stongly claimed that the low unemployment numbers are a sign of a strong and vibrant economy! Do you agree?
I talked to a small business employer who won’t layoff or fire people, because it is better to get 70% productivity out of someone versus zero from no one when your priority is cashflow to stay alive. The realities of the New America!
EARNINGS SEASON – Pricing Power Holds Earnings Up
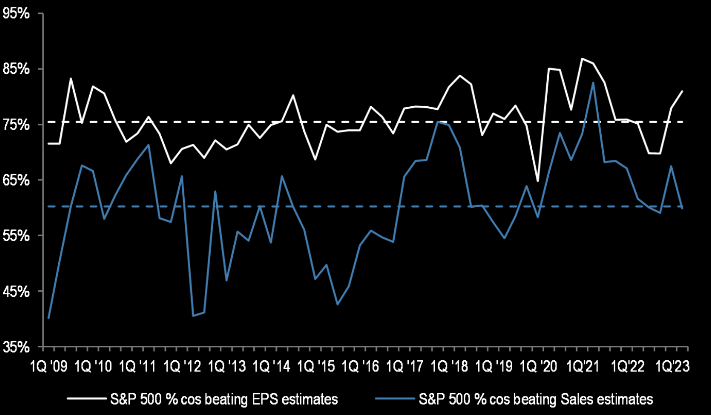 We noted the divergence in EPS versus Sales “Beats” throughout the earnings calls. You can play games to make EPS, but actual sales are a lot tougher without committing actual fraud!
The main bullets from the calls were:
-
- Earnings are contracting significantly in both regions, with a -7% y/y in the US and -8% Y-o-Y in Europe.
- Commodity markets are pushing these numbers downwards, but overall delivery surpasses the consensus.
- Corporations are demonstrating overall they still have “Pricing Power” and have been successful in passing inflation along to their customers.
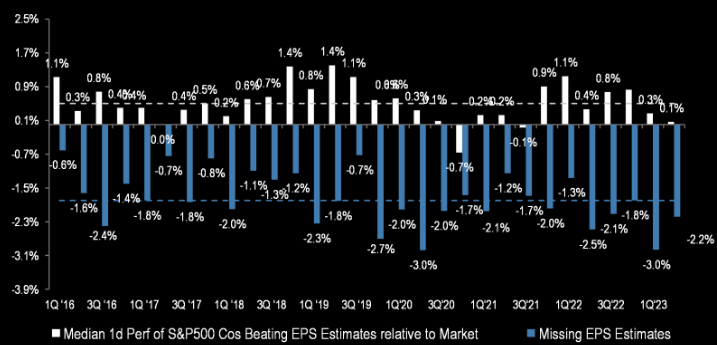
PRICING POWER
We believe corporate “Price Power” will soon fall quickly as Personal Saving levels deteriorate, credit becomes tougher to get and more expensive and compounding inflation over two years will take its toll on consumption.
RECENT Q2 EARNINGS NEWSLETTER FOCUS – UPDATE
We updated the prior newsletter graphic below. The expected post earnings weakness is underway.
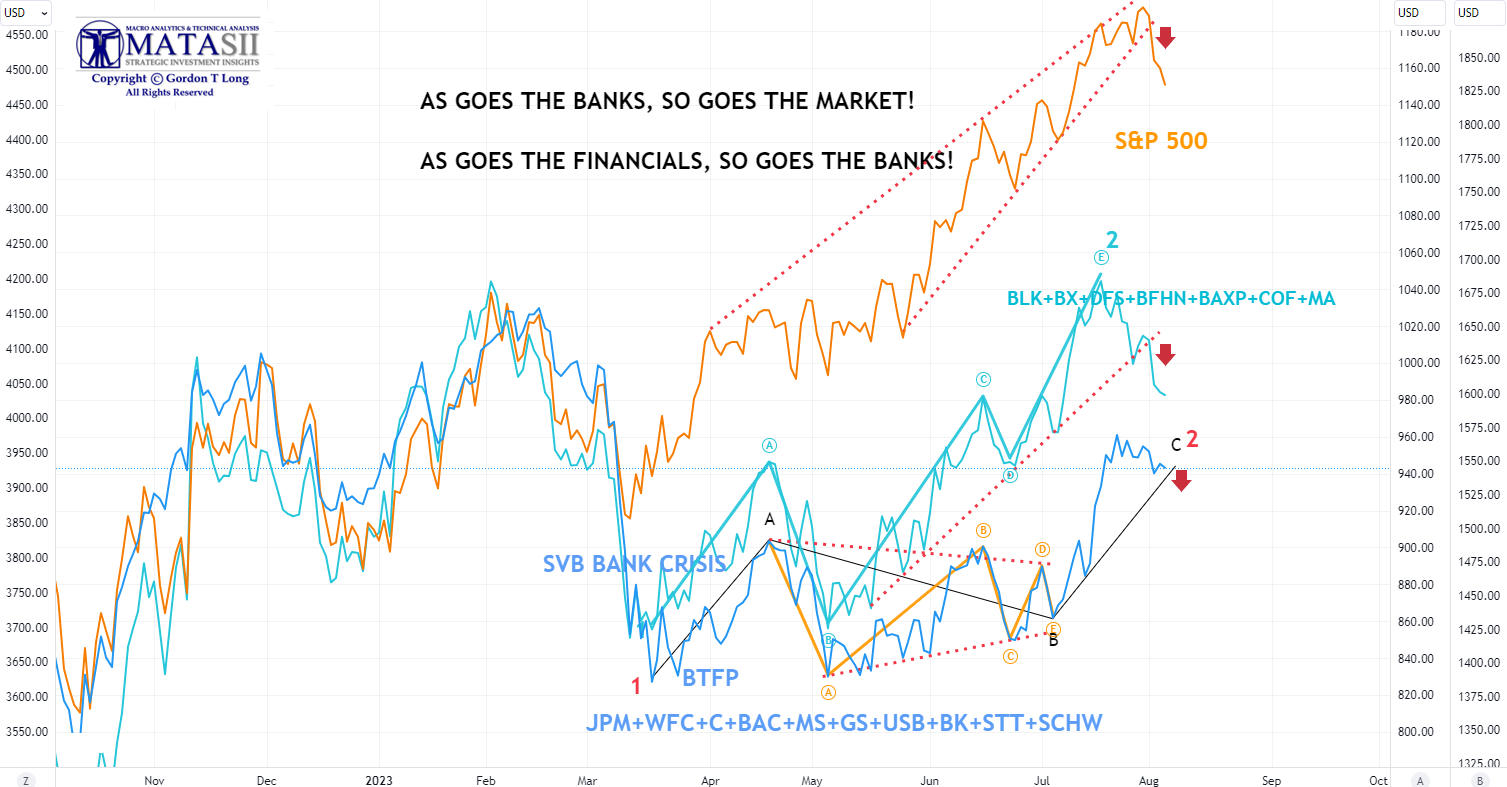
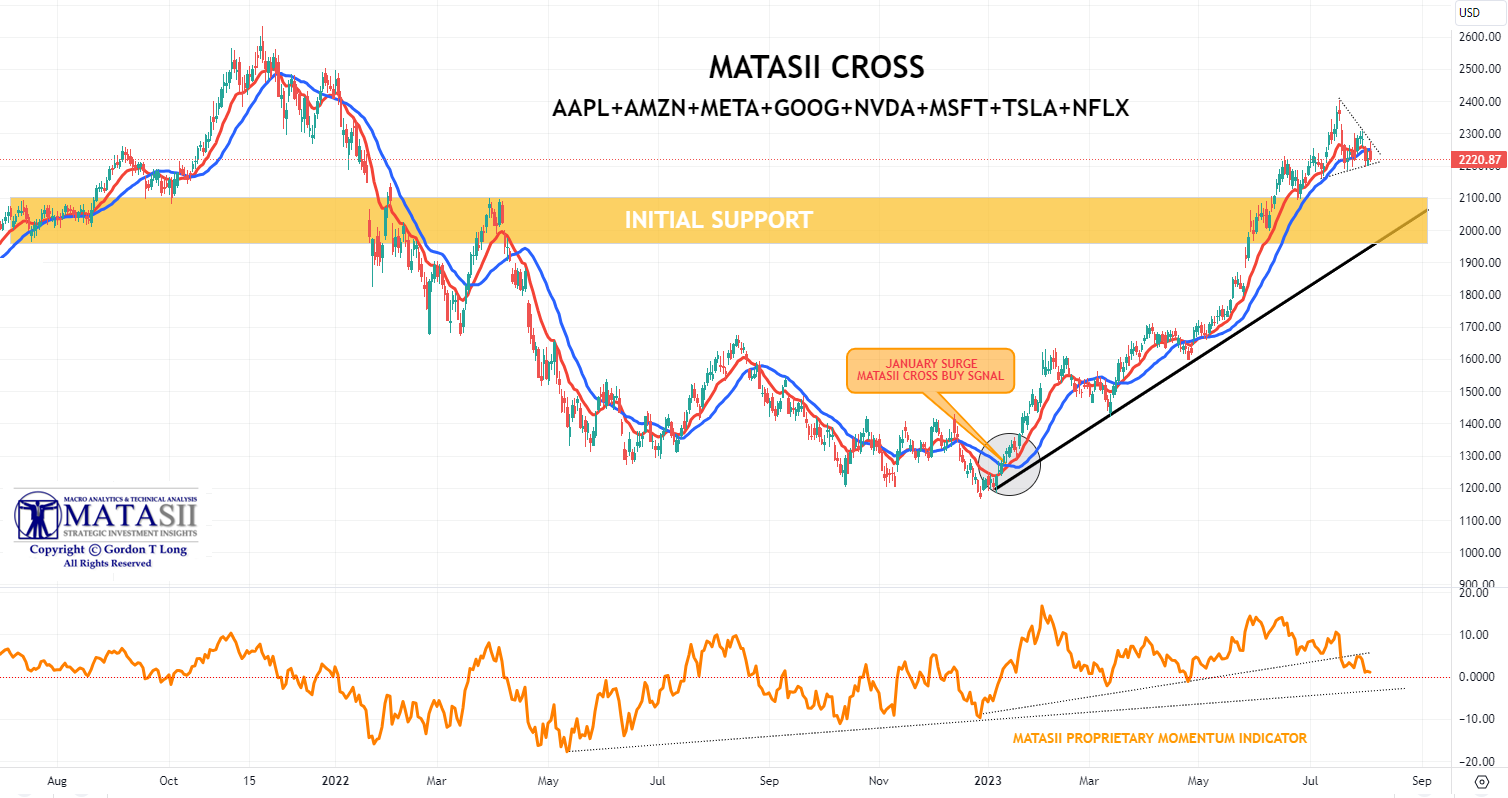
MAGNIFICENT SEVEN – NOTES
The Magnificcnt Seven were well within expectations with Amazon standing out. It appears they now need to consolidate and find support at lower levels.
-
- Tesla (TSLA) Q2 2023 (USD): Adj. EPS 0.91 (exp. 0.82), Revenue 24.93bln (exp. 24.48bln). Tesla beat on the top and bottom line, but margins saw further contraction. Production in Q3 will be down a bit sequentially amid planned factory upgrades, while the guidance on Cybertruck production remains vague. Musk noted cutting prices will be dependent on macro conditions.
- Alphabet (GOOGL) surpassed St. expectations on the top and bottom line which was driven by core advertising units growth. Advertising, YouTube Ads, Google Other, and Cloud all came in above expectations. Separately, CFO Ruth Porat will assume the newly created role of President and CIO, but will continue to serve as CFO as the company searches for her successor.
- Microsoft (MSFT) posted a fairly decent report all round, although next quarter revenue guide was slightly short, with disappointment on the AI commentary.
-
- Meta Platforms Inc (META) Q2 2023 (USD): EPS 2.98 (exp. 2.91), Revenue 32.00bln (exp. 31.12bln), Advertising Revenue 31.50bln (exp. 30.42bln), FB DAUs 2.06bln (exp. 2.03bln), FB MAUs 3.03bln (exp. 3.00bln). Q3 Revenue view 32.00-34.50bln (exp. 31.18bln)
- Meta (META) had a stellar report; EPS, revenue, DAUs, MAUs and advertising revenue all beat in addition to raising Q3 revenue guidance. META became the latest mega-cap tech name to benefit from ad. revenue growth, which analysts have said is positive for Amazon (AMZN) ahead of earnings next week.
- Meta Hit With Trifecta Of Fails: Metaverse, Smart Glasses, Threads What’s next?
-
- Apple Inc (AAPL) Q3 2023 (USD): EPS 1.26 (exp. 1.19), Revenue 81.80bln (exp. 81.69bln), Products revenue USD 60.58bln (exp. 60.67bln), iPhone revenue USD 39.67bln (exp. 39.8bln), Mac revenue USD 6.84bln (exp. 6.37bln), iPad revenue USD 5.79bln (exp. 6.33bln). Apple were lower by 2% after-hours as earnings once again showed declining sales, whilst Amazon was boosted by 8.7% following solid results.
- Apple Slides On Weak iPhone Sales, 3rd Straight Quarter Of Declining Revenues Has Apple lost its magic?
-
- Amazon.com Inc (AMZN) Q2 2023 (USD): EPS 0.65 (exp. 0.35), Revenue 134.4bln (exp. 131.5bln)
- Amazon Soars After Smashing Expectations On AWS Strength, Guides Higher So much for any fears of a cloud slowdown!
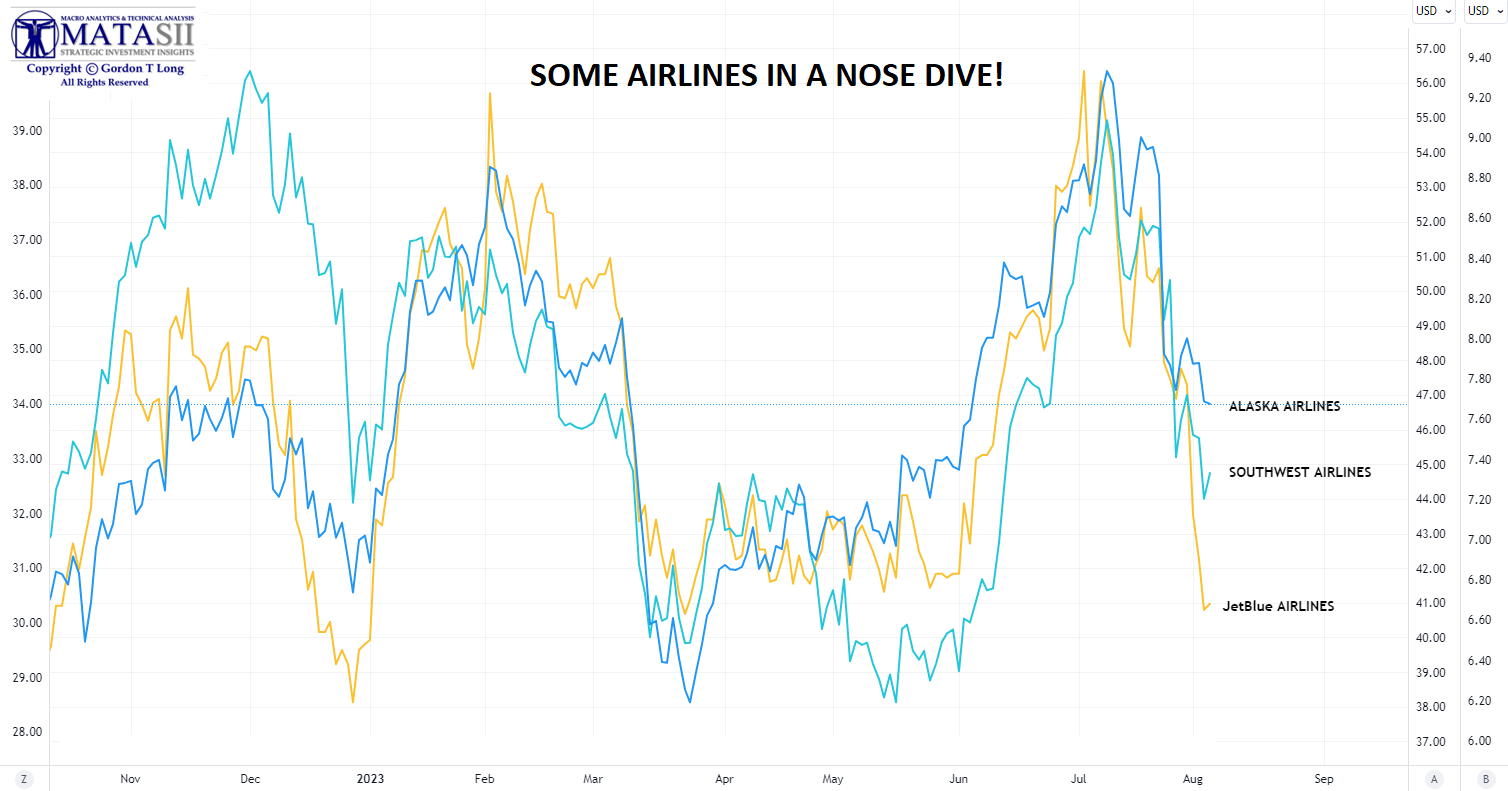
AIRLINES – NOTES
NOTES:
-
- The low fare / economy domestic airlines clearly standout as feeling the pain of a squeezed middle class in America.
- JetBlue Joins Chorus Of Airlines Warning About Slipping Demand “The guidance is extremely disappointing.”
- Alaska Air posts bigger-than-expected loss as costs mount REUTERS – higher expenses related to labor and fuel dented the carrier’s margins.
- Jefferies downgraded Southwest Airlines (LUV); said low-cost airlines appear to be struggling relative to premium peers, citing a key revenue margin for Southwest that shrunk during Q2!
- Southwest Airlines (LUV) marginally missed and beat on EPS and revenue, respectively, noting business revenues are continuing to recover, but not yet back to back to pre-pandemic levels amid higher costs.
- JetBlue (JBLU) cut FY outlook and warned of possible loss in the current quarter as travellers look to go overseas and its partnership with American Airlines (AAL) ends. Note, EPS slightly beat with revenue in line.
MAJOR AIRLINES PERFORMED AS EXPECTED
-
- Delta Air Lines (DAL) surpassed consensus on EPS and revenue and provided stellar guidance. Expects record September quarter revenue with Q3 and FY profit view beating consensus.
- United Airlines Holdings (UAL) Q2 2023 (USD): Adj. EPS 5.03 (exp. 4.04), Revenue 14.18bln (exp. 13.91bln).
- American Airlines (AAL) beat on earnings and lifted FY view for adj. profit, powered by strong demand for domestic and international travel despite fears of a looming economic slowdown. On the North East Alliance (NEA), it is not anticipating any earnings impact, but attention remains on it.
- United Airlines (UAL) beat on EPS and revenue, alongside lifting both Q3 and FY profit view. UAL is comfortable with its current level of liquidity, particularly given the uncertain macroeconomic backdrop.
GLOBAL ECONOMIC REPORTING: What This Week’s Key Global Economic Reports Tell Us
 NFP – AUGUST
-
- The US economy created 187K jobs in July of 2023, below market expectations of 200K and following a downwardly revised 185K in June.
- The reading is also below the average monthly gain of 312K over the prior 12 months, but remains about twice the 70K-100K needed per month to keep up with growth in the working-age population.
- Job gains occurred in health care (63K), namely ambulatory health care services (35K) and hospitals (16K); social assistance (24K); financial activities (19K), namely real estate and rental and leasing (12K); and wholesale trade (18K).
- Employment in leisure and hospitality increased by 17K but job gains in the sector have shown little employment change in recent months, following average monthly gains of 67K in Q1.
- However, employment in leisure and hospitality remains below its February 2020 level by 352K.
- Payroll figures for May were also revised lower. With these revisions, employment in May and June combined is 49K lower than previously reported.
JOLTS: Wheels Come Off The “Strong Jobs” Myth – Job Openings Dropped To 2 year Low As Number Of Hires And Quits Plunged
-
- Job openings were modestly down in June, falling to 9.582mln from the revised 9.616mln and beneath the expected 9.610mln, while the quits rate printed 2.4% (prev. 2.6%).
- The headline fell to their lowest level since April 2021, but there is still a large gap between the long-term average level, or one consistent with slack in the labour market. In addition, while the quits rate fell, the measure is quite volatile, and Oxford Economics notes it remains at a level that indicates continued pressure on wages as many workers leave jobs in search of other (higher paying) opportunities.
- Overall, Oxford Economics adds, “though we expect last week’s rate increase to be the last, risks are tilted towards additional tightening if the Fed determines the data warrant it.” As such, the consultancy adds, June’s JOLTS report sits squarely in the middle – continued, clear progress, but at potentially too slow a pace for the Fed’s liking.
- Looking ahead, OxEco anticipate similar results from July’s employment report, with job gains only slowing marginally.
QUICK NOTES
-
- Fed SLOOS noted tighter standards were reported across businesses and households with weakening demand, while banks expect to further tighten standards in the second half of the year.
-
- Treasury Quarterly Financing Estimates showed it will issue USD 852bln in October-December and assumes an end-December cash balance of USD 750bln, while it expects to borrow USD 1.007tln in net marketable debt for July-September, which is up USD 274bln from May estimate.
-
- US Manufacturing Surveys Confirm Contraction; Employment Weakest Since COVID Lockdowns – Manufacturing Sector Loses Jobs For 5th Straight Month; ADP Report Shows Wage-Growth Slowing
- “Manufacturing continues to act as a drag on the US economy, the recent spell of malaise persisting at the start of the third quarter…”
- Following weakness in the Manufacturing ISM/PMI employment data, expectations for ADP’s employment report were for a big slowdown from June’s massive 497k addition (driven by consumer-facing service industry gains) to a more ‘reasonable’ 190k addition in July. But no, ADP’s Employment Report printed a much better than expected 324k addition in July (with June downwardly revised to 455k)…
- The Manufacturing survey for July missed expectations at 46.4 (exp. 46.8), but rose from the prior 48.1.
- New Orders helped with the rise, rising from 47.3 from 45.6, albeit still remaining in contractionary territory.
- Prices Paid rose in July, albeit still sub-50, printing 42.6, up from the prior 41.8 but short of the expected 42.8, showing prices are slowing but not as much as June.
- Employment saw a steep fall to 44.4 from 48.1, deeper than the expected decline to 48 – showing signs of a loosening labour market in the manufacturing sector ahead of Friday’s NFP report.
- The Services ISM PMI is due on Thursday for a view of the services sector, which has been holding up better than manufacturing. This data is at odds with some of the strong US releases we have seen recently, helping those support the soft landing argument, although the broad contraction in manufacturing is worth monitoring given the nine consecutive months of contractions.
WHAT DOES YOUR SCAN OF THE DATA BELOW TELL YOU? – THE MEDIA AVOIDS BAD NEWS!
We present the data in a way you can quickly see what is happening. Anything in Red is further deterioration.
In Green is an improvement over the last release.
THIS WEEK WE SAW
Exp=Expectations, Rev=Revision, Prev=Previous
CONCLUSION
Between the 1st US debt downgrade in Aug’11 and the second on this week (Aug’23) US sovereign debt is up $18 trillion to $30 trillion.
The CBO predicts that US debt will rise to $52 trillion in one decade, by 2033 or rising by $5.2 billion every day for the next 10 years! (CHART RIGHT)
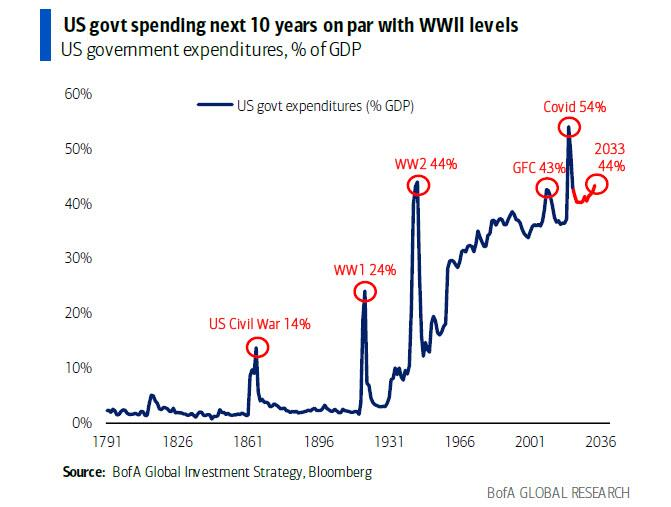 The US government is spending a crisis-like 44% of GDP, which is higher than the WW2 peak, and suggesting that the US is currently at war with someone? (CHART RIGHT)
Debt downgrades ≠ fiscal discipline, because just like central banks are still in the business of bailing out Wall St, so governments are very much in business of bailing out Main St.
“Ultimately, the policy destination is Yield Curve Control across G7 once the next recession provokes fiscal policy panic and even higher government default risk.” – Michael Hartnett BoAML
DON’T TAKE YOUR EYE OFF ENERGY!
ENERGY PRICES MAY BE HEADED HIGHER, EVEN IN A SLOWING ECONOMY
Click All Charts to Enlarge
1- SITUATIONAL ANALYSIS
CLEAN ENERGY
 Let me be clear about where I stand on the following before you ignore this week’s comments on opportunities in the field of Petroleum supply.
-
- I support the systemic and structural move to sustainable clean energy.
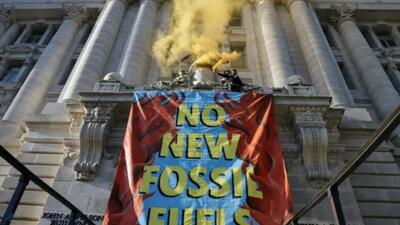
- I am skeptical of the fear mongering about the realities of the rapid destruction of clean burning Fossil Fuel in pursuit of an urgent ‘war’ to combat Climate Change.
- I am against the current US Energy Policy of Energy Dependency through an unrealistic & naive time-line of Fossil Fuel termination.
- I support a technology focus on a balance of Nuclear Fusion & SMR Natrium for Power Generation, Hydrogen Fuel Cells for transportation, clean burning fossil and a full spectrum of supporting wind, solar and tidal technologies for economically sound applications.
- I believe the above should all be based on cost and efficiency savings and not on ideological central regulatory edict.
There are tremendous investment opportunities in the petroleum industry, not just for energy, but the 72 industrial sectors dependent on it ranging from cosmetics to plastics. When electricity generation is soon found to have been crippled by the current US Energy policy, prices will soar and the public will demand answers – not platitudes and empty philosophies!
ENERGY COMPLEX
 Few have noticed that commodities have been the best performing asset since the May 31st US debt ceiling resolution! The 2020’s secular buying catalyst was supply driven by US aniti-fossil fuel government policy, while the 2023 catalyst so far has been about the delayed recession.
Lately it has been increasingly about the growing belief in a “soft landing”. However, the recession is coming, which historically meant that undervalued assets with profits will perform better.
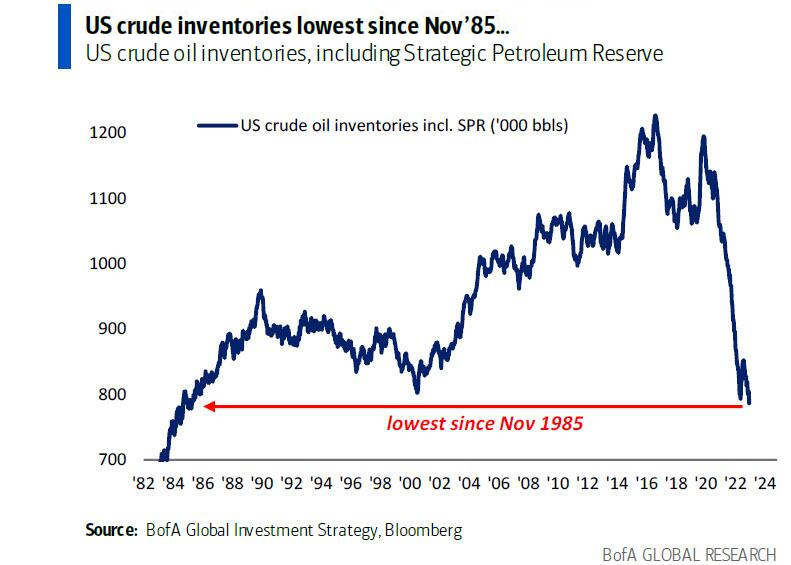
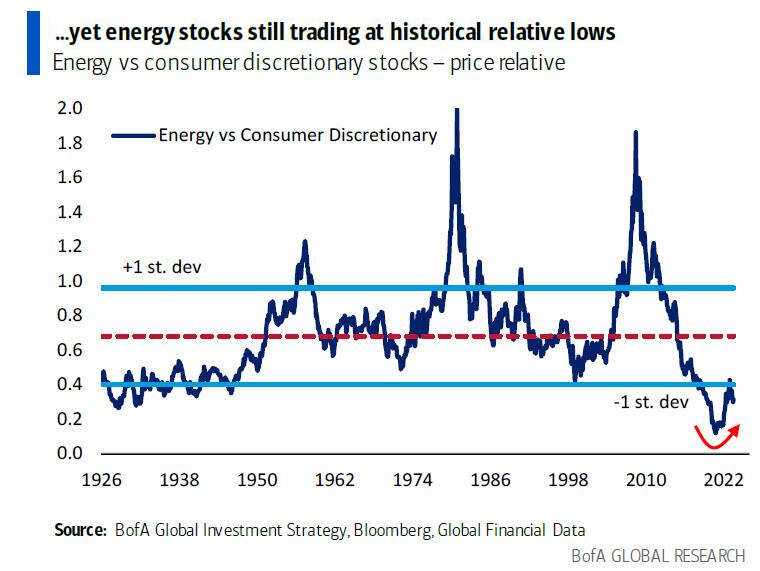
The chart to the right illustrates, US crude Inventories are presently at their lowest level since November 1985! This will mean petroleum supply is likely to increase in value since even a slower economy requires what petroleum delivers – electricity generation and raw materials for the 72 dependent industries. The low inventories are thanks to President Biden intentionally draining the US Strategic Petroleum Reserves (SPR), thereby sending US oil inventories to the lowest level since Nov’85.
Meanwhile, as shown below, energy stocks are still trading at historical relative lows.
SAUDI ARABIA CUTS IS DRIVING THIS LIFT IN CRUDE
There is a major Geo-Political battle presently raging as Saudi Arabia has rejected the US foundation for the original need for the creation of the Petrodollar, (which was the central issue for inflation in the early part of the 1970’s), as Saudi Arabia has now actively aligned itself with the BRICS against the US and US Dollar.
The Saudi Press Agency is reporting:
An official source from the Ministry of Energy announced that the Kingdom of Saudi Arabia will extend the voluntary cut of one million barrels per day, which has gone into implementation in July, for another month to include the month of September that can be extended or extended and deepened.
In effect, the Kingdom’s production for the month of September 2023 will be approximately 9 million barrels per day.
The source also noted that this cut is in addition to the voluntary cut previously announced by the Kingdom in April 2023, which extends until the end of December 2024.
The source confirmed that this additional voluntary cut comes to reinforce the precautionary efforts made by OPEC Plus countries with the aim of supporting the stability and balance of oil markets.
The biggest question currently in the oil markets is how long Saudi Arabia will extend its 1 million-barrel-a-day supply cut. Riyadh’s handling of a previous strategy offers some guidance — and reassurance — for crude bulls. It will be drawn out, but eventually taken away for higher prices.
With the overall US equity markets stretched from a valuation perspective, it now appears to be a good idea to keep a close eye on Energy if the markets were to pull back further as a result of weakness in the overall equity markets. An opportunity may soon be at hand to position your portfolio for the Longer-Term in an undervalued energy sector.
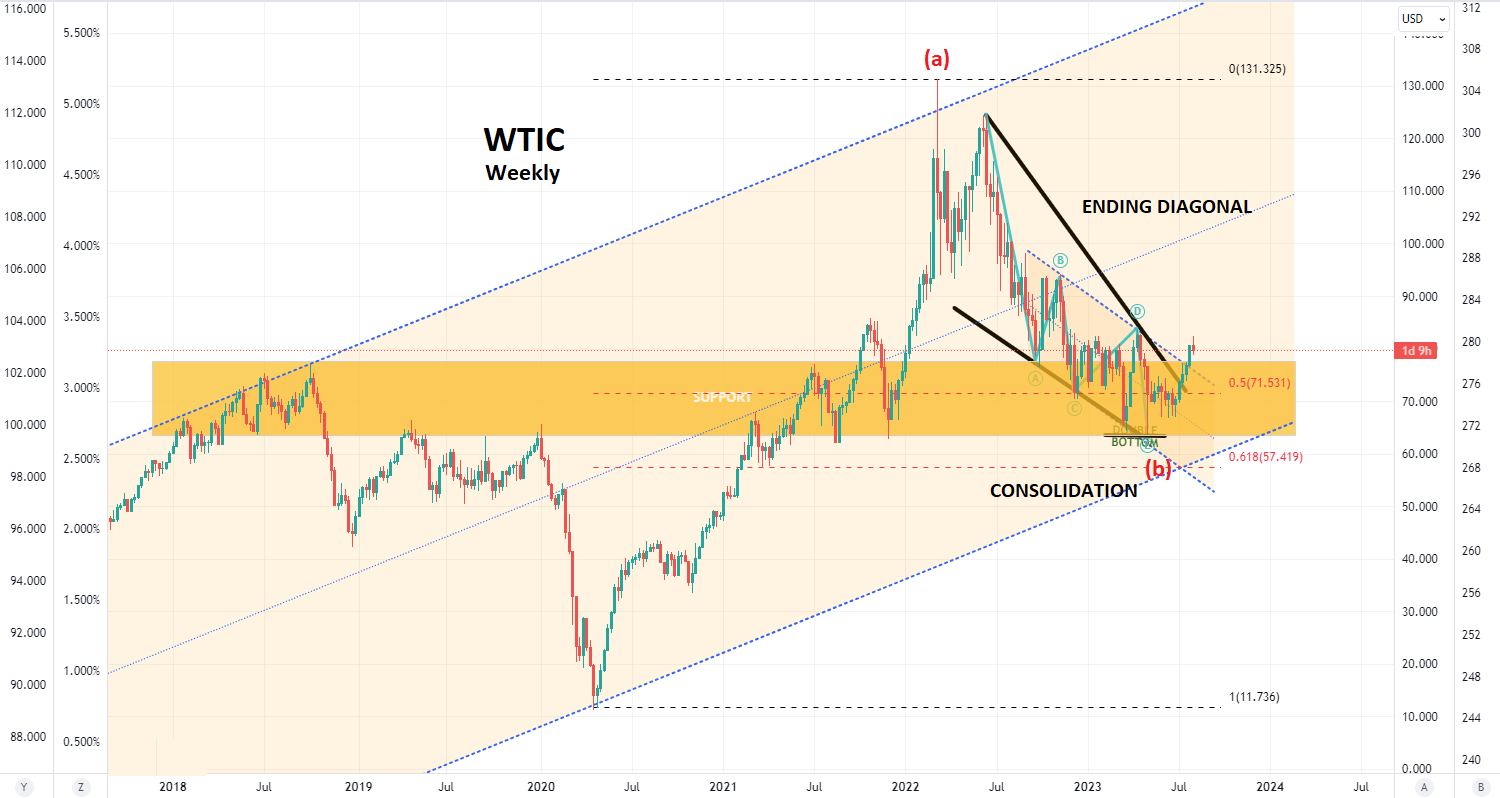
ENDING DIAGONAL CONSOLIDATION
Though energy appears to have broken out from its downward trend, there is still a possibility of the sector wanting to test the prior lows once Saudi Arabia resumes the production of the current 1 million barrel-a-day supply restriction.
TECHNICAL ANALYSIS
Note: The Elliott Wave Count used below is that of MATASII.com for the WTIC CFD’s, but those counts are labeled as within the larger construct developed by the widely followed Technical Indicator Index.
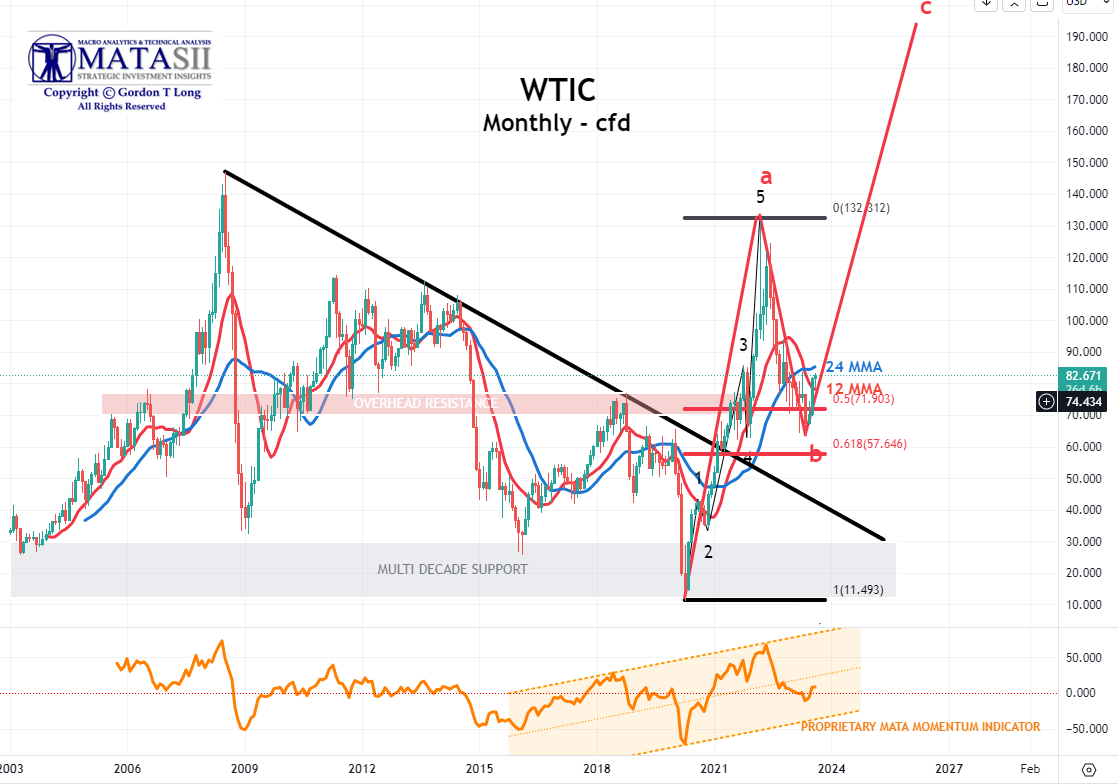
WTIC
MONTHLY – cfd
There is a possibility that the Saudi cuts may move WTIC to the 24 MMA (shown below) at approximately $85/bl….. or higher if the cuts are sustained or increased.
YOUR DESK TOP / TABLET / PHONE ANNOTATED CHART
Macro Analytics Chart Above: SUBSCRIBER LINK
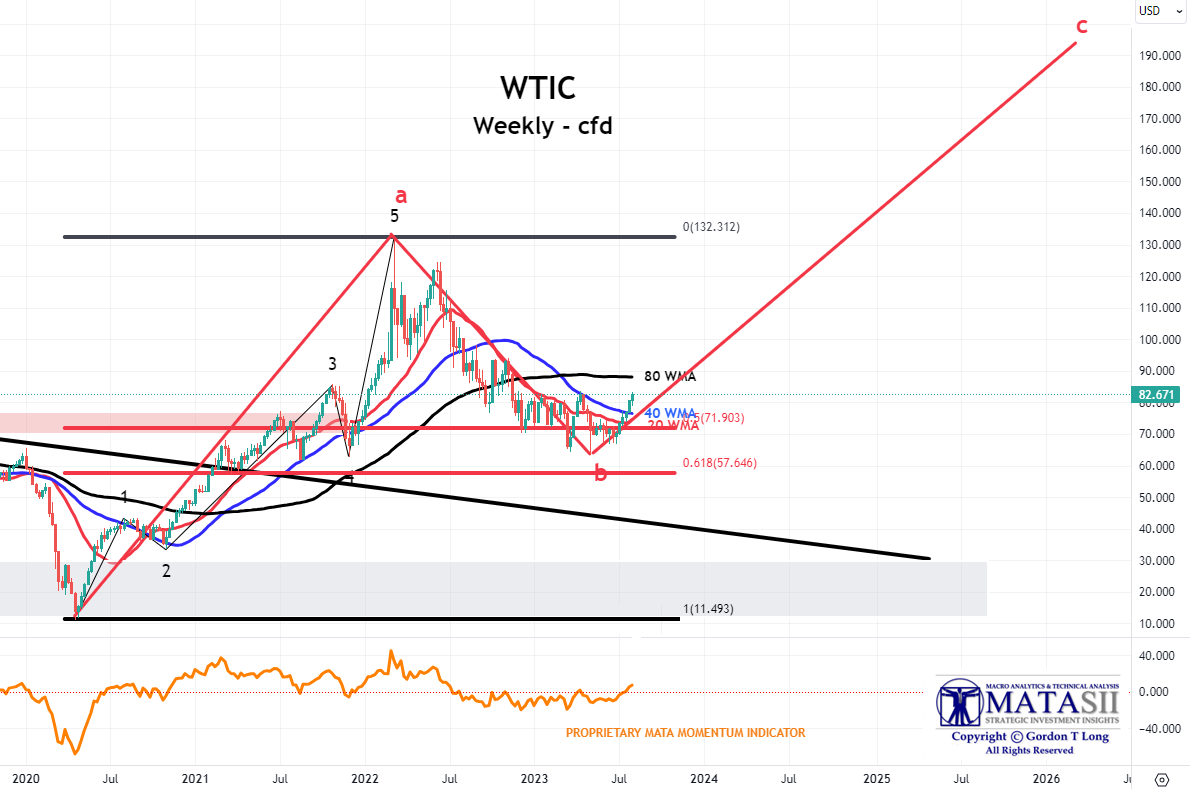
WEEKLY – cfd
The Weekly chart suggests the possibility of a move slightly higher towards the 80 WMA at ~$88/bl before pulling back.
YOUR DESK TOP / TABLET / PHONE ANNOTATED CHART
Macro Analytics Chart Above: SUBSCRIBER LINK
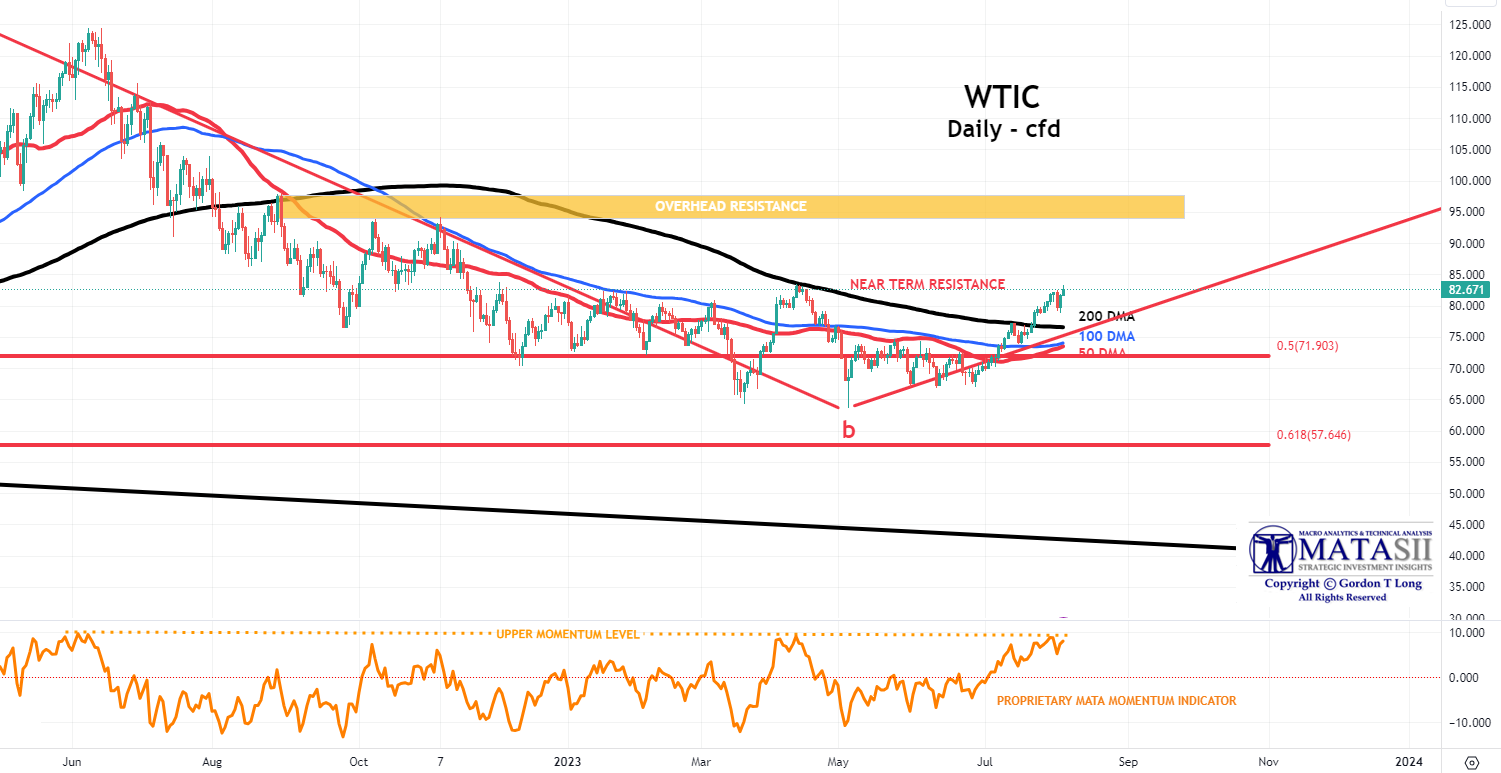
DAILY – cfd
The Daily chart suggests that in the short term WTIC may face overhead resistance, but after some further consolidation a move towards intermediate term overhead resistance at ~$94/bl is a possibility.
YOUR DESK TOP / TABLET / PHONE ANNOTATED CHART
Macro Analytics Chart Above: SUBSCRIBER LINK
All of these possibilities should be monitored in the assessment of determining when to begin developing an Energy positioning. We discuss the reasons in this week’s newsletter entitled “Fitch’s Downgrade a Vote of Non-Confidence in Bidenomics!” Gold, Energy and Commodities have historically proven to be protection against an eroding US Dollar.
COMMODITIES
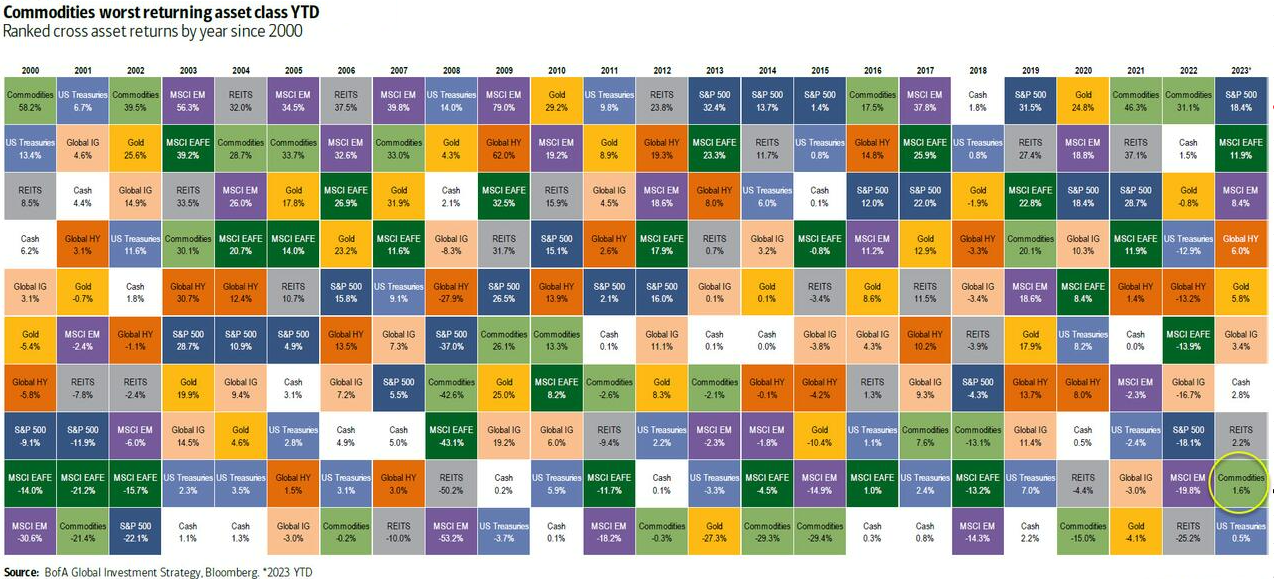
The Food and Agriculture Organization of the United Nations (FAO) this week warned of Food prices again rising. With rising Food prices coupled with ongoing relative strength in Energy, the overall Commodity Sector may be worth consideration on any equity market weakness. It has been the worst performing sector in 2023. (see circle below).
IN 2019 WE CONCLUDED WE WOULD SEE A COMMODITY SUPER CYCLE IN THE 2020’S
FAIR USE NOTICE This site contains copyrighted material the use of which has not always been specifically authorized by the copyright owner. We are making such material available in our efforts to advance understanding of environmental, political, human rights, economic, democracy, scientific, and social justice issues, etc. We believe this constitutes a ‘fair use’ of any such copyrighted material as provided for in section 107 of the US Copyright Law. In accordance with Title 17 U.S.C. Section 107, the material on this site is distributed without profit to those who have expressed a prior interest in receiving the included information for research and educational purposes. If you wish to use copyrighted material from this site for purposes of your own that go beyond ‘fair use’, you must obtain permission from the copyright owner.
NOTICE Information on these pages contains forward-looking statements that involve risks and uncertainties. Markets and instruments profiled on this page are for informational purposes only and should not in any way come across as a recommendation to buy or sell in these assets. You should do your own thorough research before making any investment decisions. MATASII.com does not in any way guarantee that this information is free from mistakes, errors, or material misstatements. It also does not guarantee that this information is of a timely nature. Investing in Open Markets involves a great deal of risk, including the loss of all or a portion of your investment, as well as emotional distress. All risks, losses and costs associated with investing, including total loss of principal, are your responsibility.