
IN-DEPTH: TRANSCRIPTION - LONGWave - 07-12-23 - JULY – A Historic H1! What’s Next?
SLIDE DECK
TRANSCRIPTION


SLIDE 2
Thank you for joining me. I'm Gord Long.
A REMINDER BEFORE WE BEGIN: DO NO NOT TRADE FROM ANY OF THESE SLIDES - they are COMMENTARY for educational and discussions purposes ONLY.
Always consult a professional financial advisor before making any investment decisions.
SLIDE 3
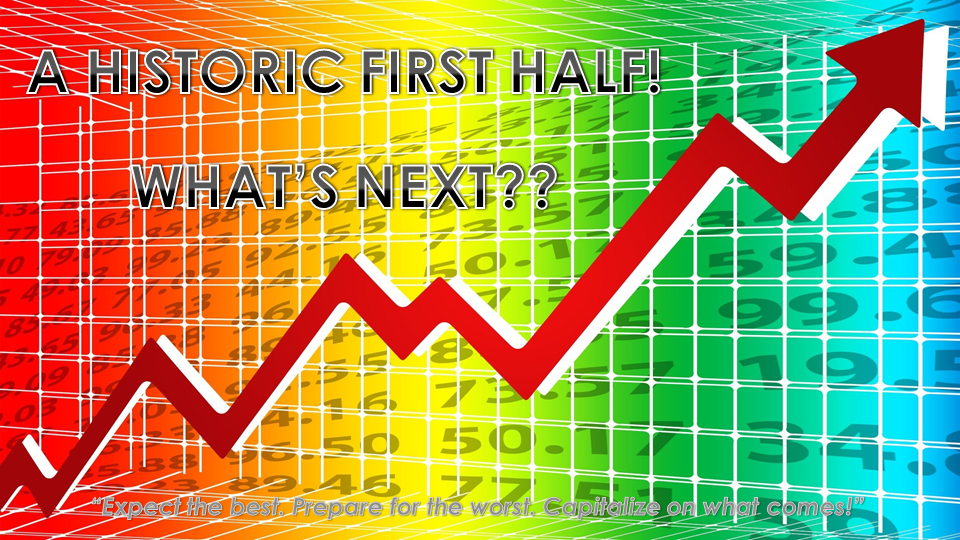
The first half of 2023 turned out to be “one for the record books”, on many fronts!
The question now is what is next?
SLIDE 4
This isn’t the first time markets have done something like this but it certainly is unusual. What does history tell us we should next expect?
As many have written in various forms: “learning History is Easy: Learning its lessons is almost impossibly difficult!’
Let’s see what we can conclude as we work through the subjects listed here.
SLIDE 5
Let’s start by briefly recapping what we have witnessed.
SLIDE 6
All market types had major moves, but the US Stock Market was the eye catcher.
Crypto up 52.9% in six months
Stocks up nearly 15% but over 20% since the 2022 market lows, placing them officially in a new Bull Market – if you believe these Wall Street marketing categorizations
Even cash was a performer (at least in nominal terms)
While commodities across the board, were not the place to have been in the first six months of this year.
SLIDE 7
The S&P 500 is just short of retracing a Fibonacci 0.76 level of the drop we witnessed in 2022. Extraordinary by any measure!
However, is this the end and we experience a classic “Y” downward leg equal to the initial “W” leg? It just seems too much of a coincidence since that would give us exactly a standard Fibonacci 0.618 retracement of the entire Post Covid-19 run-up?
Our long time subscribers will notice the S&P 500 level of 3195 shown here is just about exactly our long held 3270 target which we spelled out in early 2022.
More coincidences?
SLIDE 8
Most don’t appreciate that the S&P 500 index returns were negative YTD if you exclude the top 28 names.
The YTD market cap gains of the Big Technology 7 were greater than the GDP of Germany!
The top three market cap players of Apple, Microsoft and Google with ($7T in market cap) exceeded all of the Emerging Markets with 6.5 BILLION people producing whatever they produce. By the way what they mostly produce is various raw materials called commodities which were the worst performers.
SLIDE 9
I have written about the extraordinary narrow breadth of this market only seen during the Nifty 50 era in the 60’s and the Dotcom Bubble in the late 1990’s. It all actually started in January when the news flows on Artificial Intelligence coincided with a sudden unexpected surge in the markets.
SLIDE 10
Our Proprietary MATASII Cross signaled a BUY in late January for the Big 8 technology players.
SLIDE 11
What didn’t get much play at that time is the explosive lift in Nvidia which occurred when we got that BUY signal in the Big 8 Technology stocks. This is highlighted here by the circle.
More recently the market has been about Nvidia, Tesla and the Gamma Meme players betting the farm!
SLIDE 12
I am personally not sure how long this will last before we have a substantial consolidation to find firm support. “Trees Simply Don’t Grow to the Clouds!” But we are close as we have been highlighting in the weekly MATASII newsletters.
Yes AI is only getting started and it will no doubt be huge – but nothing goes straight up – at least history tells us that.
SLIDE 13
But the markets are more than just the stock market! Rising yields have made Cash a major winner.
SLIDE 14
Hugh money has flowed out of poorly yielding bank deposits into high paying money market funds. The one year riskless US Treasury Yield was paying nearly 5.5% on Friday! It was long ago that number was close to zero!!
SLIDE 15
The overall distortions have been so great that many would be surprised to know that the flow winners have been Cash, IG Bonds and EM equities.
The YTD flow losers have been US & EU stocks, TIPS, Bank Loans and HY / Junk Bonds.
There is a message here!
SLIDE 16
Seasoned long-time institutional investors have seen this sort of “Euphoria”, Greed and “Fear of Missing Out” (or FOMO) before!
What do they see and what are causing the distortions and divergences in their charts?
First they don’t believe inflation is anywhere near yet being under control!
Those that lived through the 70’s learned how difficult it is to get the inflation genie back in the bottle when negligently let lose.
SLIDE 17
They look at a falling CPI, and as we spelled out in a recent newsletter, this is directly tied primarily to the reduction in gasoline prices and that was due to an exactly correlating selling of the US Strategic Petroleum Reserves by the Biden administration prior to it launching the Bidenomics economic election platform!
Conversely, the UK was shocked at their recent CPI and were forced to spike their rates 50 basis points – and they aren’t the only ones.
Globally, we are at best in round 3 of a major 10 round fight! Central Bankers now know they need a Recession to regain control.
SLIDE 18
Treasury Secretary Janet Yellen boldly claims “you can’t have a recession with job markets being this tight and unemployment so low”! At 3.4% in April this was lowest since 1969.
She may have forgotten, or needs to be reminded, that the all-time low was in April of 1929.
SLIDE 19
In actual fact as we have been reporting the Employment levels as shown in the top left and the unemployment levels in the bottom right have now established clear monthly and weekly trends. We feel and are fairly confident that these numbers will soon abruptly and rapidly accelerate in the direction of their newly established trends!
SLIDE 20
Ms Yellen needs to review some of the charts we have recently published in our newsletters or look at this one to see how abruptly this changes.
This charts shows the Fed Funds Rate when it reaches the neutral rate and goes “on hold” as we are close to doing, the Job Openings divided by Unemployment level normally drops like a stone!
The ratio is consistent even in prior era’s which we showed in our Annual Thesis paper outlining the approaching era of Stagflation.
SLIDE 21
The government is consuming too much of the nations resources as the US budget DEFICIT alone in the past 12 months is the largest in 60 years outside of recession of a war – at $2.1T or 8% of GDP.
The proposed 2024 Federal Budget would make the US Government Bureaucracy the 3rd largest economy in the world!
SLIDE 22
Though I have been mostly focused on the US so far, the problems today are Global.
- German, France, and the EU overall, have serious economic problems.
- Japan has inflation that is crippling it and altering the Japanese Carry Trade.
- China is not emerging as anticipated from the post Covid lockdowns! The list goes on!
All of this doesn’t bode well for the stock market.
SLIDE 23
However, Economics and Markets are simply two different beasts and though they track together over the longer term, the short terms are a different animal!
So what does history tell us?
SLIDE 24
Since 1945, while the S&P 500 gained an average of 4.2% during all H2s, rising in price during 69% of all years, whenever the market’s H1 return exceeded 10%, the S&P 500 posted an average H2 advance of 8.0%, and gained in price 82% of the time.
Since 1990, all sizes, styles, sectors, and 92% of all sub-industries gained in price in H2 following an S&P 500 rise in H1.
Slide 25
If you believe Wall Street it looks like 1H equity performance is doing a “booty call” to 2nd.
The last 11 times equities were up >10% in the 1H, the market continued higher in the 2H. You have to go back to 1987 to find the first reversal.
SLIDE 26
So will the Bull Market we are told we are now in continue or will the Bear re-emerge and continue the next leg downward?
History is saying YES to the Bull Market!
SLIDE 27
One of the more convincing arguments seen by many is that it increasingly looks like earnings have already troughed.
This is something that stocks sniffed out back in late 2022 when the S&P bottomed around 3,500. This in our opinion is the strongest argument for the Bulls. The markets always tell you – if you re listening!
SLIDE 28
Experienced traders also see that the Citi US economic surprises index is "breaking upward “significantly!
This indicator and the SPX have previously more or less moved in tandem.
SLIDE 29
There are also big camps of optimists that see a market lift coming due to the AI revolution that many see as comparable to the Dotcom boom when the internet arrived.
That model suggests a relatively minor near term pull back then an exploding investment boom as the Fed is forced to pivot with lower rates as the recession starts to really bite!
SLIDE 30
This camp therefore sees a Hotter but Shorter Cycle
SLIDE 31
Unless you have been living under a rock you are well aware that almost all Economic Indicators domestically and globally are screaming of dire problems ahead!
SLIDE 32
We have been laying these out in our weekly newsletters.
We have a massively inverted yield curve signaling a recession which has never been wrong before nor as deeply inverted since the early 1980’s.
There is little doubt we have a recession ahead which can be expected to pull earnings down and compress PE ratios.
SLIDE 33
We have tighter credit standards with credit contraction already occurring. The Commercial Real Estate sector is already feeling serious stress.
SLIDE 34
The collapse in PPI, which while normally welcome as it signals sharp disinflation, can also be seen as precursor to a collapse in sales growth.
SLIDE 35
This also matches up with other markedly ugly boom/bust period in recent US history.
SLIDE 36
We also are seeing collapsing Import/Export Pricing Data which is also sending the same signal.
Something major and bad is coming!
SLIDE 37
Then we have a whole world of liquidity which again we spend a fair amount of time on in our newsletters.
SLIDE 38
The bottom line is that Fiscal stimulus over the past 12 months has been enormous and is ending. Yes that can be reversed by changes in Fiscal and Monetary Policy but both works with 8-12 months lags at a minimum!
SLIDE 39
We think this chart shows clearly what is about to happen. Previous policy decisions to combat inflation are about to hit. The lag is over and we will see the storm arrive in Q3 / Q4.
SLIDE 40
The trend is pretty clear when you consider the gap between the real Fed Funds Rate adjusted by different consumer inflation measures and the estimated neutral rate.
SLIDE 41
This chart shows the coincident comparison of the aggregated shrinkage in central bank balance sheets and the S&P 500.
We can expect the current divergence to be resolved in favor of the direction of the central bank balance sheet growth.
SLIDE 42
The weekly aggregated week change is currently quite aggressive!
SLIDE 43
The tightness is taking money out of the system, reducing bonds prices and driving yields higher. We have broken some major short term overhead resistance in Bond Yields as the 10 year US Treasury is now trading over 4%.
We have long held that 4.2% is when the equity markets choke! Time will tell!
SLIDE 44
These are trends that cannot be changed quickly and in the case of the recent US Debt Ceiling increase that left the US Treasury General Account almost empty it needs cash fast to keep the government funded!
SLIDE 45
Higher bond yields never bode well for the equity markets!
SLIDE 46
Piling on debt which will lead to an effective increase in liquidity takes time. However, it can quickly destabilize markets.
This is a central question of whether we are about to de-stabilize the global financial system?
SLIDE 47
Here is what most are missing in our estimation.
GDP must equal GDI as part of a double entry accounting system.
GDP is fundamentally about money flows.
GDI is about what that money flow yields for the economy!
SLIDE 48
As you can see from the Fed’s reporting, historically there has been a very close correlation going all they way back to when the system was put in place.
That is until Covid and Bidenomics arrives. There is something happening that is different?
SLIDE 49
According to the government’s own Bureau of Economic Advisors the GDI was negative in Q1 of this year and Q4 of 2022. That means the US Economy is already in a recession.
However GDP has been massaged into being positive and in fact Q1 was significantly and shockingly increased last week in-line with the launch of Bidenomics as the cornerstone of the Biden re-election campaign.
I would love to get into what is going on here as it regards M1/M2 money collapse and velocity of money changes occurring. But we are almost out of time and have to leave that to the weekly newsletters.
Suffice it to say, you can on massage the data for public consumption before you run out of runway! If this economic plane doesn’t lift off quickly, Bidenomics may be compared to an exploding Zeppelin!
SLIDE 50
So what is likely next?
It really comes down to the reality of earnings and PE compression.
SLIDE 51
The S&P appears 20-30% overvalued based on current PMI levels.
SLIDE 52
The "fair value" of the S&P is approximately 3,126 – pretty close to our long held belief that the market is headed to 3270.
SLIDE 53
There is likely to be another bout of EPS downside ahead through the end of 23, followed by stability in ‘24.
SLIDE 54
The average earnings recession is also likely to trough near -16%.
SLIDE 55
Margin compression is no doubt going to be a key driver of EPS growth deceleration.
SLIDE 56
The leading Macro Data points to downside in EPS surprises over the next several months.
SLIDE 57
Forward EPS growth is now negative for just the fifth time since 2000. History tells us that price downside is in front of us, not behind!
SLIDE 58
What do we conclude with all these mixed signals?
SLIDE 59
We still favor the fact that this market correction is only half way through.
We have another leg down to soon unfold as a result of:
- Weakening Earnings,
- Falling PE compression ratios,
- Layoffs and rising unemployment
- Bankruptcies within the Zombie “JNK” CCC and below corporations
When this is complete this WXY corrective structure will turn impulsive and the markets will enter a new real bull market in price – likely as the US dollar denominated us market rises as a direct result of a falling US dollar. Similar to what happened recently in Venezuela!
SLIDE 60
If we are wrong here then the realities of stagflation will deliver a downward structure as outlined here. Many Elliott Wave devotees see this pattern ahead.
As an old sailor who has seen many storms on the horizon while plying the Atlantic cost it is always best to prepare for the worst.
Even when my set and drift suggested that we would miss the storm or only face heightened short lived tough sailing it was always best to prepare for the worst while we had the option. It is too late when the storm hits to adjust sails and fasten down the hatches.
The old adage of “Prepare for the worst, but hope for the Best” always guided me home to a welcome safe haven!
SLIDE 61
As I always remind you in these videos, remember politicians and Central Banks will print the money to solve any and all problems, until such time as no one will take the money or it is of no value.
That day is still in the future so take advantage of the opportunities as they currently exist.
Investing is always easier when you know with relative certainty how the powers to be will react. Your chances of success go up dramatically.
The powers to be are now effectively trapped by policies of fiat currencies, unsound money, political polarization and global policy paralysis.
SLIDE 62
I would like take a moment as a reminder
DO NO NOT TRADE FROM ANY OF THESE SLIDES - they are for educational and discussions purposes ONLY.
As negative as these comments often are, there has seldom been a better time for investing. However, it requires careful analysis and not following what have traditionally been the true and tried approaches.
Do your reading and make sure you have a knowledgeable and well informed financial advisor.
So until we talk again, may 2023 turn out to be an outstanding investment year for you and your family?
I sincerely thank you for listening!

