IN-DEPTH: TRANSCRIPTION - LONGWave - 11-08-23 - NOVEMBER – The Slow Choking of Credit
SLIDE DECK
TRANSCRIPTION


SLIDE 2
Thank you for joining me. I'm Gord Long.
A REMINDER BEFORE WE BEGIN: DO NO NOT TRADE FROM ANY OF THESE SLIDES - they are COMMENTARY for educational and discussions purposes ONLY.
Always consult a professional financial advisor before making any investment decisions.
SLIDE 3 - COVER
Despite the false Wall Street Sell Side optimism there is a Recession coming to the US and it is not going to be one that could be labeled even remotely as a “soft landing”.
I want to show why, what to look for to confirm this and when we currently expect it to arrive.
SLIDE 4
As such I want to cover the items outlined here.
Sometimes we show a lot of charts which can potentially cloud the implicit message that needs to be heard.
I would like to therefore start with the Key Messages that are in the charts which I am going to take us through.
SLIDE 5
FIRST: There are real consequences of a monetary policy period that held interest rates too low for too low. This has led to not only elevated asset valuations, excess leverage and historic debt levels but also changes that are clouding what have been historically reliable warning statistics.
Examples are Smart Borrowers have locked in low borrowing rates, we have a structural demand problem and we have witnessed an increasing shift to foreign borrowing to finance the US standard of living.
SECONDLY: Bidenomics has confused the signals within the credit transmission mechanism and the scale of lending has the potential to shift a former more balanced financial control from Monetary Policy to Fiscal Policy. The result may be that Paul Volcker’s proven Liquidity solution to resolving Inflation may be in jeopardy.
THIRDLY: Liquidity is obviously the dominant controller of financial markets but must now be monitored differently as listed here.
FOURTH: The complications of the world shifting from a Uni-Polar world to a Multi-Polar world are profound and the Geo-Political fallout is increasingly driving investment strategies.
SLIDE 6
The big picture needs to be in the forefront of our minds to better tie these messages together.
SLIDE 7
Quantitative Easing was initially launched as part of the recovery effort after the 2008 Financial Crisis. It was aimed at lowering interest rates to bring demand forward and help propel the recovery. It was continued in multiple waves with each wave being less successful as demand pull stealthily fell with corporate revenues weakening.
Though CEO’s often cited top line revenue growth rate concerns it was always overshadowed by great bottom line EPS growth as a consequence of low finance rates, stock buybacks and borrowing to boost dividends. Well, that has all come to a grinding halt as rates are now beginning to cramp consumer spending and demand has become the number one topic of Q3 earnings calls.
SLIDE 8
Also lost in the narrative of rising stock markets over the decade was the consistently ignored fact that the US national debt has began growing faster than the US economy.
When your household’s debt growth is increasing at a faster pace than your income you likely pull in your horns before the interest and repayment schedule of the debt suddenly puts you into bankruptcy.
Not so with the US government which simply accelerated its’ debt growth rate?
Like an addict, it simply looked for more to satisfy its ever growing addiction.
SLIDE 9
During this era of Monetary Mal-Practice we went through the expected stages from Hedge Financing to Speculative Finance to Ponsi Finance until we finally arrived at the point where the rate of Credit Creation couldn’t be sustained. As it began to fall the US economic growth rate has also fallen.
Slowly large government debt needs have crowded out funding that keeps a healthy economy vibrant.
SLIDE 10
The Long Term chart of the S&P 500 mirrors the period of the Great Moderation when Interest rates continuously fell. Now however we have reached the inevitable end where markets need to consolidate to levels that are economically sustainable.
We have begun that overdue consolidation.
We are presently trying to find levels that support the rise as a result of what can best be described as the Covid-19 stimulus era. Still in front of us is the whole decade of Quantitative Easing.
SLIDE 11
The Covid consolidation based on our analysis is itself still a long ways from being completed.
SLIDE 12
The real consolidation that is actually required goes all the way back to the bursting of the Dotcom Bubble after which over 50,000 manufacturing facilities subsequently left America with China’s entry into the WTO. This effective de-industrialization of America placed the US firmly in the position of being a nation that produced more than it produced. The die was cast and debt was the only way to keep the US standard of living from necessarily falling.
It is important to not how similar the consolidate process is - but on a much, much larger scale.
SLIDE 13
As I have previously said many times, since Covid we have adopted War Time spending in a Peace Time Economy!
The renowned Stanley Druckenmiller last week referred to government spending as “spending like drunken Sailors”! I think a better analogy is as a “Crazed Crack Addict!”
SLIDE 14
Unfortunately it is actually more about the spending obligations this spending has committed the US to going forward.
It is now simply unsustainable!!
SLIDE 15
…. And the world now recognizes that.
30Y US Treasury Yields since the lifting of the Debt Ceiling in June have begun tracking the US Credit Default Swap Rate.
It doesn’t mean the US will default but rather it is going to cost the US more on its debt because of elevated risk. Rates are going to be higher for longer – much longer!
SLIDE 16
In our annual Thesis paper in January we were very clear that increased Risk Premiums for both Stocks and Bonds were ahead in 2023. We are seeing it in Bonds but not yet in Stocks!
That lies ahead when the coming US recession arrives.
SLIDE 17
We believe Term Premiums have increased by a minimum of 1.5% for the remainder of the decade as part of what we termed the Beta Drought Decade in our 2023 Thesis paper. The full paper is available for download at the MATASII site if you have not yet read it.
SLIDE 18
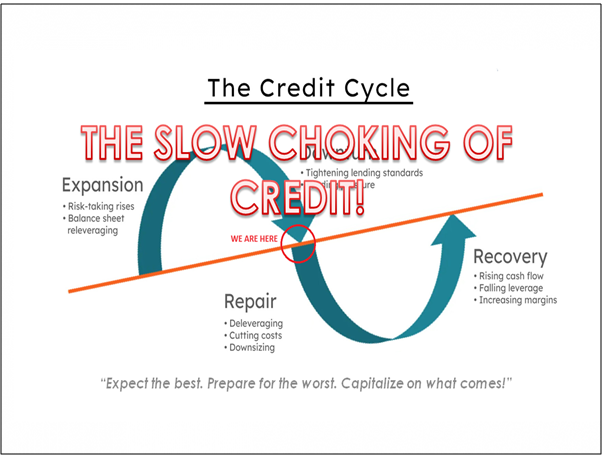
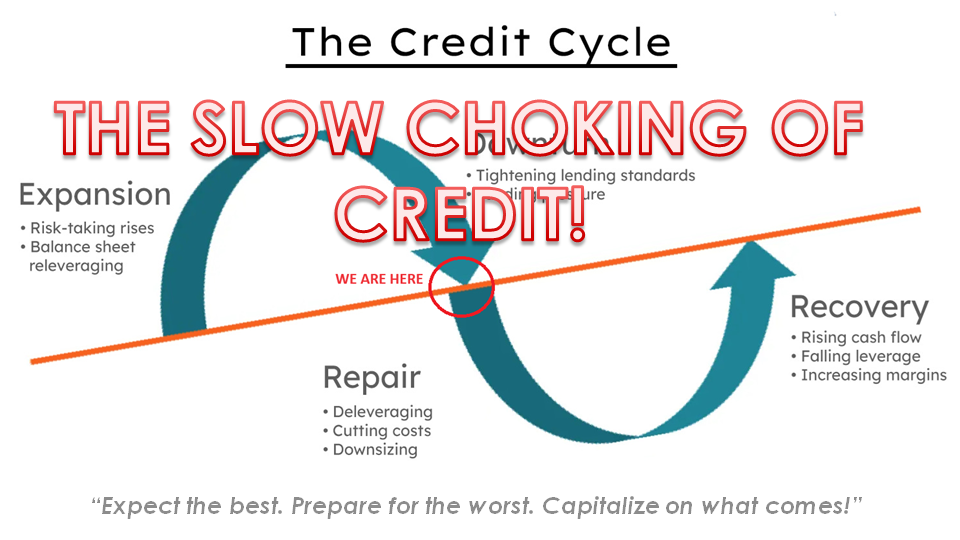
As a result of this and central bank policy we are presently experiencing the Slow Choking of Credit.
SLIDE 19
One way of viewing that tightening is through the Yield Curve which measures the difference between the 3-month and 10-year Treasury yields. It has correctly predicted every recession since 1968. Though optimism has grown for a “soft landing” the inverted yield curve is still correctly signaling a recession. Many are doubtful of what the Yield Curve is signaling since the downturn hasn't yet struck.
What they are impatiently forgetting is that the yield curve inversion typically lags behind the start of the recession, with the average wait time over the past four recessions being 13 months from the start of the inversion. The curve officially inverted on October 26 last year (the Fed data shows) meaning the recession signal is just a few days shy of the 11-month milestone. If history is any guide, that would put the start date of a potential recession sometime in December or January.
Though the yield curve has flattened its inversion over the past few months, that's typical behavior and such a flattening has preceded the last four recessions
The indicator is eight out of eight when predicting recessions, and it doesn't have any false signals. So it's way too early to say this is a false signal. Maybe it does turn out to be a false signal, but you can't say it's a false signal when you're not even at the average!
I believe that a lot of the yield curve skepticism and soft landing narrative stems from the results of what I will call the “Bidenomics Factor”. I have outlined many time recently how Bidenomics has created Stealth Liquidity which is working against the Fed’s tightening. I am not going to review this again but you can review recent newsletters and the September UnderTheLens video entitled “The Realities of Bidenomics”.
SLIDE 20
Global Central Banks have been engaged in an unprecedented monetary tightening program since October of 2022. The US Federal Reserve has raised rates faster than few previous times in it’s’ history.
Campbell Harvey, the Duke University finance professor who coined the inverted yield curve as an indicator of a coming downturn in 1995, recently stated that he believes a recession is imminent due to the Fed's ultra-tight monetary policy having raised the risk of pushing the economy into a downturn, especially when considering the lagged effect of rate hikes - meaning financial conditions could still be in the process of tightening as a result of interest rate hikes enacted last year.
Meanwhile, Quantitative Tightening has reduced the Fed’s Balance Sheet to roughly $7.9 trillion near the end of October 2023, down 11.8% from its peak of just under $9T in April of 2022. The Fed has been shrinking its holdings of Treasuries and mortgage-backed securities at a rate of about $75 billion a month.
SLIDE 21
Banks have been tightening lending standards for over a year.
The Financial Conditions Index has finally kicked in with aggressive readings
Surging Bond Yields are adding another 75 basis points to the Fed Funds Rate tightening efforts.
Real Rates recently exploded higher to approach 2.5%,
The tightening of the Credit Spigot is finally beginning to be felt.
SLIDE 22
It is only over the last 30-45 days that we are actually seeing the initial impact. We are increasingly seeing it in:
- Consumer Credit,
- Credit Delinquencies and Bankruptcies
- Layoffs and Continuing Jobless Claims and
- Falling Employment Growth
SLIDE 23
The truth is that the confirmation has been right in front of all along. We have long held that America is founded and survives on Small Business and the entrepreneurial attitude. As goes small business so goes America.
I saw a list recently that highlighted the richest 10 Americans. Everyone of those listed started as a small business and start-up. Not one had been exposed to the stifling environments of corporate bureaucracies.
- Elon Musk. cofounded six companies,...
- Jeff Bezos. Founded Amazon
- Larry Ellison. $158 B. Founded Oracle
- Warren Buffett. $121 Founded Bershire Hathaway
- Larry Page. $114 Co-Founded Google
- Bill Gates. $111 Co-Founded Microsoft
- Sergey Brin. $110 Co-Founded Google
- Mark Zuckerberg. Founded Facebook
- Steve Ballmer $101 billion... was Bill Gates first hire
- Michael Bloomberg, $96.3B. Founded Bloomberg
SLIDE 24
When small business booms, America Booms. When small business is stifled, America grinds to a halt.
For the last four years small business has ground to a halt and is now approaching free-fall with these elevated lending rates – the life blood of growing small business.
SLIDE 25
Financial writer John Authors writes: "...the proportion of banks tightening rather than loosening standards for commercial loans has now hit almost 50%. It’s only been exceeded during the worst moments of the pandemic, and the Global Financial Crisis".
The net percentage tightening Credit Standards for Small to Medium sized businesses is at a major high last seen during Covid, the 2008 Financial Crisis and the Dotcom Bubble bursting.
SLIDE 26
Small businesses are busy coping with their biggest problem:
...surging rates.
SLIDE 27
The bottom 50% of the S&P, are in deep trouble as rates have risen.
SLIDE 28
There are serious problems in small cap land, especially in the US. Good luck paying interest without profits
Shown here is a great chart from Soc Gen showing the distribution of stock forward P/E valuations. The white bars highlight the serious problems within the Russell 2000 index.
SLIDE 29
Small Caps have underperformed large cap by more than 10% in 2023 and are testing decade lows.
SLIDE 30
The seriousness of the problem is highlighted here when you consider that as poorly performing as the S&P 500 excluding the Magnificent Seven has been, the small caps are at the bottom of it, the Russell 2000 even lower …. and unlisted companies and the “Mom and Pops” are barely holding-on coming out of Covid and now can’t get funding to survive.
This is a profoundly serious cancer within America which is getting little to no media coverage.
The Media is more interested in AI which will obsolete jobs and the Magnificent Seven who in prior generations would have been broken up as having become Monopolies within their market particular segments. Segments the SEC has failed to categorize properly.
SLIDE 31
So if restrictive credit is slowly choking the life blood out of America how bad could it get and when might it reverse – or even will it?
SLIDE 32
The central issue is really about Term Premiums.
As I highlighted earlier, they have adjusted to reflect the future increasing risk in financing US debt.
These premiums are not coming down though Inflation may take nominal values lower.
I see little recourse but the US to move towards Yield Curve Control as Japan was forced to do. This is not a solution but will serve to only keep financing going – at least temporarily.
SLIDE 33
10Y UST yields have generally traded in the 4.80-5.00% range over the past weeks until the October Labor numbers shook the markets. . The ‘high for longer’ narrative had clearly been adopted by markets, which is visible in the noticeable stable pricing of the SOFR forward curve shown here to bottom at a level above 4% in 2025 .
SLIDE 34
Apart from data and monetary policy, bond markets remain highly impacted by supply/demand dynamics encapsulated in the move up in the Term Premium since the summer. The US debt outlook is in centre of these discussions, after the Treasury’s sizeable upward revision of expected issuance in August. However, recent announcements on issuance have brought some calm to markets.
On October 31st the Treasury lowered its expected issuance for the remainder of the year, while signaling that the cash buffer (TGA) is now sufficiently refilled after being drained in the lead up to the debt ceiling resolution in June. According to the Quarterly Refunding Statement on November 1st, issuance for the remainder of the year will mainly pick up at the belly of curve, while selling in the long-end will decline marginally in December and January. A continued high share of T-Bills in the issuance profile indicates, that the short end will continue to bear a significant share of US deficit burden. Markets had clearly feared a more significant amount of duration to accommodate in the short run.
Barring disastrous Treasury auctions yields should soon settle in a trading range north of 4.3% and below4.8%
SLIDE 35
On the demand side, investors still seems cautious to take on more duration risk in the current situation. Powell mentioned in his recent speech at The Economic Club of New York that the FOMC is looking at the current positive bond/equity correlation as a potential driver of Term Premia. Bonds have become less useful for hedging risk.
Bonds and equities share a common exposure to inflation, and historically the two have correlated positively in decades characterized by elevated price pressures as the 1970s and 1980s shown in this chart.
As economic growth slows and inflationary risks dampen, the positive correlation will likely recede gradually from here.
SLIDE 36
We expect long rates to decline, but less than many expect.
Powell mentioned at the meeting that the FOMC is closely watching the rise in long rates and the implications for financial conditions. To have an impact on monetary policy, the move needs to
- be driven by a higher term premium (which it according to Powell seems to be)
- be persistent.
SLIDE 37
Simply put, a persistently higher Term Premium should be countered by monetary policy, assuming that financial conditions are to remain unchanged. Nothing indicates an intention from the FOMC to achieve additional tightening, and as long as that is the case, the markedly higher Term Premium should eventually increase the probability of monetary policy turning softer in the first half of 2024.
SLIDE 38
Reflecting stronger-than-anticipated private consumption and ongoing lift from fiscal policies, the US GDP forecasts for 2023 are likely closer to 2.4% and 1.1% for 2024.
But as we still expect consumption growth to cool towards winter and as tighter financial conditions gradually weigh on investment activity, the forecast profile still includes a clear slowdown into first half 2024.
SLIDE 39
Expect a downward trending profile for long UST yields over the coming year, though with a higher level expected on a 12M horizon. We have likely ended this cycle up in yields but it will be resumed in second half 2024.
We expect the 10Y UST yield to decline by 70bp to 4.20%, as inflationary pressures soften and Fed initiates its cutting cycle.
SLIDE 40
The upward revision is mainly an effect of a higher Term Premium, which we expect to prove stickier than the pricing of policy rates remaining ‘high forever’.
SLIDE 41
Currently we see bonds holding equities in the 4400 range during the remainder of 2023. Baring a major Geo-Political event or a terrorist domestic attack resulting from the Israel-Gaza Conflict of course!
SLIDE 42
As the Recession becomes more obvious PE ratios will fall towards 14 with yields in the 4.3% range.
These are likely trends but are not to be invested in without further confirmations.
SLIDE 43
What can we conclude?
SLIDE 44
Global Central banks are determined to not let recession take the toll it did in the 1970’s so they will continue to tighten until something breaks and the consolidations we discussed earlier begin to happen.
It is impossible to determine what will break, when and what the powers to be will do in the way of special “facilities”.
SLIDE 45
What is easier to predict is we have entered an era of economic stagnation and stagflation.
Have you got your gold allocation yet?
SLIDE 46
As I always remind you in these videos, remember politicians and Central Banks will print the money to solve any and all problems, until such time as no one will take the money or it is of no value.
That day is still in the future so take advantage of the opportunities as they currently exist.
Investing is always easier when you know with relative certainty how the powers to be will react. Your chances of success go up dramatically.
The powers to be are now effectively trapped by policies of fiat currencies, unsound money, political polarization and global policy paralysis.
SLIDE 47
I would like take a moment as a reminder
DO NO NOT TRADE FROM ANY OF THESE SLIDES - they are for educational and discussions purposes ONLY.
As negative as these comments often are, there has seldom been a better time for investing. However, it requires careful analysis and not following what have traditionally been the true and tried approaches.
Do your reading and make sure you have a knowledgeable and well informed financial advisor.
So until we talk again, may 2023 turn out to be an outstanding investment year for you and your family?
I sincerely thank you for listening!

