
IN-DEPTH: TRANSCRIPTION - LONGWave - NOVEMBER 2019 - THE SHORT SQUEEZE CYCLE
COVER
Thank you for joining me. I'm Gord Long.

A REMINDER BEFORE WE BEGIN: DO NO NOT TRADE FROM ANY OF THESE SLIDES - they are COMMENTARY for educational and discussions purposes ONLY.
Always consult a professional financial advisor before making any investment decisions.

AGENDA
In last Month’s LONGWave video I discussed our expectations for a Corrective Consolidation before heading higher. Well we have headed higher and appear to have broken some important overhead resistance.
The question is whether this is a "False Breakout" or the beginnings of a sustained rally?
To answer the question I would like to cover those items listed here.

SLIDE 5
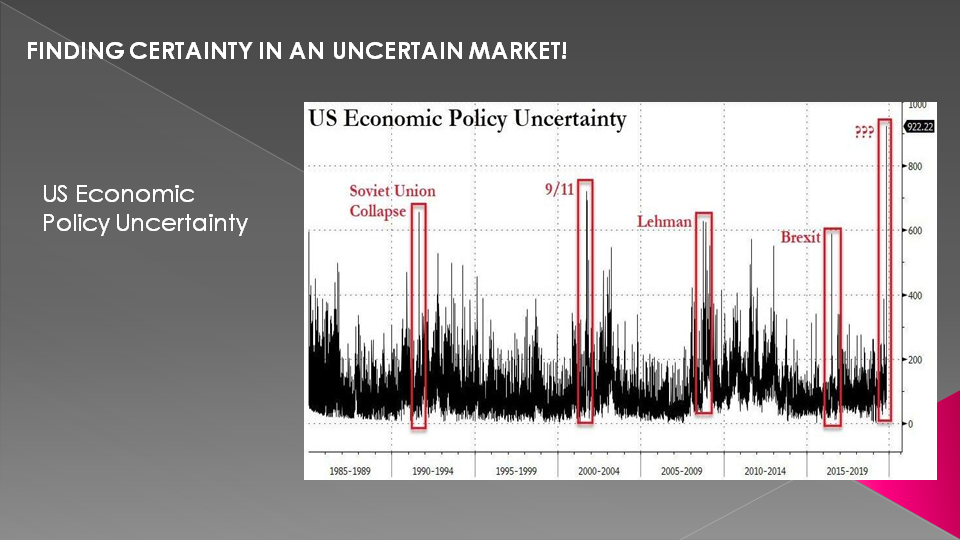
By numerous measures Economic Policy Uncertainty is at extremes. Both in the US as shown here .....
SLIDE 6
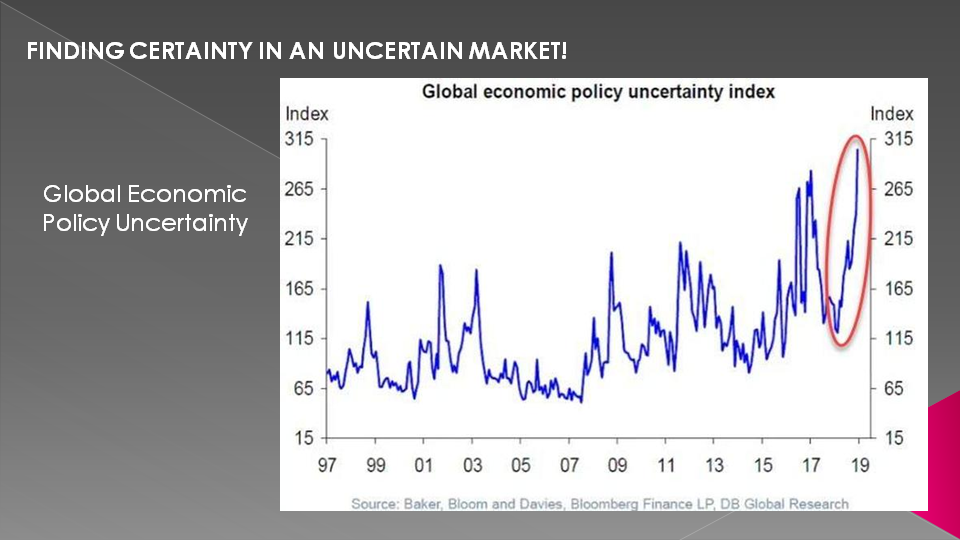
.. and Globally as shown here. Markets hate uncertainty and this normally gives rise to a "Risk Off" investment shift.
SLIDE 7
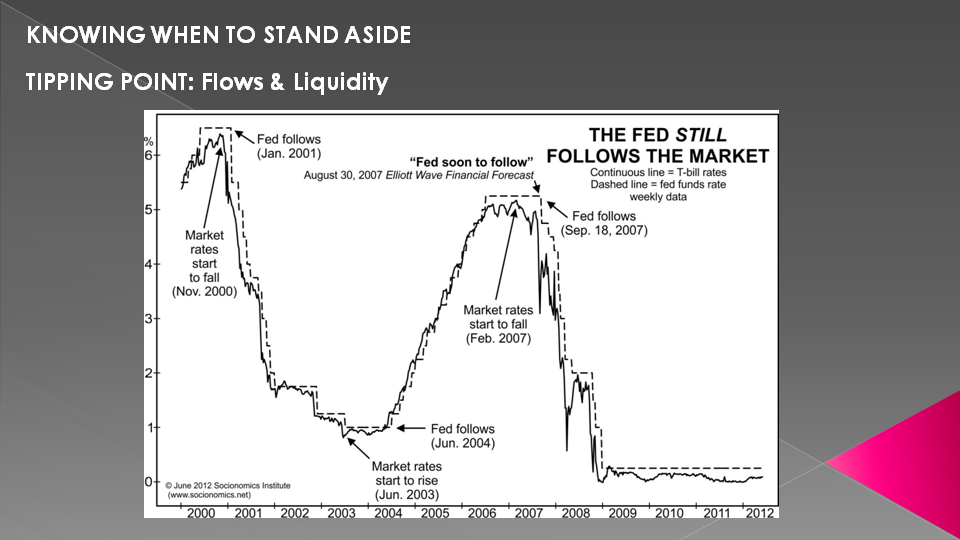
But the markets are reacting to different drivers now-a-days. There can be little doubt in anyone's mind who have been following our LONGWave videos that the prime market driver, for a few years now, has been central bank liquidity injections. I need to be specific in highlighting it is not about what they say about liquidity, but rather what is actually happening whether they announce it or not!
Additionally, since money has no longer has borders we must always talk about Global Liquidity. That is the combined actions of the global central banks.

SLIDE 8
If we paid attention to what the central banks announce, we would likely have lost money. We have witnessed a pretty clear pattern of "Sell on the News" when it comes to the Federal Reserve.

SLIDE 9
One reason for that anomaly is that the central banks actually follow the market. They don't lead it! To be blunt, the central banks are the "hand maidens" to the major global banks and the "hidden hand" of the cumulative effect of all central banks. Basically, Ben Bernanke's "Enrich-thy-Neighbor" doctrine.
SLIDE 10
So what should we be watching to make sense of the markets?
Well if you can get real-time data (like the bankers do) then you need to see the actual timing of Global Liquidity flows and react accordingly.

SLIDE 11
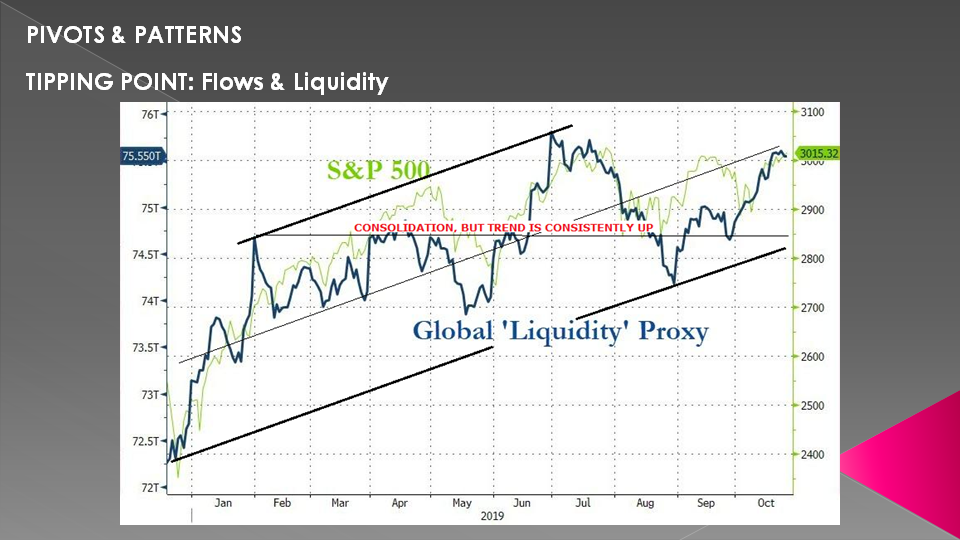
What makes this particularly interesting is how that detailed real time data is being traded. It also tells you something in regards to answering the question we initially posed. Are we breaking to new highs or is this a false breakout?
Lets assume we had access to the data the bankers do. They would have had the info shown here before others did.
Bear with me as we strip this chart apart for a moment.
We see that we have a clear, continuous upward trend growth in global liquidity in 2019, shown in black.
We also see that contrary to the trend, in actual fact liquidity has been more or less flat as the consolidation notation illustrates.
SLIDE 12
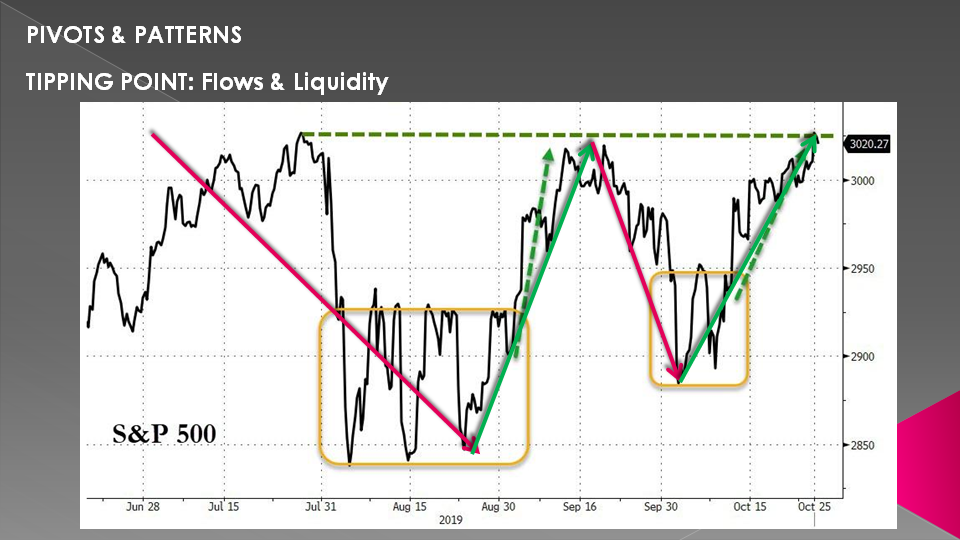
The only significant deviations in this consolidation period were from late June until late August (shown by the red arrow) and the rise since then (shown via two green arrows).

SLIDE 13
If we examined the S&P 500 action during this same period we see, as we would suspect, the same pattern.
SLIDE 14
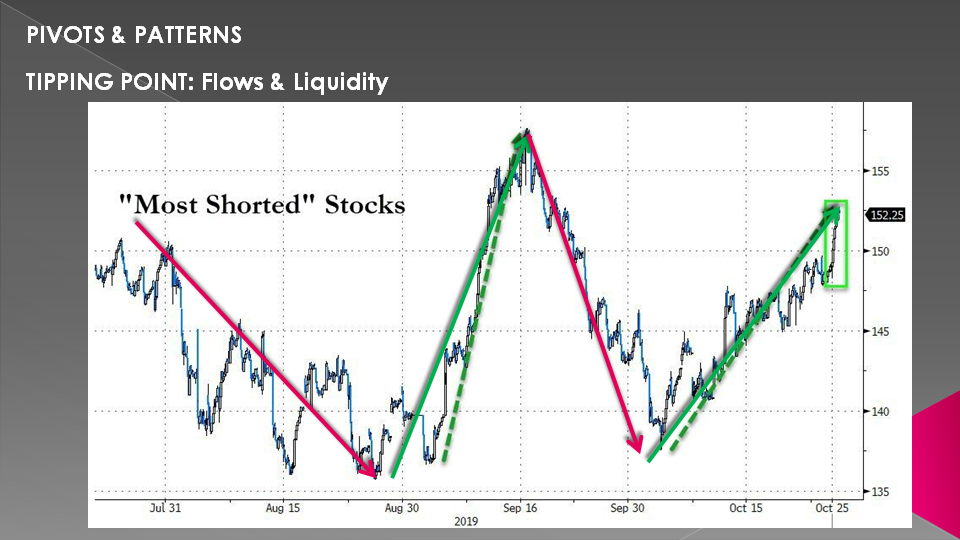
But here is where it gets interesting and quite telling.
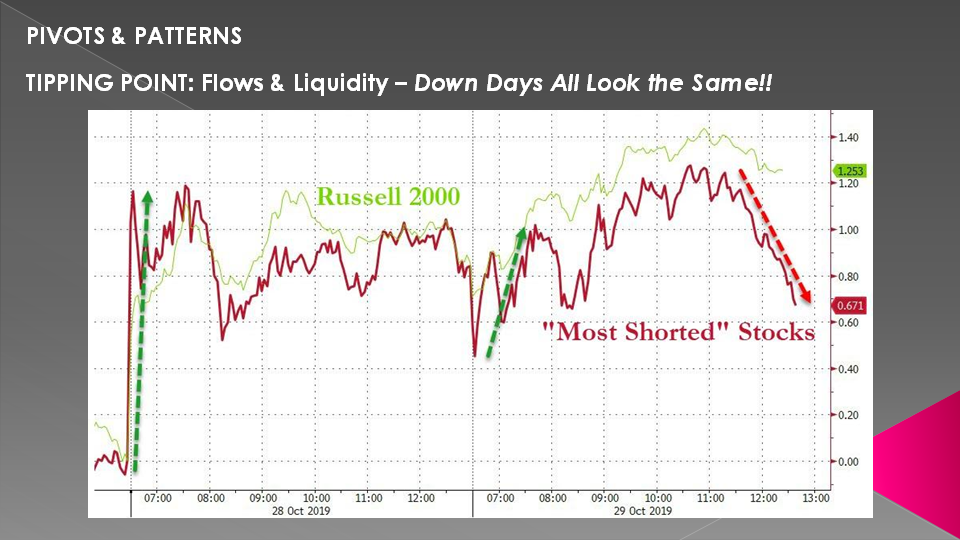
What we see is that liquidity injections when they actually occur are specifically targeted at the "Most Shorted Stocks" and any slowing of the rate immediately sees a reversal of this pattern. Maybe that doesn't sound surprising but the degree to which this is occurring is.
As a consequence the overall market breadth are terrible yet the market keeps "levitated" with upward surges continue holding the overall markets up and cumulatively lifting it.
Shorts keep getting punished with new buyers nowhere to be found other than when short holders are being squeezed and forced to cover effectively pumping new money (in the form of occurred losses) into the market.
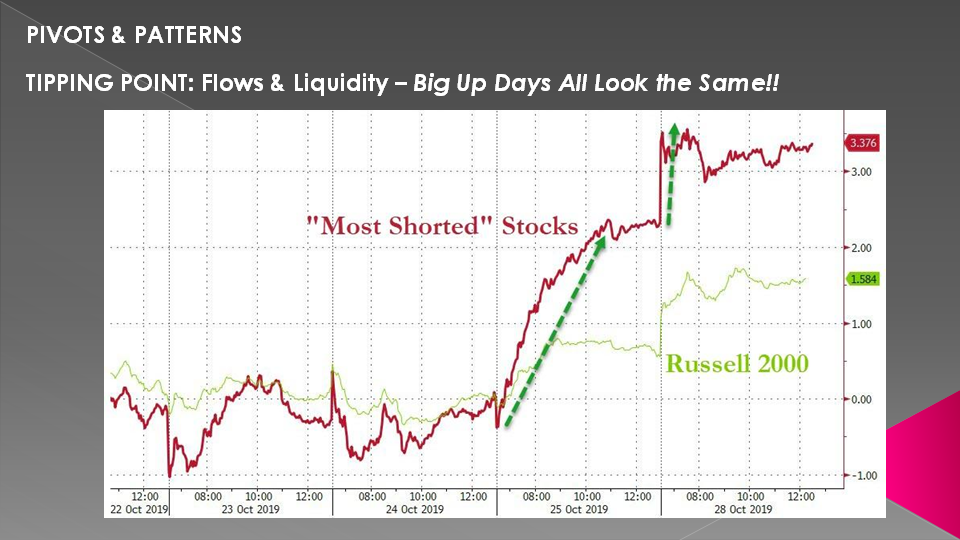
SLIDE 15
The Big Up days all look the same!
SLIDE 16
.. and the down days all look the same.
SLIDE 17
Today it is not about policy uncertainty or macro developments. It is about liquidity and how that liquidity is being managed. It is being managed in such as fashion as to take markets higher and punish severely any counter view to that trend. Shorts are being being beat to the ground!
This game however can only go on for so long. Then the central banks have to accelerate liquidity injections (above and away from the consolidation range we showed previously) to turn fear into greed and force money managers to apply "risk on" for fear of not matching or beating the market index.
As a consequence Passive Market ETF funds have been the winners.... so far. The "know nothing investors" are beating active managers hands down.
Heaven help us when things ever get bad and these passive ETF holders hit the sell key. There won't be enough liquidity in the system to handle the surge. Orders will go unfilled as "Lock Limit Down" halts market fulfillment.

SLIDE 18
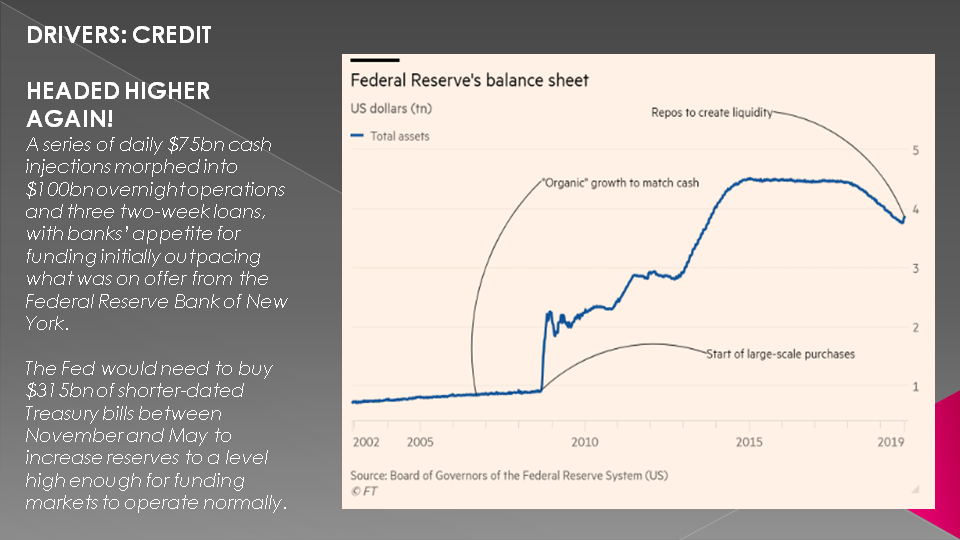
The recent Repo market chaos has heralded in another upward surge in Fed liquidity injections.
Since July the Fed has cut rates 3 times, since September they have increased their balance sheet by $261B, they have added repo, expanded it to $120B per day in October, they’ve launched a $60B treasury bill buy program all desperately designed to inject artificial liquidity into the system and to suppress rates.
This is the most interventionist Fed since Ben Bernanke.

SLIDE 19
And this is all it took to break markets to new highs.
It is now perceived that the Fed will need to buy $315bn of shorter-dated Treasury bills between November and May to increase reserves to a level high enough for funding markets to operate normally
SLIDE 20
But what exactly is better since last year? Growth? Earnings? None of the above.
It remains a game of multiple expansion.
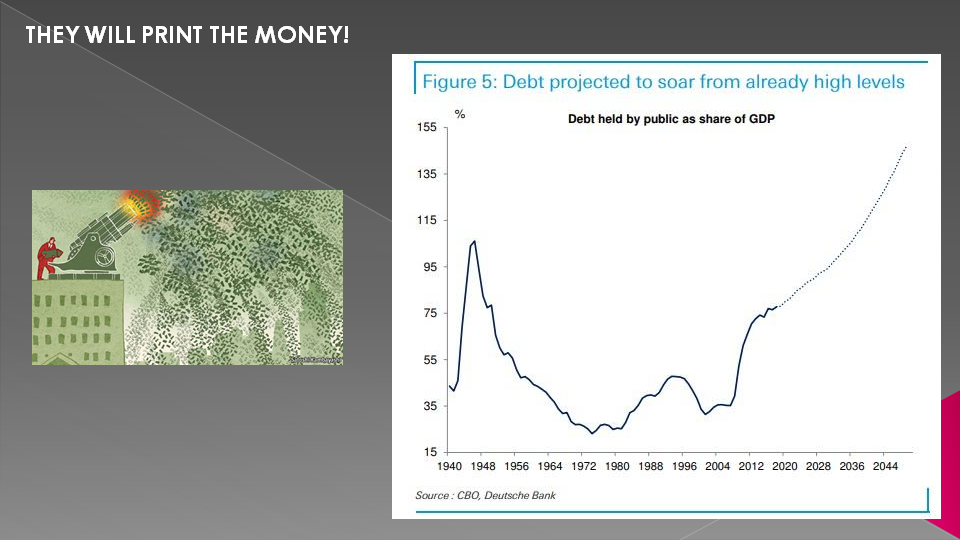
And what do we have now? $23 trillion in US debt, trillion dollar deficits, 0.8%-1.1% Q4 GDP growth and a stock market valuation at 145% GDP.
... and debt projected to explode higher --- which must be financed somehow.
SLIDE 21
The Fed it’s claiming it’s not QE, but markets keep acting like it.
Central bank interventions beyond the initial emergency interventions never inspired organic growth, only debt enabled growth and in process all they did is blow an asset bubble, and now that growth is slowing their only solution is aiming to further inflate the asset bubble and risk is that they will succeed as clearly that’s the plan here.

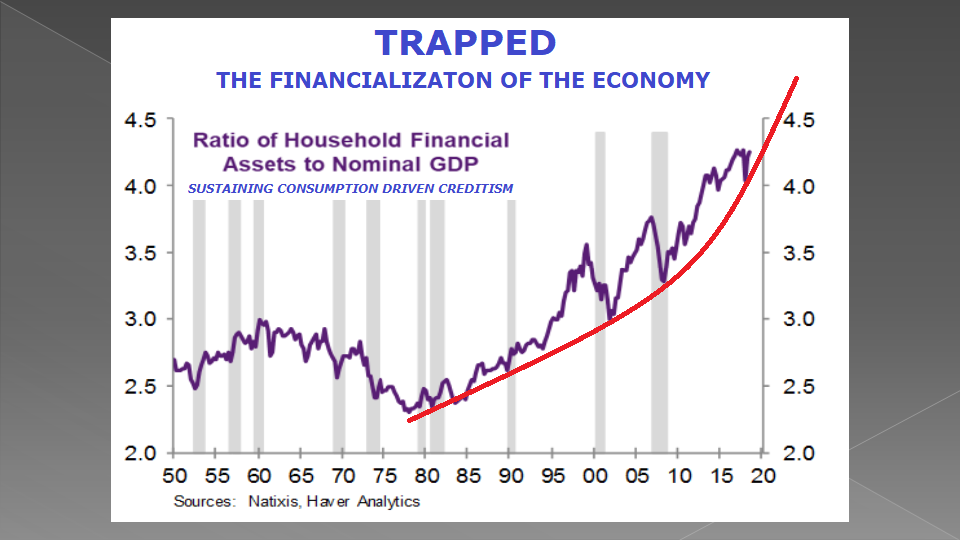
SLIDE 22
Clearly the Federal Reserve is now trapped and must rapidly increase liquidity to minimally sustain the new reality of consumption creditism.
SLIDE 23
As further observation, away from the Fed, we are seeing a set of unique global indicators being put in which are rare signals that are usually only seen at the start of a bull market. This flies in the face of the current conventional wisdom that the global economy is heading into recession!
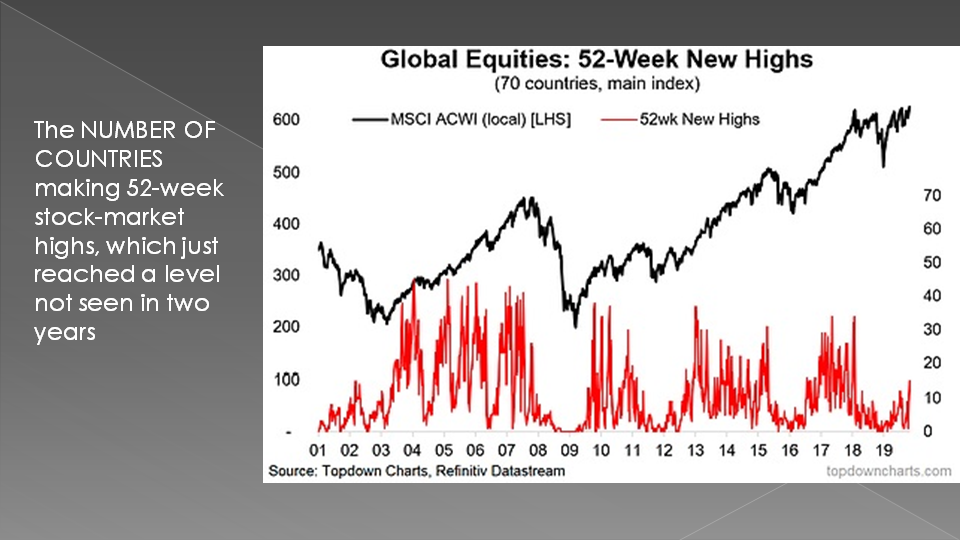
Let’s look at this chart of the actual number of countries making 52-week stock-market highs, which just reached a level not seen in two years.
This is a classic bull market commencement signal. We saw this at the start of the last 3 cyclical bull markets (2009-11, 2012-15, 2016-18).
Ideally we want to see more countries making new 52-week highs [and] basically for the strength to spread across markets and to maintain.
SLIDE 24
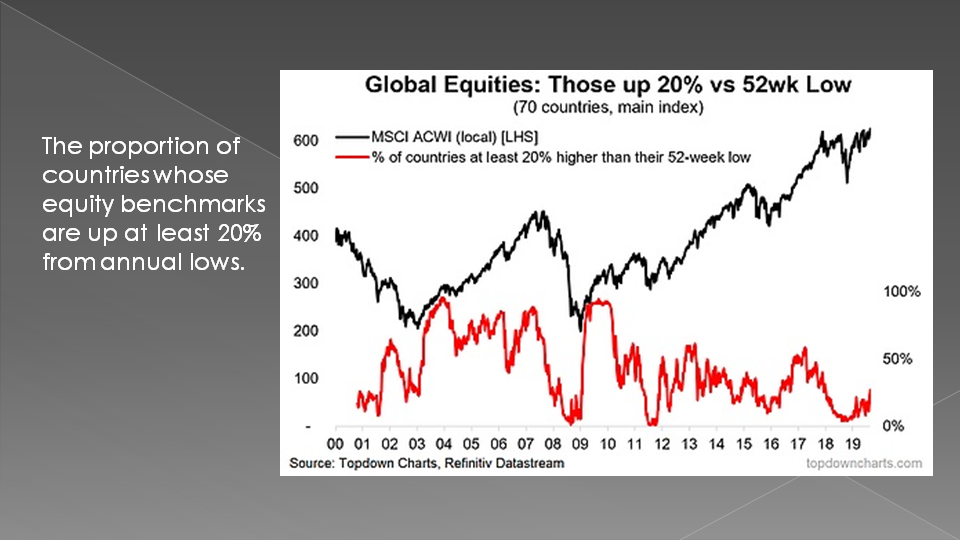
Next, we see an unusual indicator tracking the proportion of countries whose equity benchmarks are up at least 20% from annual lows.
Why would this be interesting?” Very simply. It is a crude approximation of the number of countries in a bull market, where 20% is the (albeit somewhat arbitrary) rule of thumb for whether a stock index is in a bull market.”
With this indicator you basically want to see it collapse, and then turn up (like now) to signal a major market bottom and subsequent bull market in global equities.
This chart signaled a bullish global equity call in 2016, the last time the central banks initiated a sustained globally coordinated liquidity injection.
SLIDE 25
Thirdly we see the proportion of countries whose main equity benchmarks are positive on a year-on-year basis.
It’s very much a similar picture to the other two charts, but this one is even more interesting given how at its worst point back in January it was only matched by the financial crisis and the Eurozone debt crisis.
What’s also interesting is how it has crossed up through that key threshold — basically sounding loud and clear a signal that a new bull market is underway.
It’s not just these three breadth indicators that are delivering the “clear and classic picture of a new cyclical bull market, but that there’s more than the technical case for buying into equities.
Global equities are looking like a bargain, and, relative to bonds, the equity risk premium is attractive.
Institutional positioning remains fairly light — a contrarian bullish signal.
Perhaps most important of all the global monetary-policy pivot is clear, material, and reinforces a core view that we see a rebound/re-acceleration in the global economy heading into 2020 (call it a late-cycle extension).

SLIDE 26
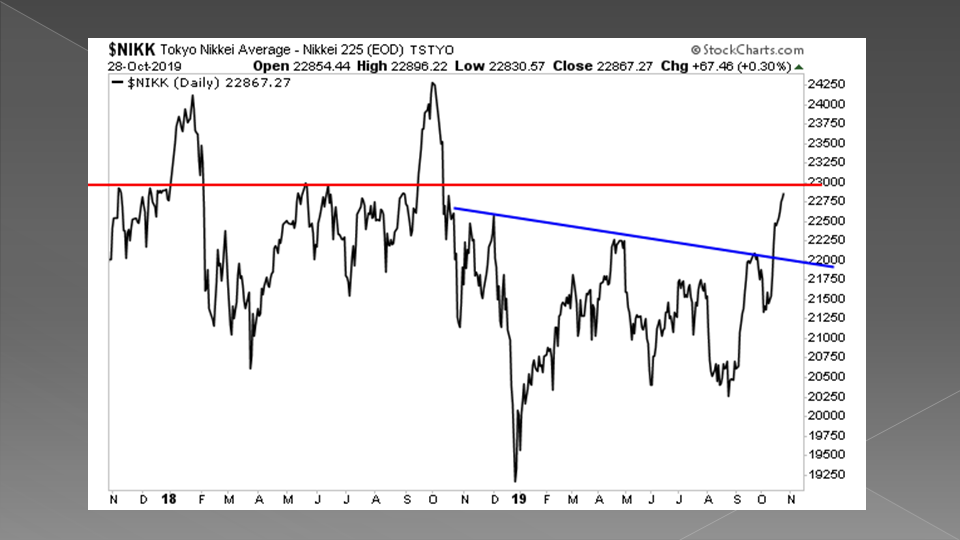
A Global TSUNAMI of liquidity is hitting the markets right now. And it’s likely to ignite an explosive move higher. Across the globe markets are signalling that a major bull run is about to begin.
Japan’s Nikkei is about to attempt a similar move, breaking through its downtrend (blue line) and attempting a test of overhead resistance (red line). However, in this case stocks remain well below the all-time high of the 1980s.
SLIDE 27
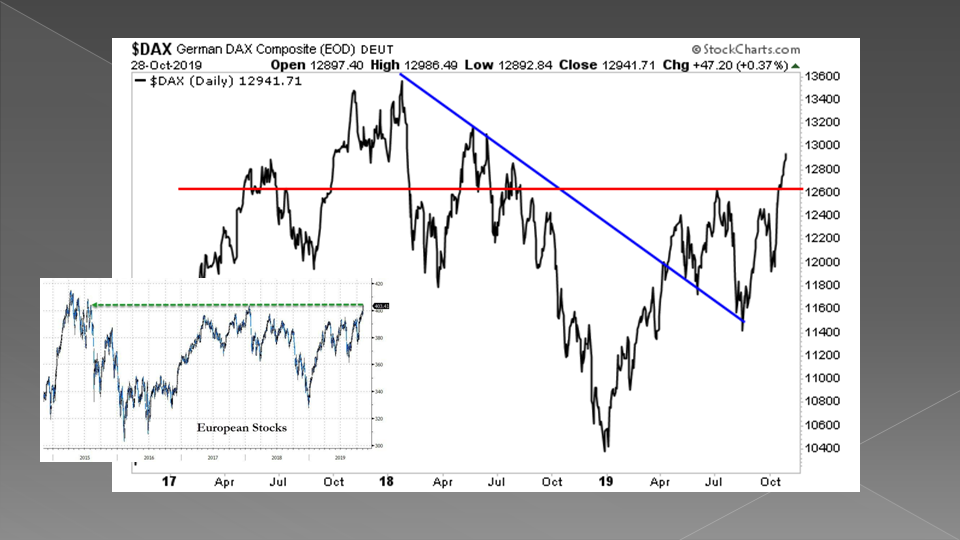
The German DAX has ended its downtrend (blue line) and broken resistance (red line). New all-time highs are a stone’s throw away.
SLIDE 28
Brazil’s Bovespa has erupted higher to new all time highs.

SLIDE 29
The S&P 500 broke out of our consolidation period since our last LONGWave video. When we did this chart in late October we drew this Elliott Wave suggesting a target between 3060 and 3090 was likely.

SLIDE 30
In fact we broke the 3060 Fibonacci Extension and put in an intraday high of 3085.

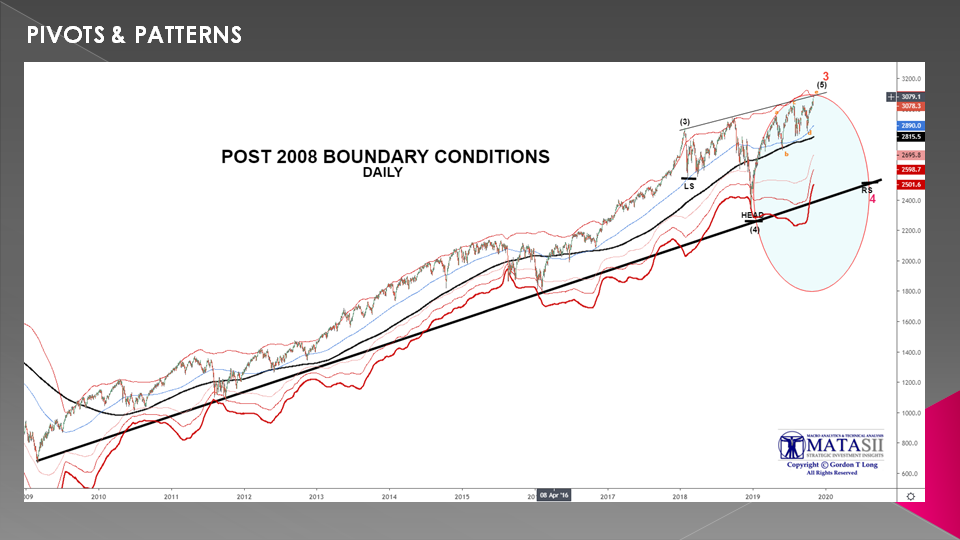
SLIDE 31
However, what we need to stress after all this positive bias news is we are sill within our controlling ellipse still calling for the corrective part of the consolidation to still occur. We are also at the upper controlling boundary condition established during the Financial Crisis. Caution is needed. Further confirmations are needed before rushing in.
SLIDE 32
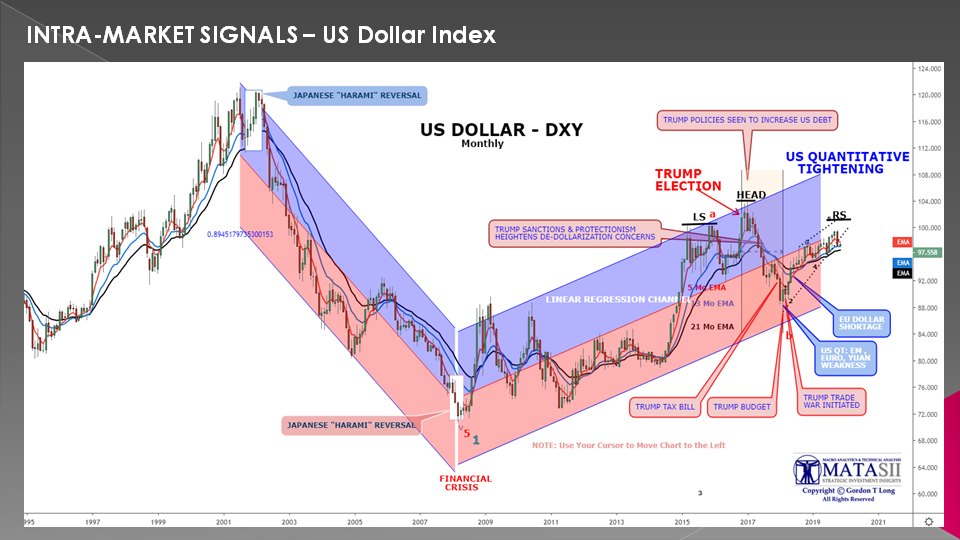
The dollar has been particularly weak during this period which means it takes more dollars to buy the same amount of stock thereby putting upward pressures on dollar denominated stock indexes like the S&P 500.
SLIDE 33
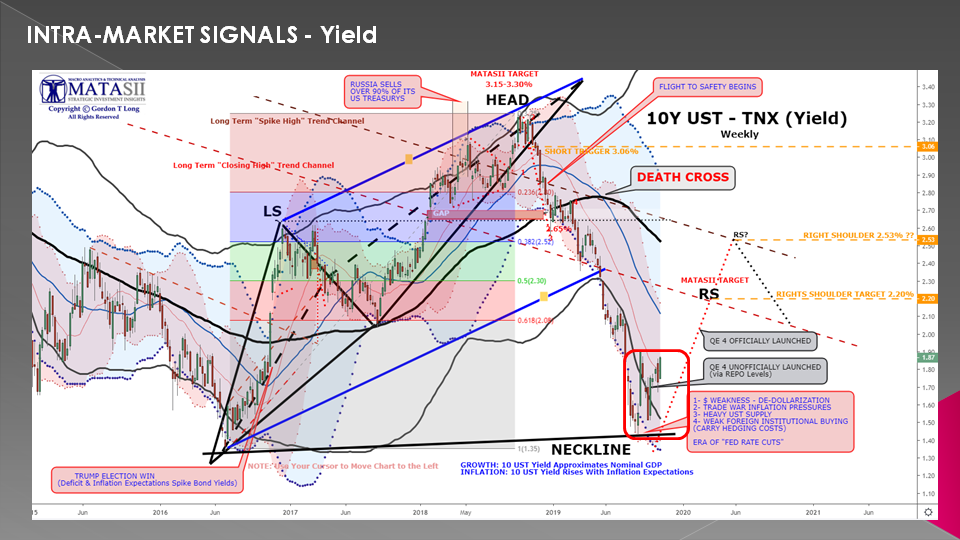
Additionally, the benchmark 10Y UST Note has been rising in terms of yield. This is seen to be placing further forced pressure on the Fed to reduce rates and increase their balance sheets. This pressure is seen as positive for stock prices.
SLIDE 34
But maybe more importantly is the silent signal that JP Morgan made in the midst of the Repo Chaos.
The biggest US bank has been quietly rotating out of cash, and also busy re-positioning its balance sheet in a major way.
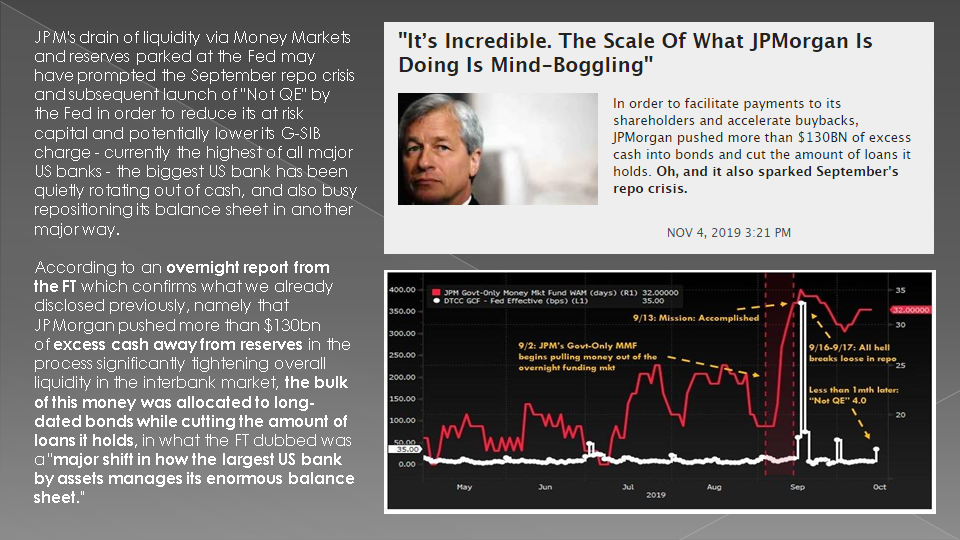
JPM's drain of liquidity via Money Markets and reserves parked at the Fed may have actually prompted the September repo crisis and subsequent launch of "Not QE" by the Fed in order to reduce its at risk capital and potentially lower its G-SIB charge - currently the highest of all major US banks .
According to an overnight report from the FT that JPMorgan pushed more than $130bn of excess cash away from reserves in the process significantly tightening overall liquidity in the inter-bank market, the bulk of this money was allocated to long-dated bonds while cutting the amount of loans it holds, in what the FT dubbed was a "major shift in how the largest US bank by assets manages its enormous balance sheet."
Jamie Dimon may have effectively forced the Fed into QE4 and at the same time as positioning JPM in long dated bonds that will rise in price as the Fed is forced to implement QE4. He is taking full advantage of this expected right shoulder counter rally we just showed to fully position JP Morgan.
As I said earlier - the Fed always follows! JPM is exerting tremendous controlling influence that will produce significant bond profits over the next 18 months. Old timers would surmise the JPM is putting the final touches on their preparations for a recession.
SLIDE 35
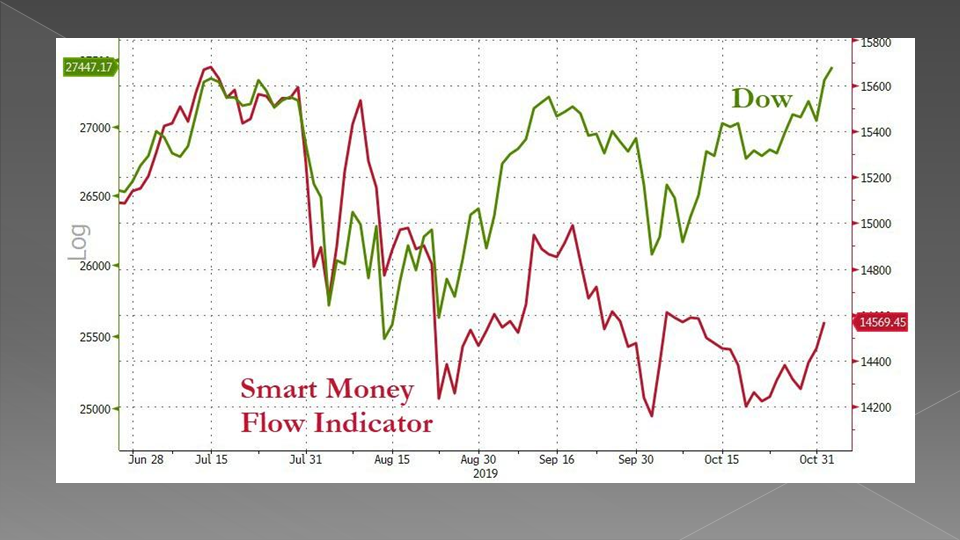
Based on the above I find myself still skeptical this is the beginning of another major leg up until we see the completion of the corrective consolidation. We are going higher but maybe not quit yet.
Smart Money seems to agree with me...
SLIDE 36
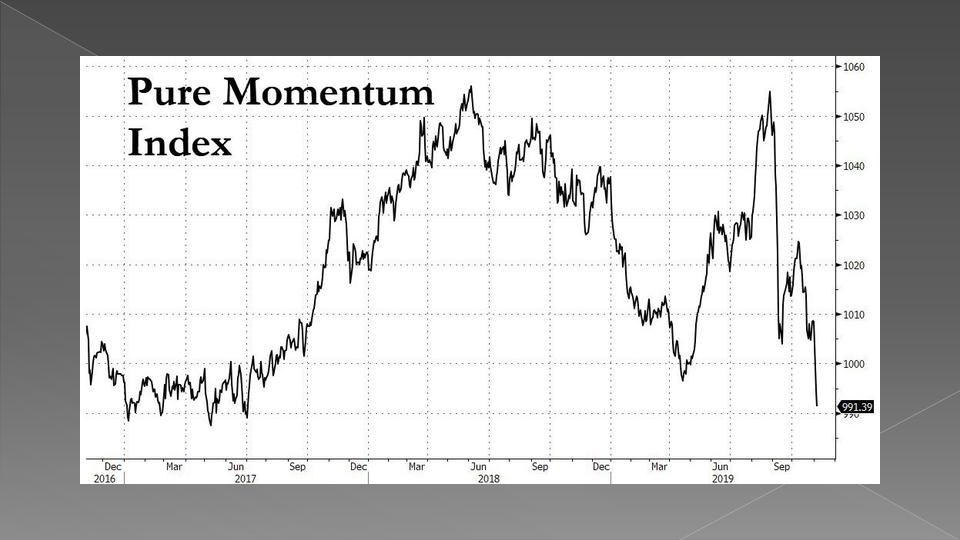
Market Momentum bears this out....
SLIDE 37
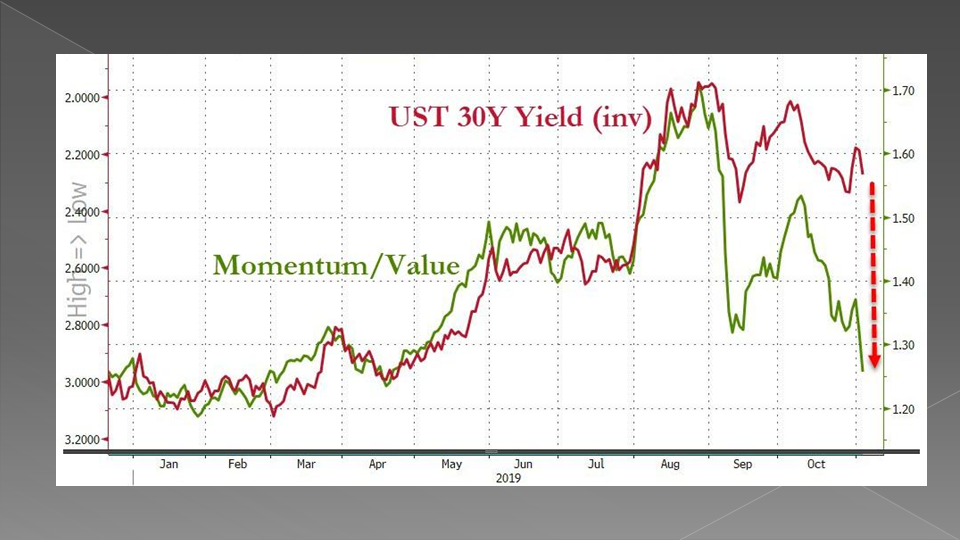
.. and the shift away from momentum to value also says fund managers are with me on this.
SLIDE 38
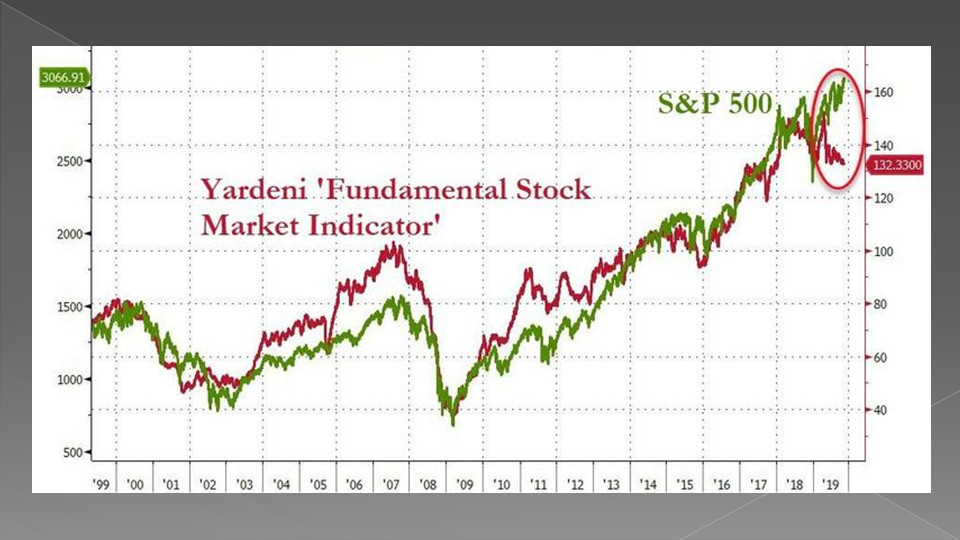
As well at Ed Yardeni's well followed "Fundamental Stock Market Indicator".
SLIDE 39
Of course we never know with precision how far "Greed" will take us along with the "Fear" of missing out. The historical chances however suggest we are closer to me being right than not.
Next month's LONGWave may prove me right or facing a "mea copa"!
Either way you have my position until we have further proof.

SLIDE 40
As I always remind you in these videos, remember politicians and Central Banks will print the money to solve any and all problems, until such time as no one will take the money or it is of no value.
That day is still in the future so take advantage of the opportunities as they currently exist.
Investing is always easier when you know with relative certainty how the powers to be will react. Your chances of success go up dramatically.
The powers to be are now effectively trapped by policies of unsound money and fiat currencies.

SLIDE 40
I would like take a moment as a reminder: DO NO NOT TRADE FROM ANY OF THESE SLIDES - they are for educational and discussions purposes ONLY.
Thank you for listening and until next month may 2019 be an outstanding investment year for you and your family.