IN-DEPTH: TRANSCRIPTION - LONGWave - OCTOBER 2019 - THE COMING CORRECTIVE CONSOLIDATION
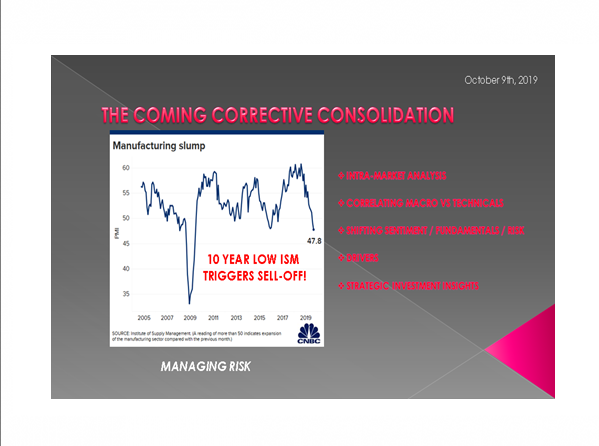
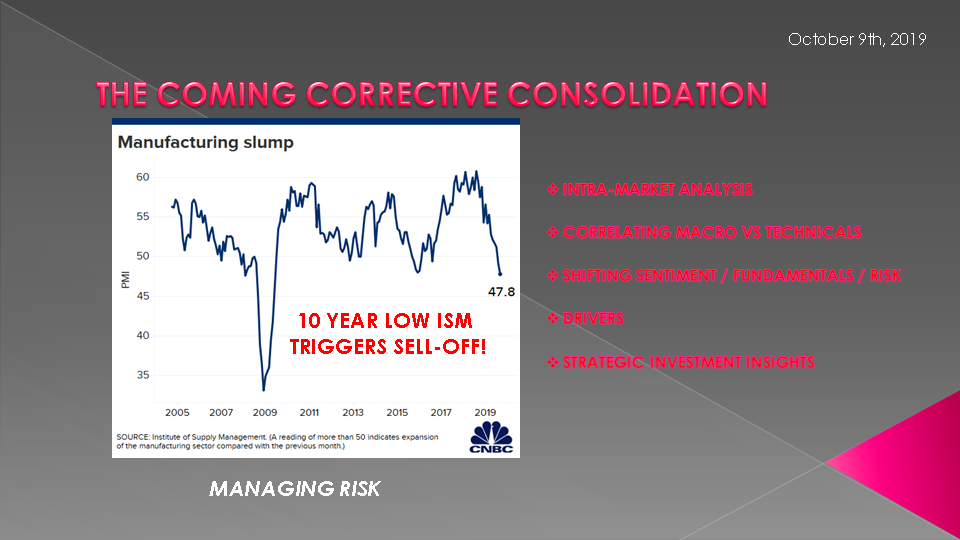
SLIDE 5 -- COVER
Thank you for joining me. I'm Gord Long.
A REMINDER BEFORE WE BEGIN: DO NO NOT TRADE FROM ANY OF THESE SLIDES - they are COMMENTARY for educational and discussions purposes ONLY.
Always consult a professional financial advisor before making any investment decisions.
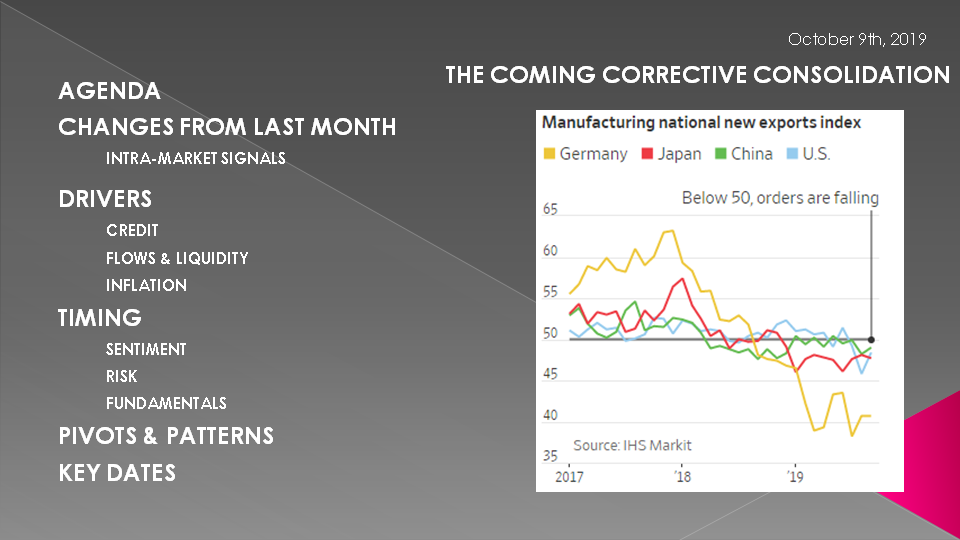
SLIDE 6 -- AGENDA
In this Month’s LONGWave video, as I did last month, I would like to discuss what we are seeing in our MATASII charts to put them into an integrated context
As such I would like to cover those items listed here.
SLIDE 7
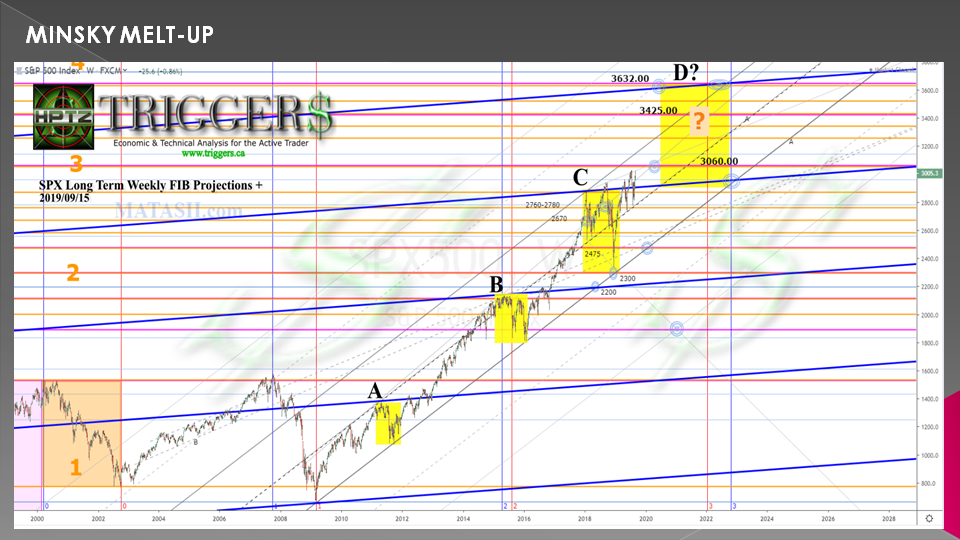
We have shown this slide in previous videos indicating that we are at level "C". Though we have already experienced a pull back in the fall of 2018 we are expecting another before we move to Level "D" over the next couple of years.
Level "A" and "B" both experienced double bottoms so another market drop here would not be unexpected.
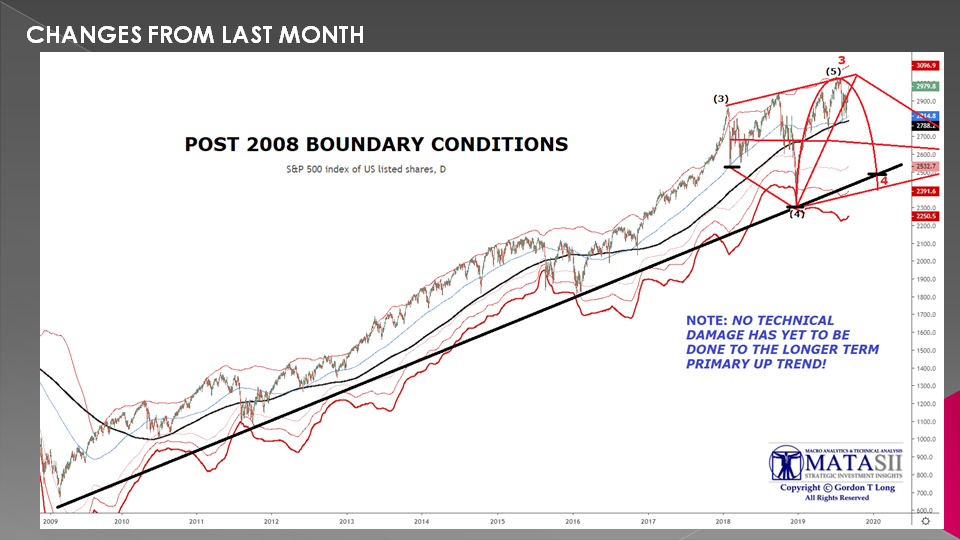
SLIDE 8
Our 2008 Boundary Conditions chart has been mapping this Corrective Consolidation as a typical "Diamond" pattern for a year and a half now. We showed exactly this chart last month with the Ellipse drawn in to better outline our expected "Inverse Head and Shoulders" pattern.
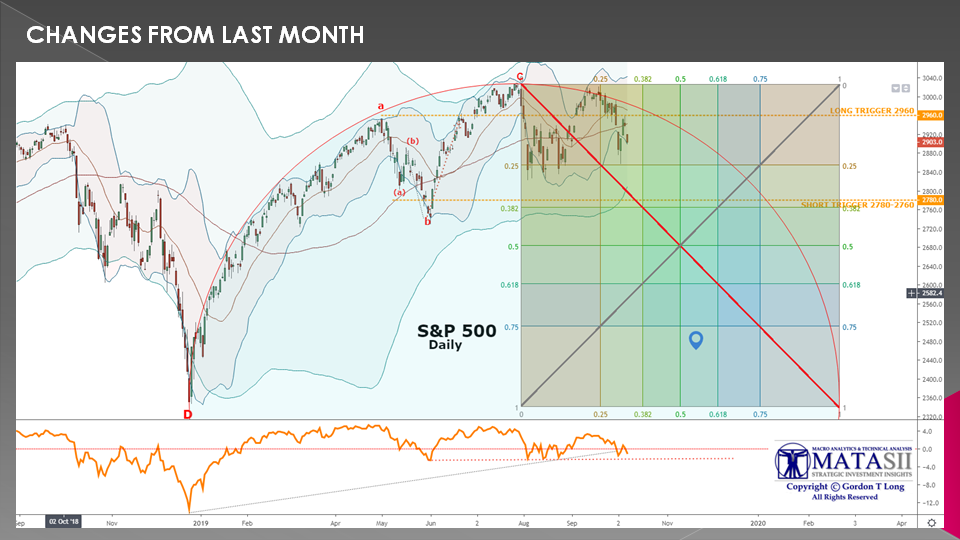
SLIDE 9
We have exploded and updated the ellipse in this chart from the one shown last month. We can see that as expected the Ellipse has contained price movement.
Normally patterns like this follow the ellipse lower but do not "hug the line". Often price movement will target the "X" shown here before counter rallying back to the circumference of the ellipse.
Our proprietary MATA Momentum indicator at the bottom confirms that this is a high probability move.
SLIDE 10
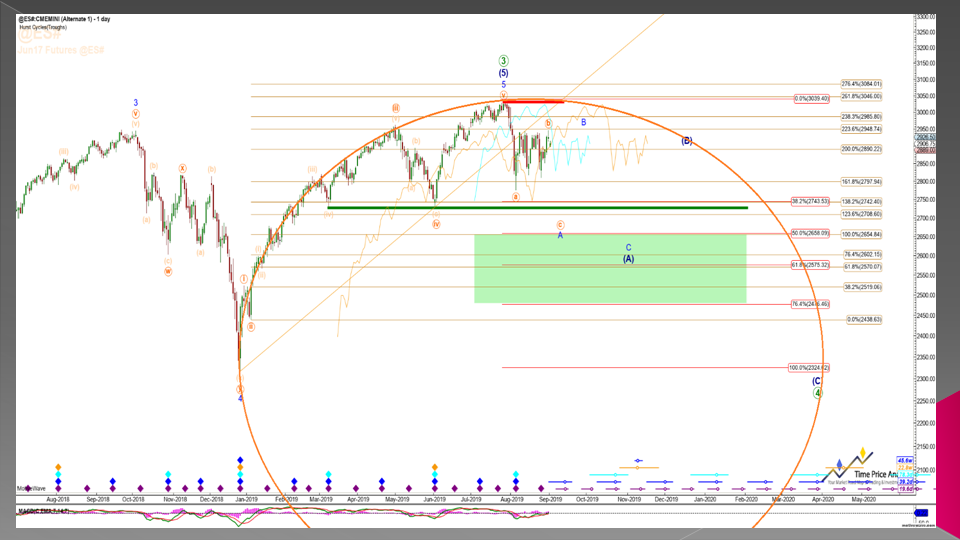
A couple of months ago we showed how our Elliott Wave count also supports this pattern.
Though everything is pointing towards this result we need to be extremely cognizant of the fact that the markets are presently highly controlled and the central banks are quite scared of any potential pull back igniting something more serious.
You can expect announced or unannounced stealth intrusion by the central bankers at anytime.
SLIDE 11
Our Tertiary Chart shows that the pending cross of the 50 DMA below the 100 DMA is something to watch closely and may be a triggering mechanism for both a price movement AND potentially an end run surprise by Fed actions including QE4 or some form of it.
The current chaos in the Repo market suggests this has a reasonable probability of occurring.

SLIDE 12
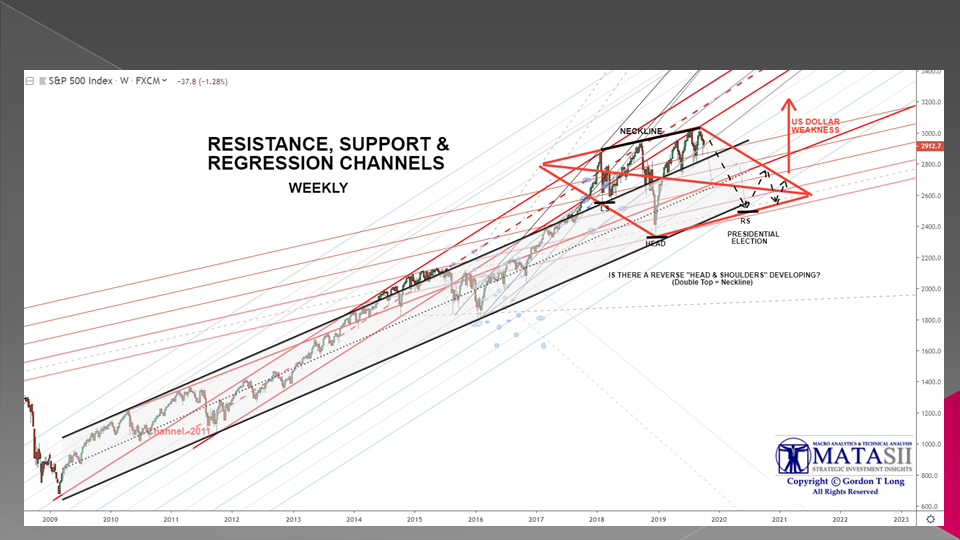
Our long term charts show the Diamond pattern has logical support and trend lines to deliver the expected corrective consolidation pattern leading up to the 2020 US Presidential election. But times are not normal and markets are no longer operating on their own volition.
Another major catalyst in the potential outcome is the US Dollar. Though we label dollar weakness further out, there are mounting pressures for a major dollar devaluation even sooner.
We expect the Dollar to become the media's infatuation in the not too distant future, placing even QE4 as a sub title to dollar concerns.
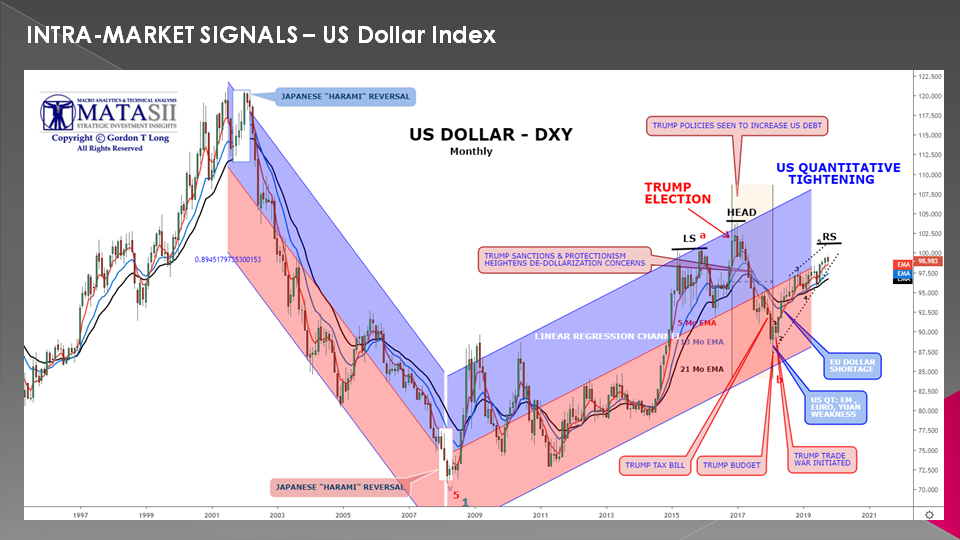
SLIDE 13
Without intervention or a new modern day "Plaza Accord" the US Dollar as shown here and represented by the DXY is in the midst of an "Ending Diagonal" and what we see to be the completion of a "Head & Shoulders" sometime before the US Presidential election in the fall of next year.
SLIDE 14
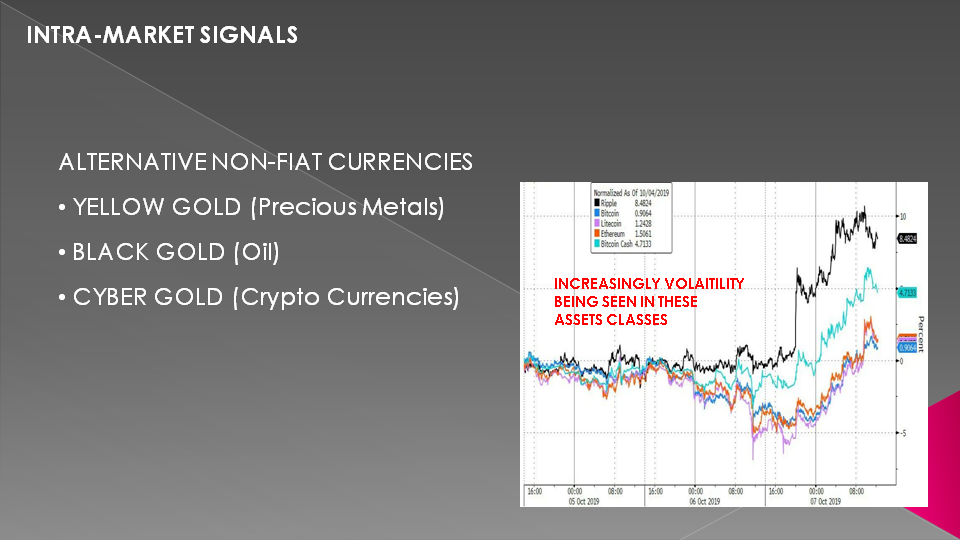
We haven't time in this session to delve deeper but we need to reinforce the point that the US dollar is a Fiat Currency. When Fiat Currencies are debased or threaten to be debased money historically flows to Hard Assets.
We are watching closely these asset areas and our charts are showing important breakout inflation points either being achieved or soon to. Volatility in these assets is usually a precursor of their movements.
We expect to talk further about these Hard Assets or Non Fiat Currency alternative instruments in upcoming videos.
SLIDE 15
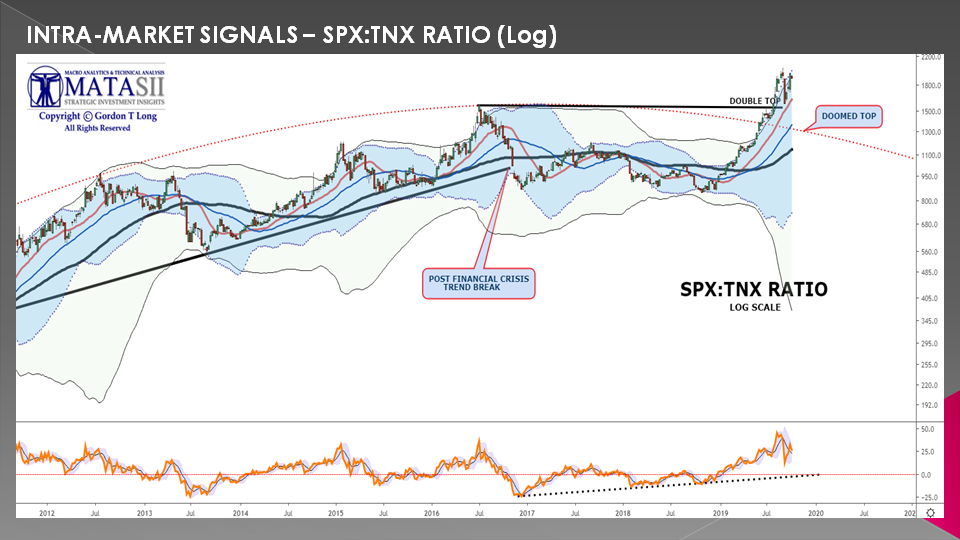
Our cross asset indicators like the log ratio of the SPX versus the 10 Y UST yield suggests that a drop in equities with a rise in US Treasury yields should not be unexpected.... even if it is only a quarter or two correction.
SLIDE 16
The 10 Y UST appears to be potentially putting in a double bottom and is inline with our expectations of a possible Right Shoulder to occur during a corrective counter rally. The degree of separation of the moving average bands suggests this is likely as these bands historically don't deviate to this degree for too long a period of time.

SLIDE 17
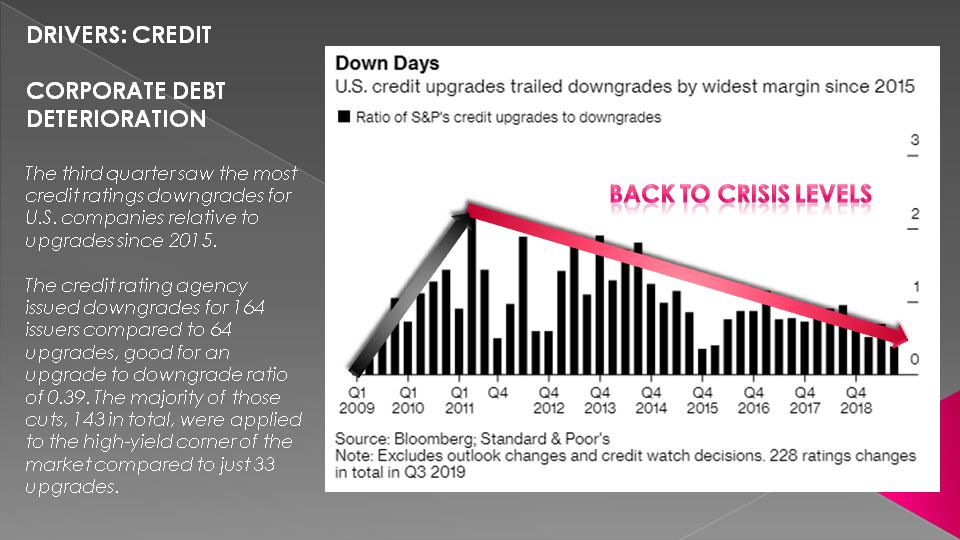
During periods like this we have found it instructive to watch the Credit markets closely as they are normally the catalyst and drivers of sudden market changes.
In this chart we see that the third quarter saw the most credit ratings downgrades for U.S. companies relative to upgrades since 2015.
The credit rating agency issued downgrades for 164 issuers compared to 64 upgrades, good for an upgrade to downgrade ratio of 0.39. The majority of those cuts, 143 in total, were applied to the high-yield corner of the market compared to just 33 upgrades.
SLIDE 18
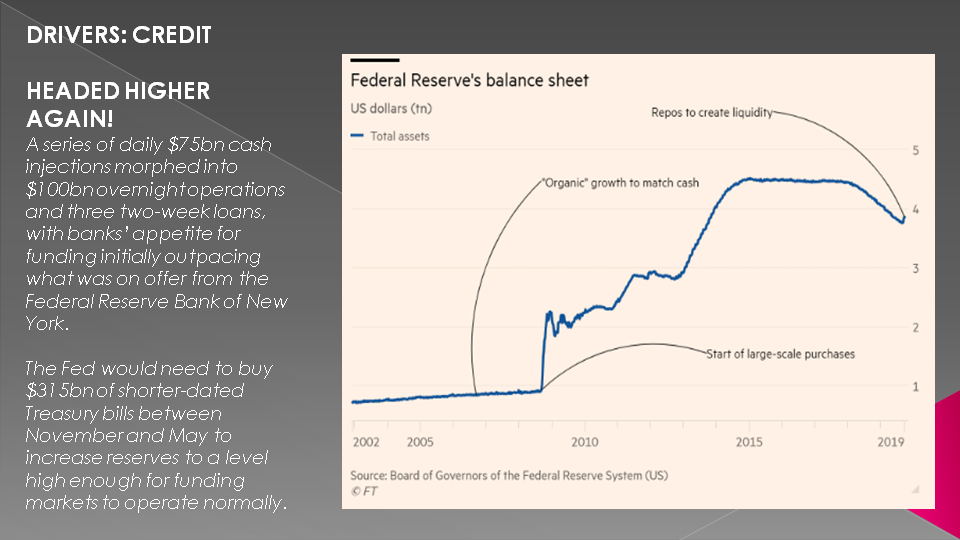
The chaos in the Repo market shows that a series of daily $75bn cash injections morphed into $100bn overnight operations and three two-week loans, with banks’ appetite for funding initially outpacing what was on offer from the Federal Reserve Bank of New York.
The Fed would need to buy $315bn of shorter-dated Treasury bills between November and May to increase reserves to a level high enough for funding markets to operate normally.
SLIDE 19
Some form of QE4 is now on the table in our opinion! It will be significant and the markets will react accordingly.
Primary Dealers like Bank of America Merrill Lynch are already anticipating this.

SLIDE 20
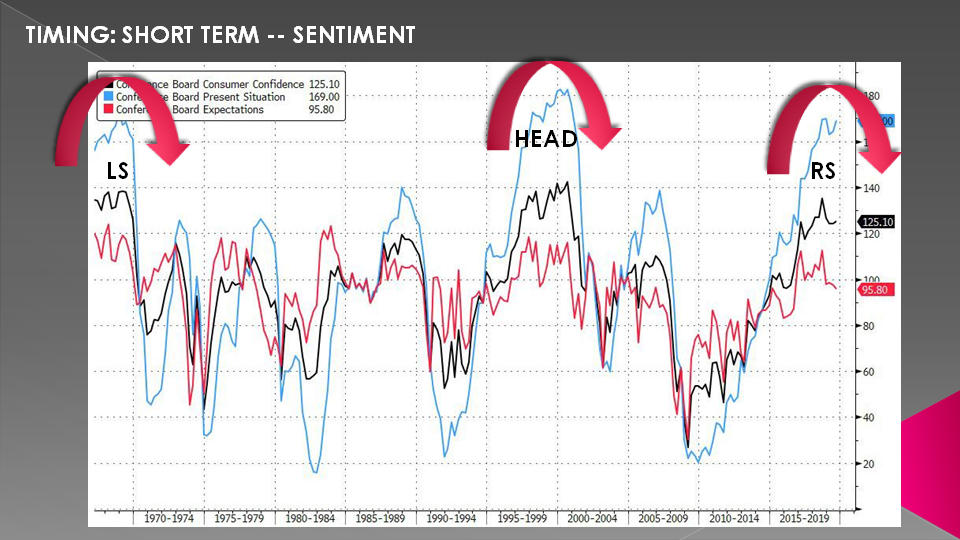
As we often say - In the short term markets are about Sentiment.
Markets peak when optimism peaks, and market and consumer optimism can frequently peak together.
US consumer confidence made major tops in 1988, 2000 and 2007, all periods that were followed by decidedly worse-than-average equity and credit market returns. Today, consumer confidence is high but has started to weaken, a worrying sign that another such peak may be forming.
SLIDE 21
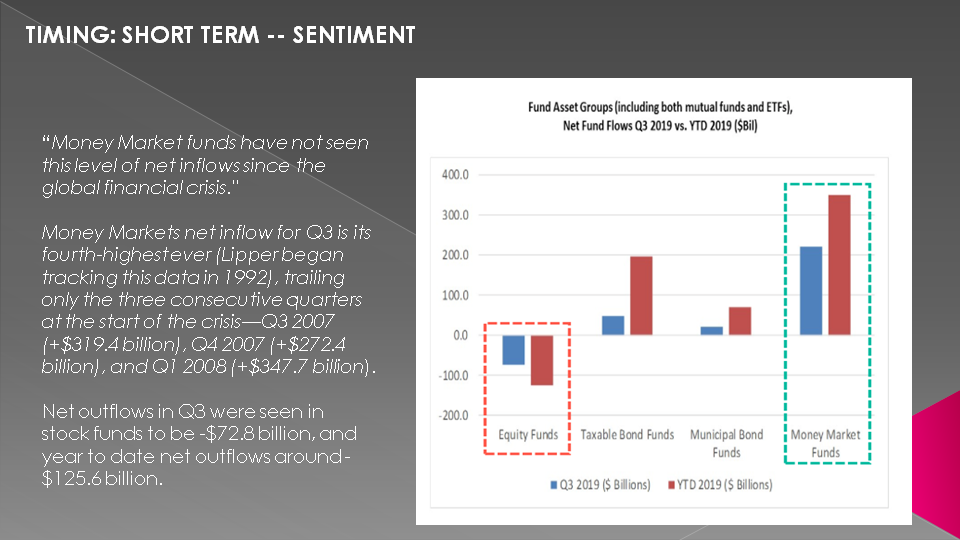
"Money Market funds have not seen this level of net inflows since the global financial crisis."
Money Markets net inflow for Q3 is its fourth-highest ever (Lipper began tracking this data in 1992), trailing only the three consecutive quarters at the start of the crisis—Q3 2007 (+$319.4 billion), Q4 2007 (+$272.4 billion), and Q1 2008 (+$347.7 billion).
Net outflows in Q3 were seen in stock funds to be -$72.8 billion, and year to date net outflows around -$125.6 billion.
SLIDE 22
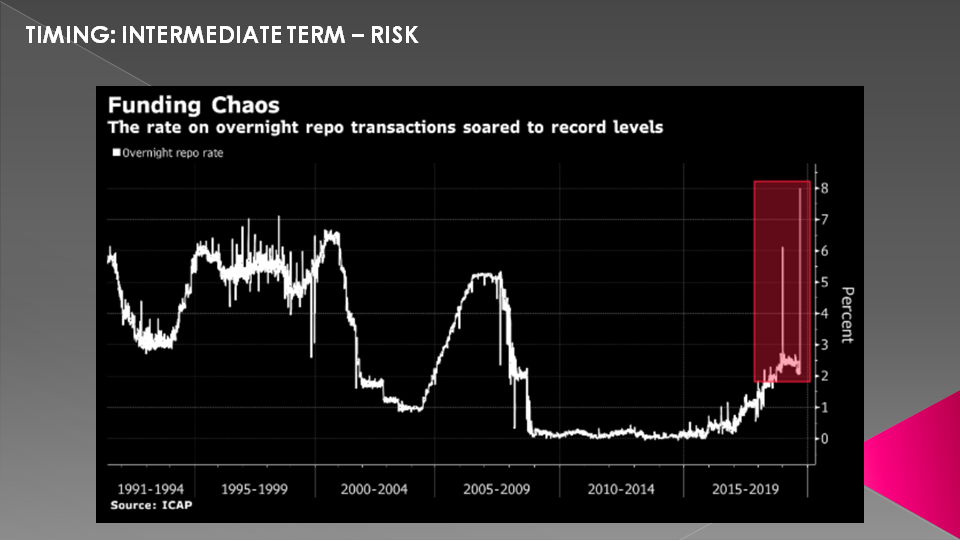
We also believe RISK is the driver in the Intermediate Term.
Here we again come back to the credit market and the Inter Bank Repo market. The recent volatility, over night price spikes and Fed actions are serious! They are signs that there are problems in the banking sector and counterparty risk is prevalent.
There are many reasons for this to be occurring and just as many opinions.
SLIDE 23
Falling bank reserve levels are no doubt contributing to a possible zero bound level of needed inter-bank lending capabilities.
We believe that the troubled Deutsche Bank's ~$50T Derivative book and JP Morgans Synthetic ETF book are not insignificant contributors to the counterparty fears clearly evident in the overnight lending operations.
Time will show whether we are correct.

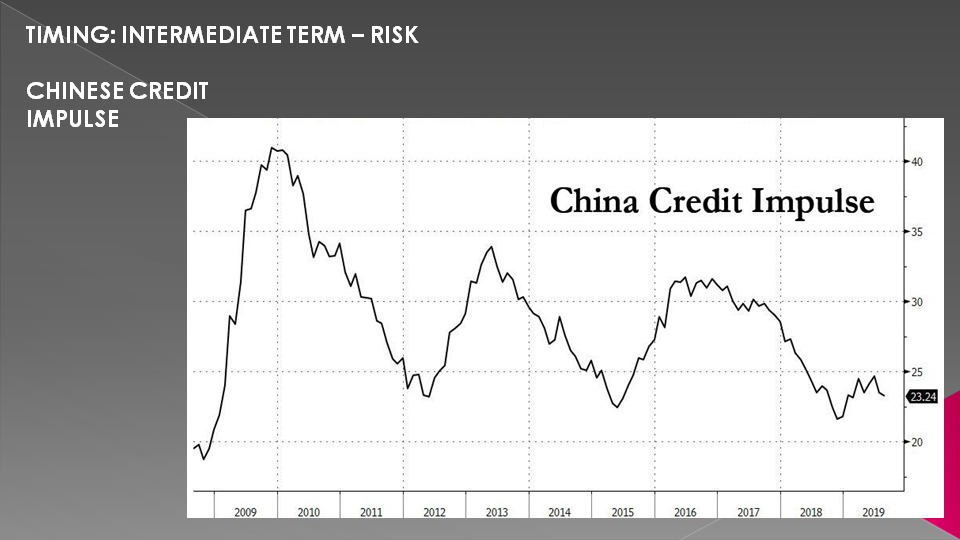
SLIDE 24
Additionally, the continuing drop in the Chinese Credit Impulse is worrying to all.
The real reason for the global economic slowdown has nothing to do with Trump and US trade policy and everything to do with China's untenable debt load and Beijing's resulting inability to boost the credit impulse which on every prior occasions succeeded in pushing the world away from the verge of recession.
Well, maybe not this time.
The fact China is having troubles maintaining growth via capital formation and FDI is not to be left as insignificant to Risk measures in the intermediate term.
SLIDE 25
In the longer term we always say Fundamentals drive markets.
They continue to worsen - both globally and in the US as the most recent manufacturing numbers show and which triggered the recent down days in the market.

SLIDE 26
New export orders are particularly worrying against already falling shipments levels, suggesting more downside risk in the coming months.

SLIDE 27
Earnings expectations for the third quarter, which unofficially kick off next week with reports from major banks like JPMorgan are overall looking grim. Wall Street is expecting a 3% year-over-year decline in S&P 500 earnings per share

SLIDE 28
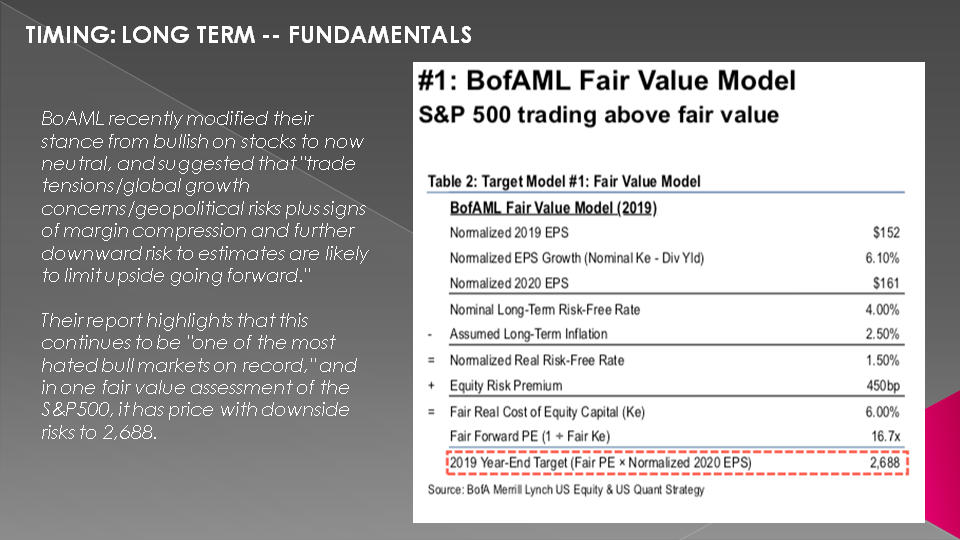
BofA recently modified their stance from bullish on stocks to now neutral, and suggested that "trade tensions/global growth concerns/geopolitical risks plus signs of margin compression and further downward risk to estimates are likely to limit upside going forward."
Their report highlights that this continues to be "one of the most hated bull markets on record," and in one fair value assessment of the S&P500, it has price with downside risks to 2,688.
SLIDE 29
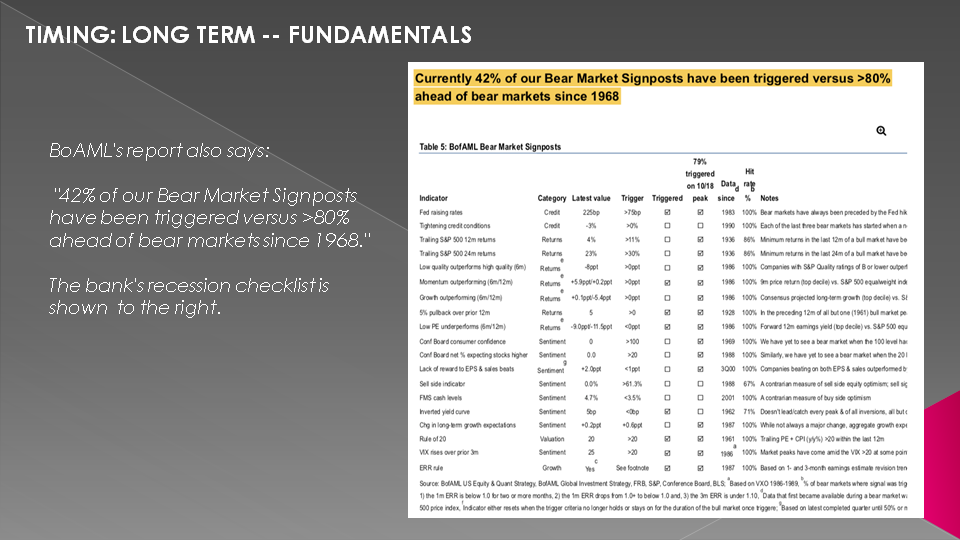
BoAML's report also illustrates that 42% of their Bear Market Signposts have been triggered versus >80% ahead of bear markets since 1968. The bank's recession checklist is shown here.
SLIDE 30
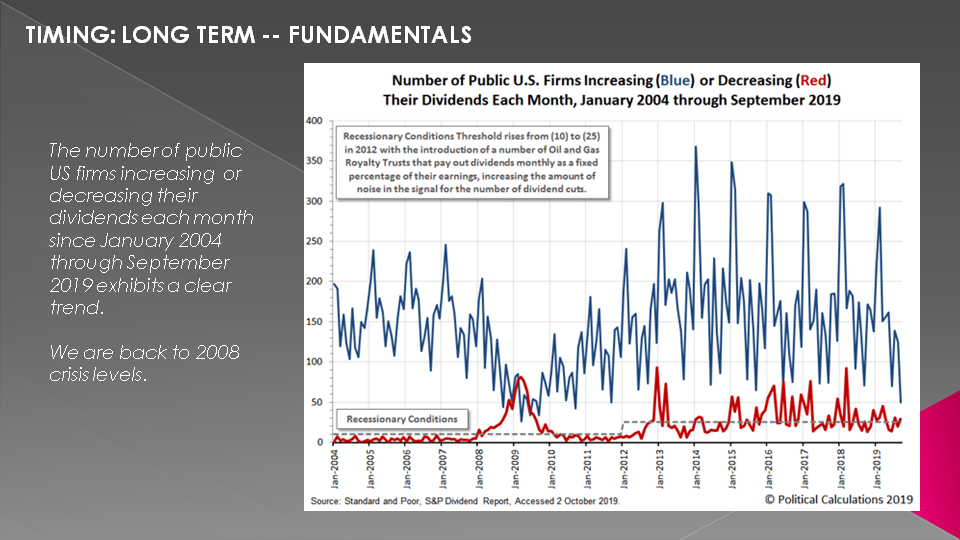
Quite telling to us from a fundamentals perspective is that the number of public US firms increasing or decreasing their dividends each month since January 2004 through September 2019 exhibits a clear trend.
We are back to 2008 crisis levels.
SLIDE 31
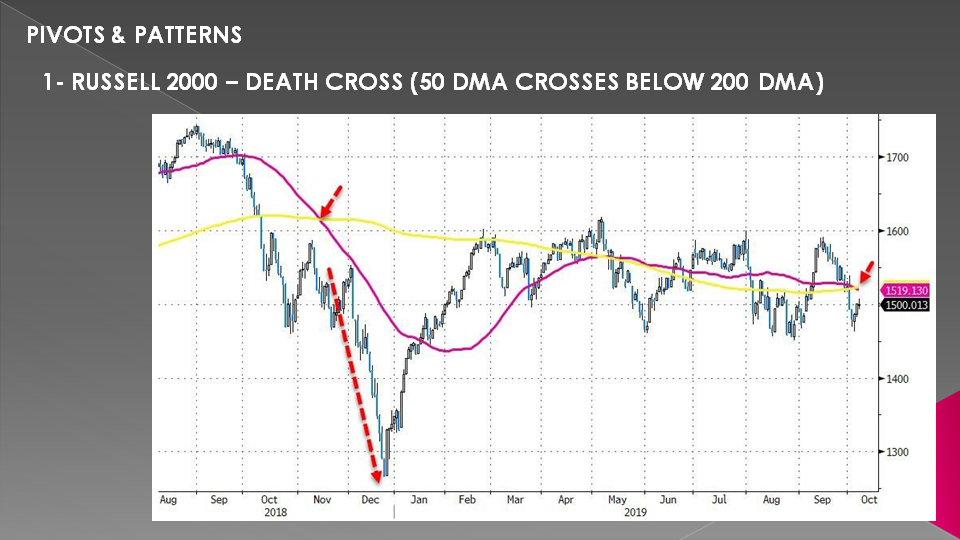
Switching to some pivots and price & time patterns to be aware of we see here that the Russell 2000 is approaching a "Death Cross" where the 50 DMA is about to cross below the 200 DMA.
This is something to carefully watch as I am sure the Plunge Protection Team also has it on their radar screens.
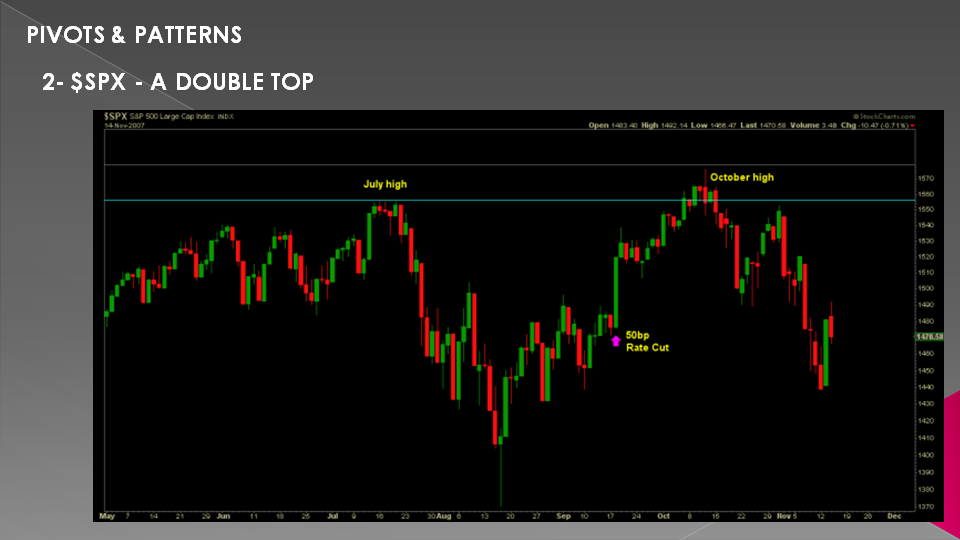
SLIDE 32
All new highs have been sold forming a very clean resistance trend.
- The 2019 uptrend was broken in August.
- In September the break was back tested and failed to recapture the trend.
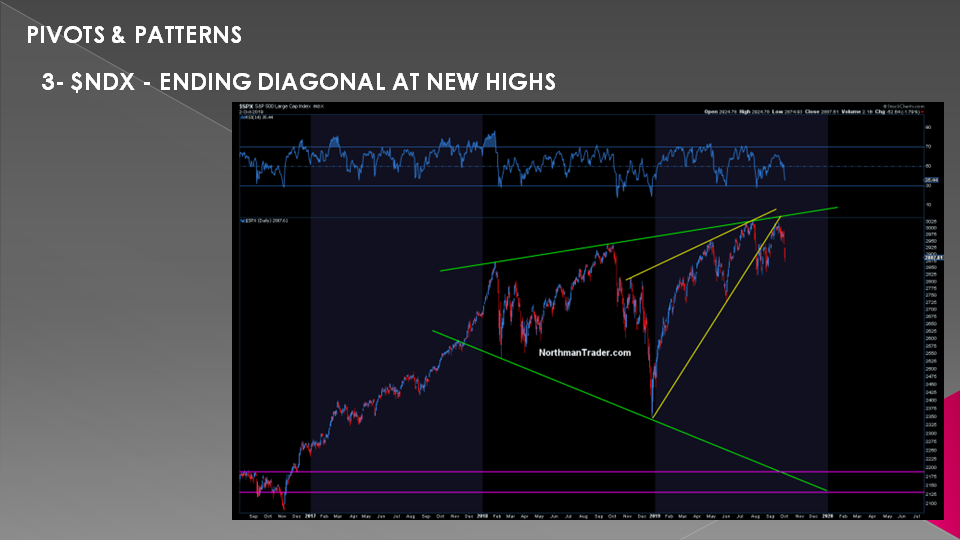
SLIDE 33
- Worse: $SPX made a lower high versus July while volatility has formed another potential bullish pattern that could target the 25-28 area.
- Such a spike may set up for a buyable market dip for a year end rally.
- But no new lows have been made yet either and so markets remain in tradable ranges.
- But note this market continues to fail to make to make sustained new highs, lacks participation and remains at risk of a sizable reversion.
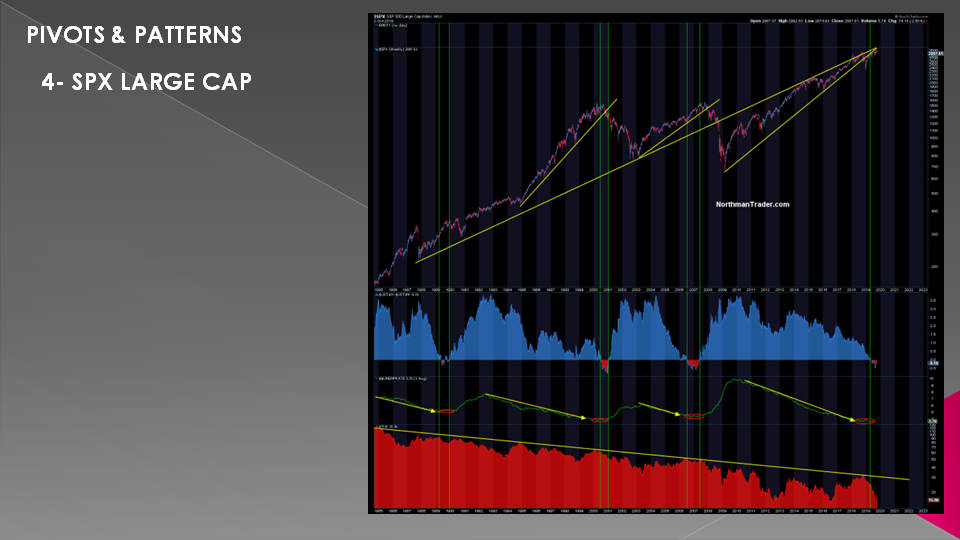
SLIDE 34
- Without a substantive trade deal result that will bring about lasting confidence and will inspire companies to expand capex and business investment recession risk is rising rapidly.
- Get such a trade deal then markets can look toward a substantive rally into Q4. But a potential interim deal may not be enough beyond a temporary sugar high rally.
- The global slowdown is real and risk continues to rise.
SLIDE 35
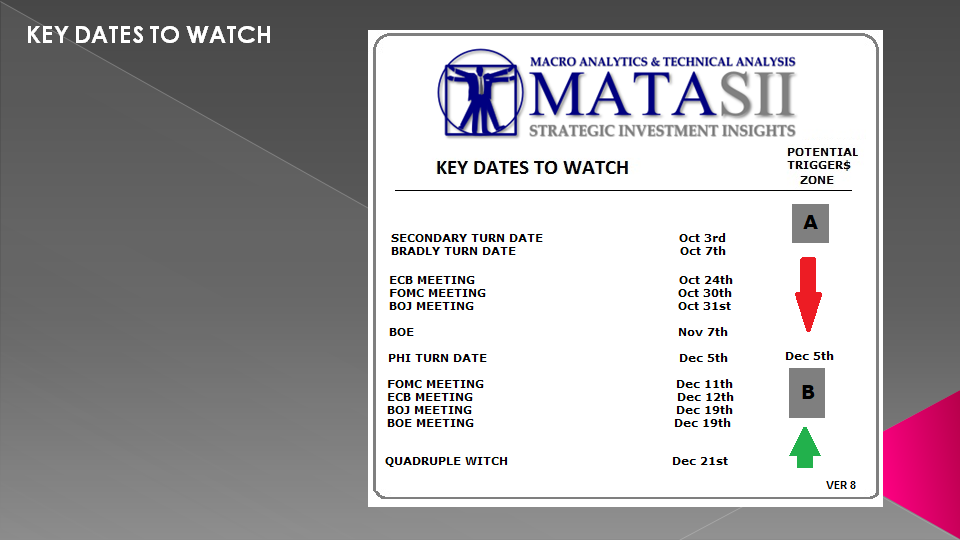
We just passed a technical Bradley Turn Date on October 7th. Here are some of the key dates we are watching between now and year end.
SLIDE 36
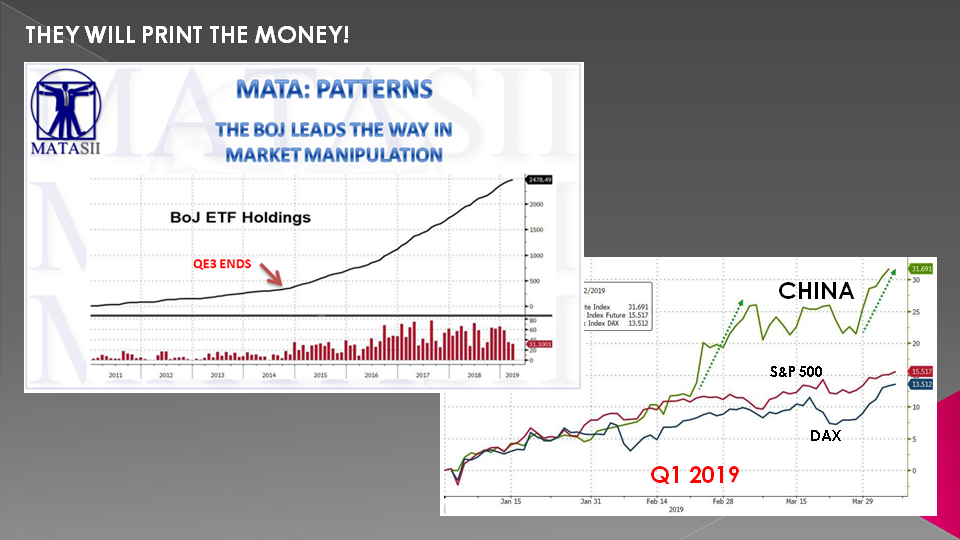
As a reminder, central banks around the world have moved to policies of easy money as they attempt to head off a possible recession.
SLIDE 37
There was a brief debate whether the Fed's soon to be permanent expansion in its balance sheet is QE or not QE. The answer to this semantic debate is simple: Powell defined Quantitative Tightening as removing reserves from the system. Thus, by that simple definition, adding reserves to the system on a permanent basis via permanent open market operations, i.e., bond purchases, is Quantitative Easing. Incidentally, the repo market fireworks were just a smokescreen: the real reason why the Fed is resuming QE is far simpler .....

SLIDE 38
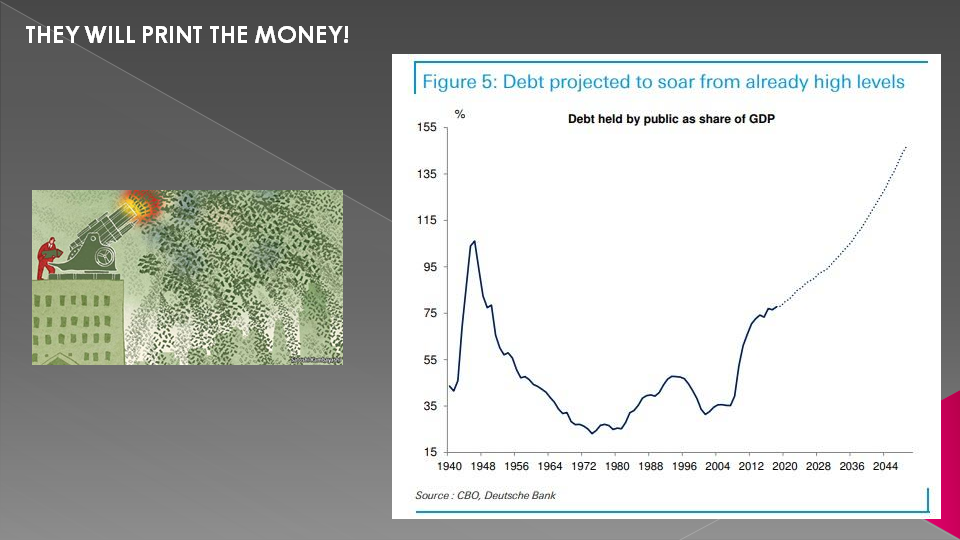
.... the US has facing an avalanche of debt issuance and with China and Japan barely able to keep up, someone has to buy this debt. That someone IS GOING TO BE the Fed.
SLIDE 39
The central banks' central bank, the Bank of International Settlements recently wrote that:
"the unprecedented growth in central banks’ balance sheets since the financial crisis has had a negative impact on the way in which financial markets function.“
Ignoring the fact that central bank policies are responsible for such phenomena as Brexit and Trump, as it is the flawed monetary policy of the past decade that made the rich richer beyond their wildest dreams by expanding the biggest asset bubble in history, while destroying the middle class...
So what was this startling epiphany? According to the BIS, while the immediate impact of this massive balance sheet expansion had eased the severe market strains created by the 2008 financial crisis, there had been several negative side-effects. These included a scarcity of bonds available for investors to purchase, squeezed liquidity in some markets, higher levels of bank reserves and fewer market operators actively trading in some areas.
In short: last month's repo crisis is a direct consequence of central banks' own actions.
"Lower trading volumes and price volatility, compressed credit spreads and flatter term structures may reduce the attractiveness of investing and dealing in bond markets,” the BIS said in the Monday report. "Some players may leave the market altogether, resulting in a more concentrated and homogenous set of investors and fewer dealers.“
This "could result in market malfunctioning when large central bank balance sheets are eventually unwound", the BIS warned, adding that “it could make it more difficult for reserves to be redistributed effectively between market participants." Of course, the BIS was clearly joking because even five-year olds know balance sheets will never be unwound.
Additionally, the BIS went on to point out that negative impacts have been more prevalent when central banks hold a larger share of outstanding assets, as the FT reported: major central banks’ holdings of domestic sovereign bonds range from 20% of outstanding paper at the US Fed to over 40% in Japan.
But the BIS said these side-effects had so far only rarely affected financial conditions in such a way as to impede central banks’ monetary policy making, though it added that the full consequences were unlikely to become clear until major central banks started to shrink their balance sheets.
Worse, the BIS noted that regulations demanding liquidity at large banks might discourage the banks from offering to lend out their reserves — a source of same-day liquidity — into overnight markets. This is similar to what the large banks themselves have said in the last month. But the BIS also noted that since the financial crisis, risk management practices might have changed within the banks themselves.
Sadly, the Fed - which is fully aware of all of this - will decide to ignore everything the BIS has warned about, and launch more POMO/QE/"don't call it QE", just ensured that the next financial crisis will likely be the last one.

SLIDE 40
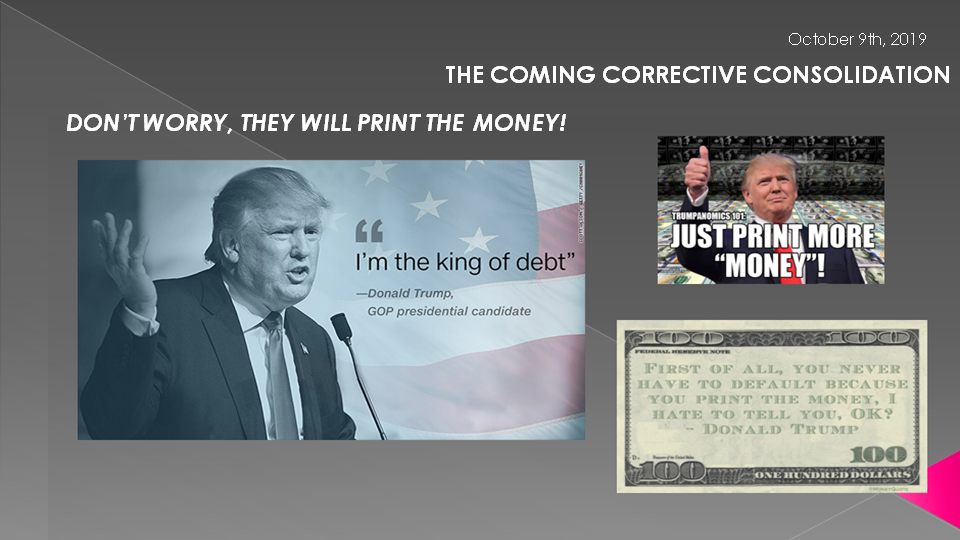
As I always remind you in these videos, remember politicians and Central Banks will print the money to solve any and all problems, until such time as no one will take the money or it is of no value.
That day is still in the future so take advantage of the opportunities as they currently exist.
Investing is always easier when you know with relative certainty how the powers to be will react. Your chances of success go up dramatically.
The powers to be are now effectively trapped by policies of unsound money and fiat currencies.
SLIDE 50
I would like take a moment as a reminder: DO NO NOT TRADE FROM ANY OF THESE SLIDES - they are for educational and discussions purposes ONLY.
Thank you for listening and until next month may 2019 be an outstanding investment year for you and your family.