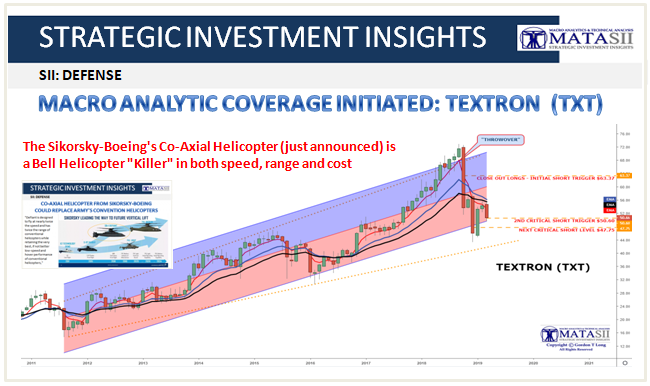
MACRO ANALYTIC COVERAGE INITIATED
TEXTRON (TXT)
A PUBLIC SOURCED ARTICLE FOR MATASII
READERS REFERENCE: (SUBSCRIBERS-SII & PUBLIC ACCESS)
SII - DEFENSE
MATASII SYNTHESIS:
- Revenue are falling at Y-o-Y of -6.7%
- A major contributor to TEXTRON is Bell Helicopter,
- The troubled Osprey& Valor have proven a poor attempt at a hybrid Helicopter - Fast Troop Transporter,
- The aging Vietnam Era Hughie Helicopter (Yankee - Bell UH-1Y) is past its prime.
- The Sikorsky-Boeing's Co-Axial Helicopter (just announced) is a Bell Helicopter "Killer" in both speed, range and cost.
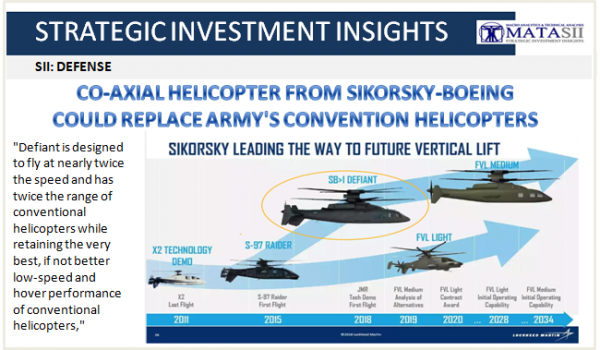
CHART OUTLINE INDEX:
- ORIGINAL IDEA
- PRIMARY INDICATOR - Longer Term: 6 Months - 2 Years
- 12 & 24 Monthly MA Bands
- 5/13/21 Monthly EMA
- SECONDARY INDICATOR - Intermediate Term - 3 Months - 12 Months
- 20/40/80 Weekly - MATA Indicator
- 20/40/80 Weekly MA Bollinger Bands
- TERTIARY INDICATOR - Near Term - Next 1- 3 Months
- 50/100/200 DMA
- 89 DMA w/BB
ORIGINAL IDEA - PUBLISHED JANUARY 12th 2017
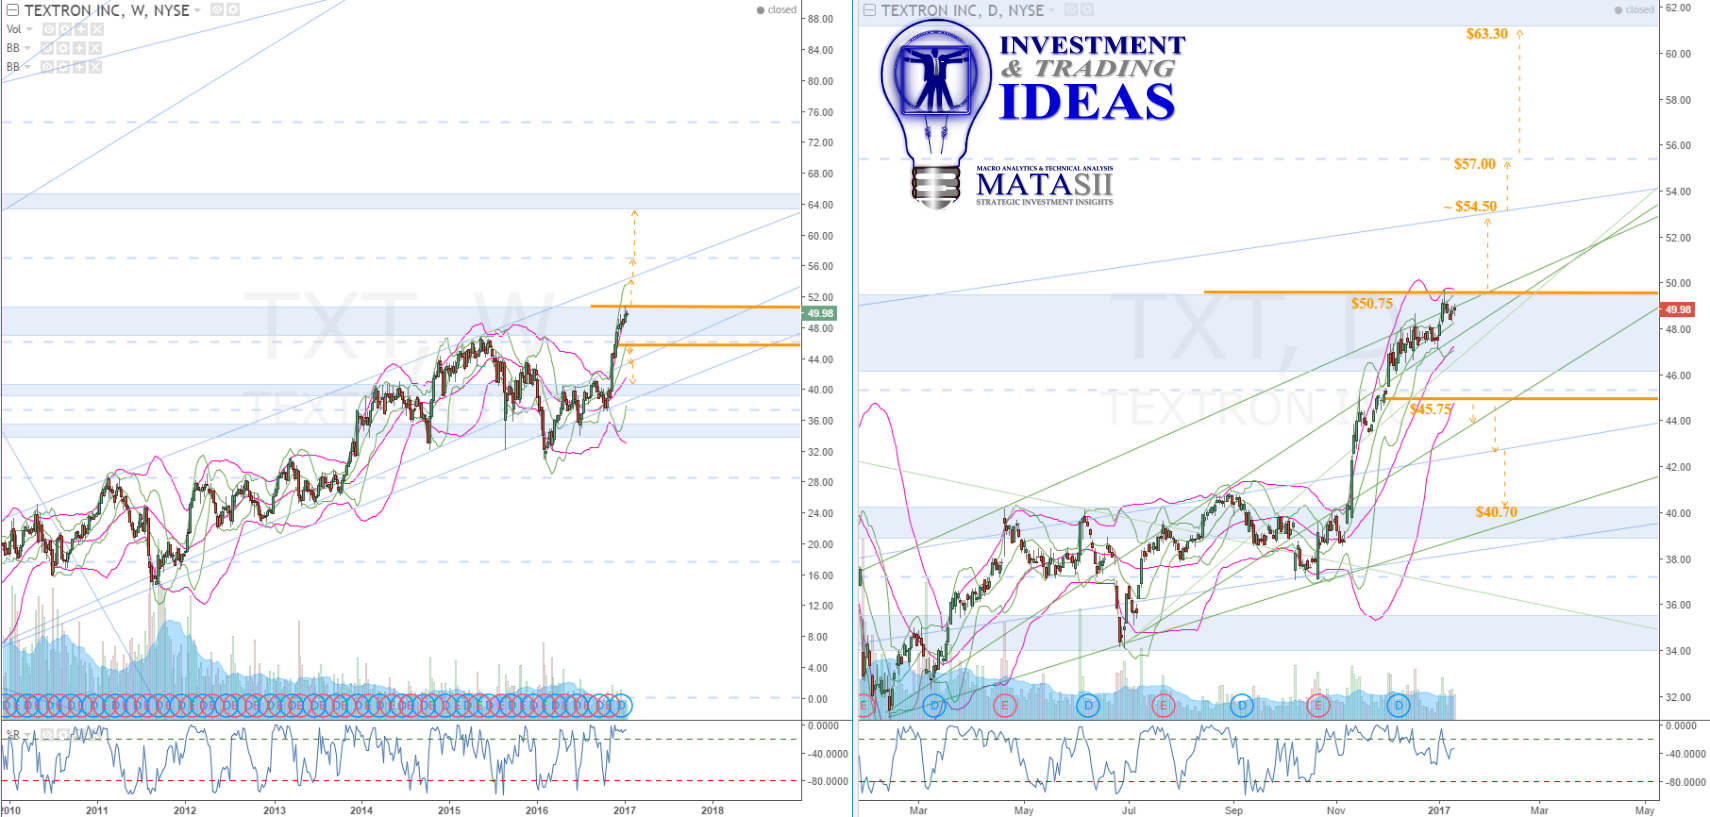
TXT has been in a steady rising channel since 2009. Current market sits at the top edge of a blue s/r zone: lifting through the top of the zone around $50.75 (and finding support from it) offers a potential opportunity for a lift to the channel resistance (sloped trend line ~$54.50 at this time). A break of the channel would have us looking towards the next technical: a Fibonacci level around $57.00. IF the market continues from there, the next significant levels can be seen at the next blue s/r zone around $63.30.
Note that there is a potential for the channel to hold. IF this occurs, or the current blue s/r holds and the market falls off from here, then waiting for a drop below $45.75 would offer less risk. Note the green s/r that could offer support just below this. A blue s/r and then the next lower blue s/r zone are target levels to watch: support could come from any of them.
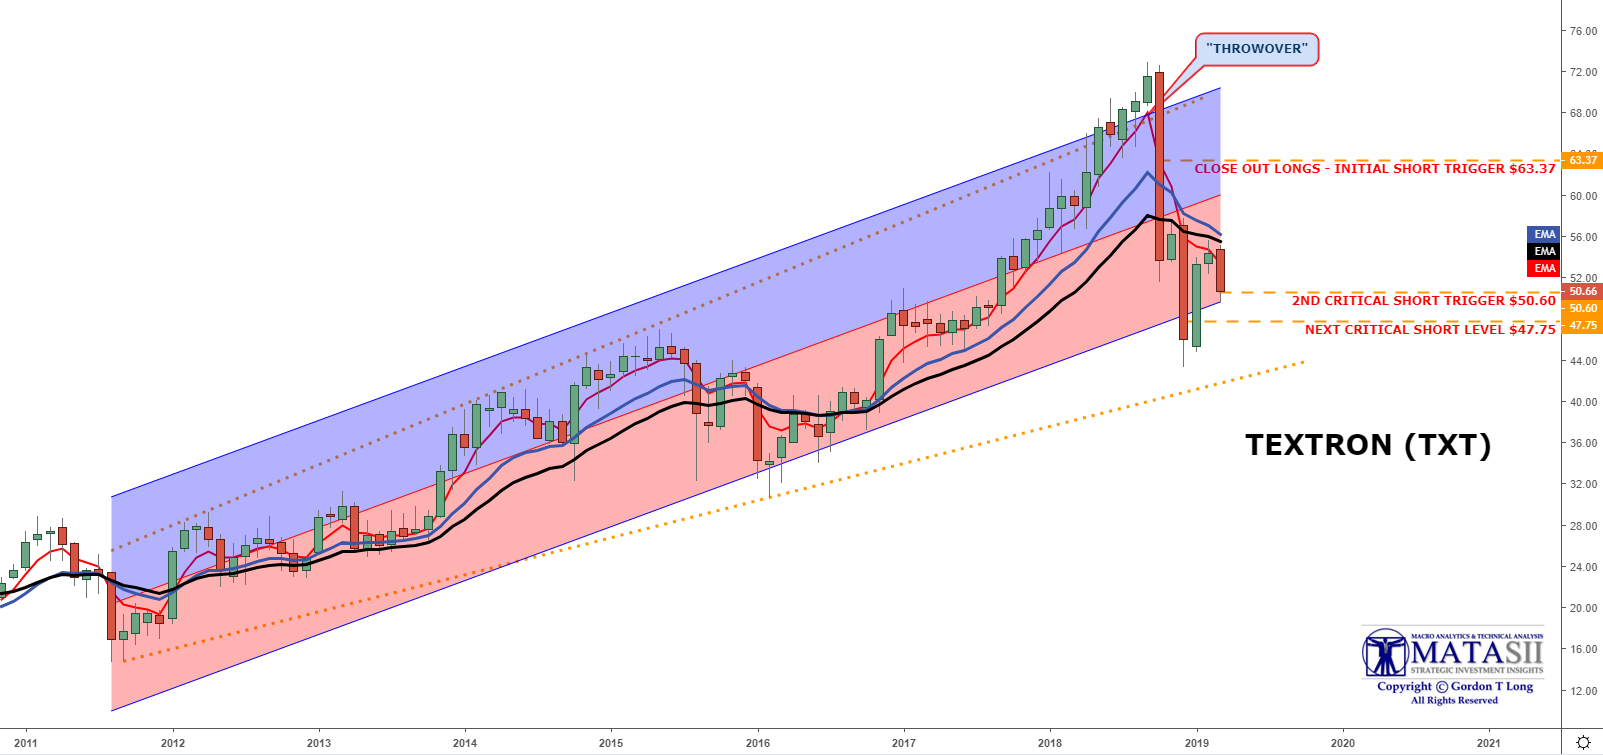
PRIMARY INDICATOR - Long Term: 6 Months - 2 Years
- NEUTRAL Bias - In Transition, Not Yet Trending
- Negative Bias would occur if the 12 MMA was to be clearly below the 24 MMA
- A break of the lower support trend line (in black) would confirm a NEGATIVE Bias
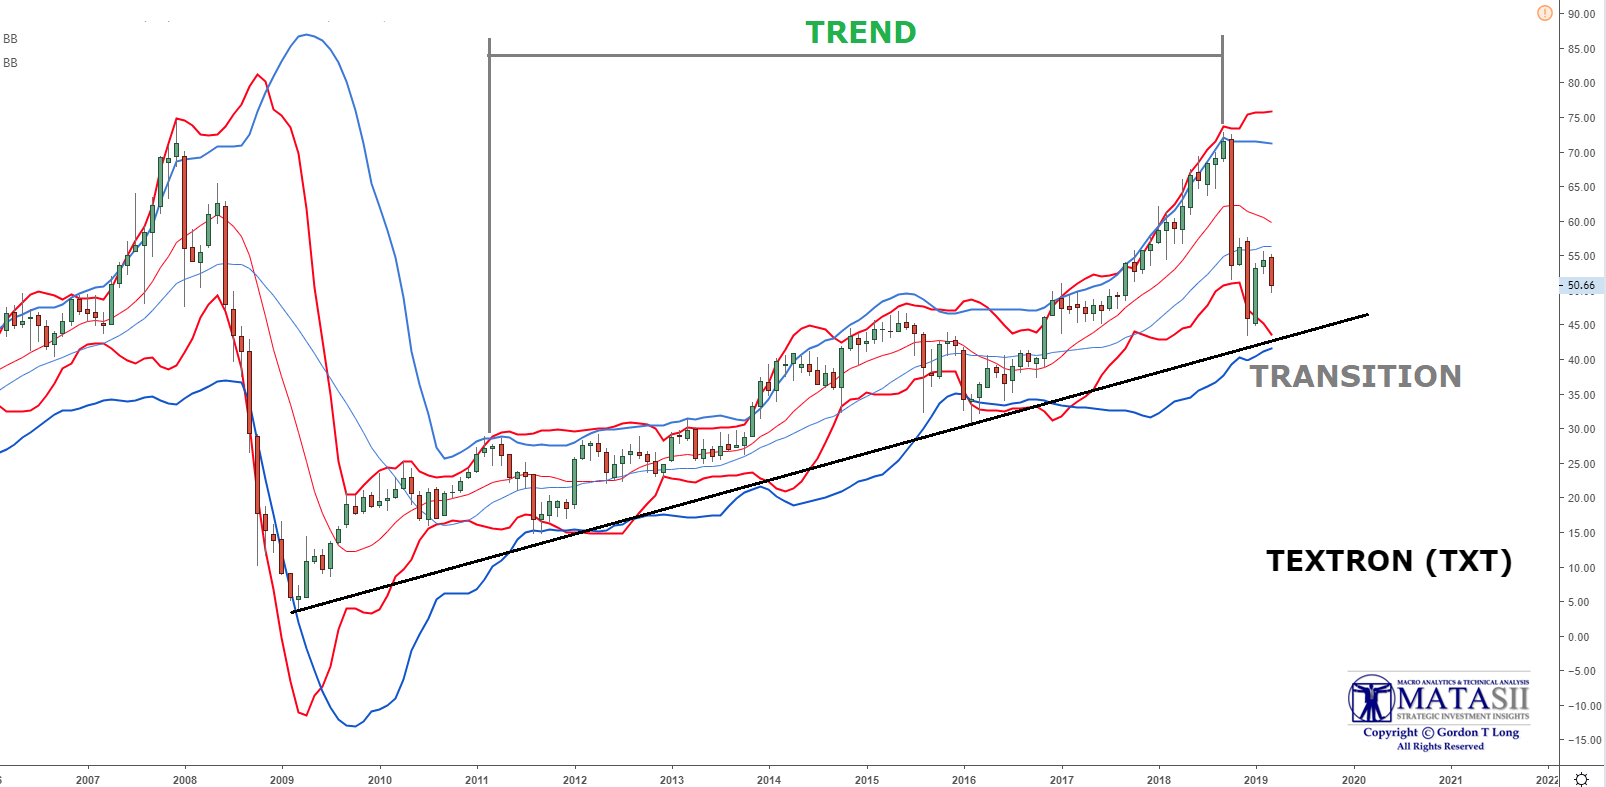
- We are approaching a NEGATIVE Bias since the 13 Monthly EMA (BLUE) is clearly above the 21 Monthly EMA (BLACK) while the 5 EMA has crossed below both the 13 & 21 EMAs
- We have had price break the lower 2 standard deviation of the longer term Regression. This suggests an approaching trend reversal,
- There is a strong possibility of price approaching the lower trend support (dotted line in orange) somewhere over the next two quarters.
SECONDARY INDICATOR - Intermediate Term - 3 Months - 12 Months
- MATA INDICATOR (Bottom Panel) is turning NEGATIVE,
- Further movements down would turn it NEGATIVE and would likely signal a key inflection point lower (accelerating decline).
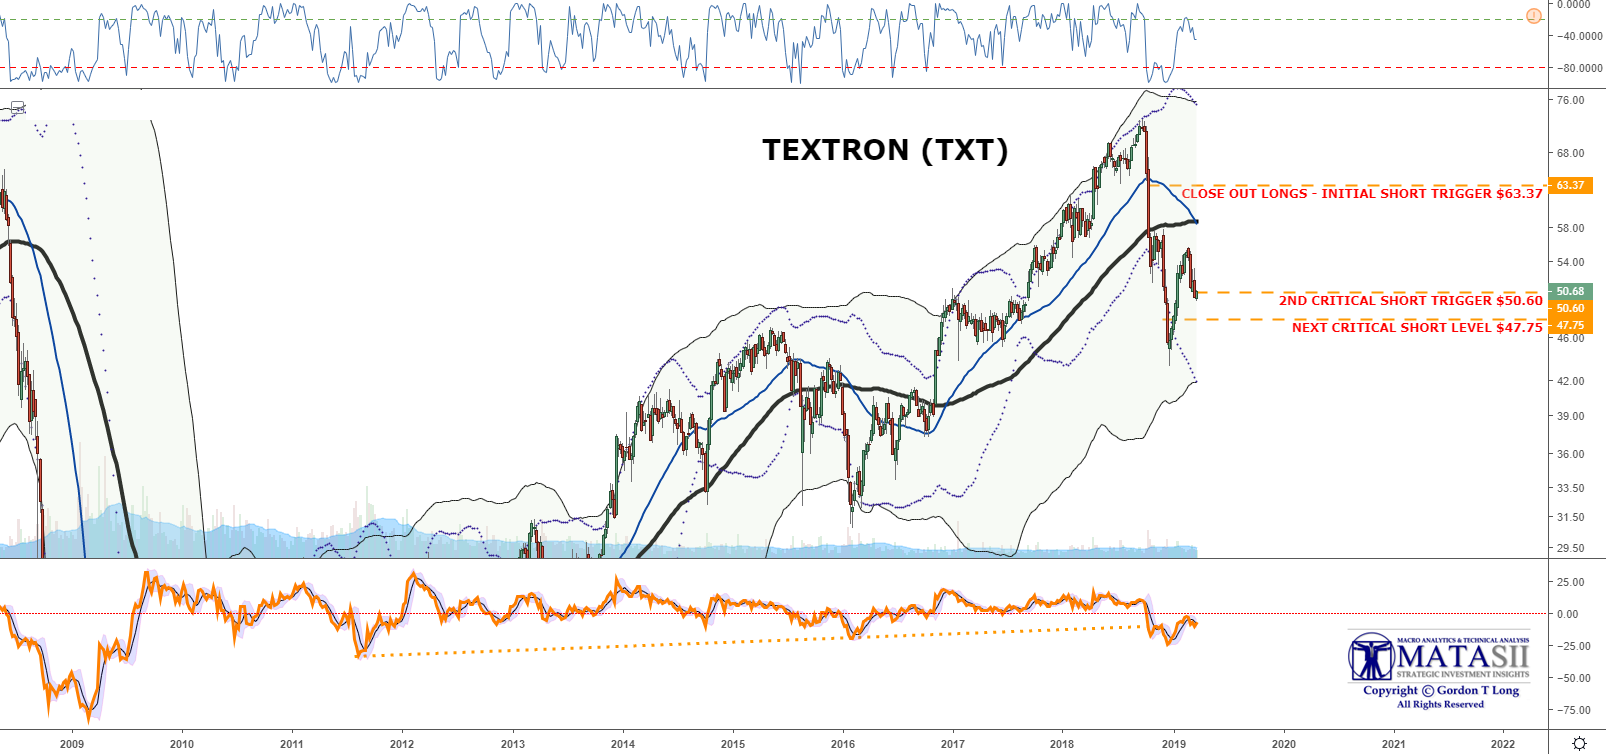
- This is currently the most important chart in this update,
- A break below 50.60 (the original LONG Trigger) is a very important support level,
- The 40 WMA is about to signal a "Death Cross" as it crosses the 80 WMA,
- If the 40 breaks below the 80 WMA then we have the 20 below the 40 WMA which is also below the 80 WMA - A NEGATIVE bias.
- Additionally, we have already had price bounce off (i.e. test) the 80 WMA's 2 Standard Deviation Bollinger Band giving an initial Bollinger Band Cross,
- A price target of 44 within two quarters is a strong possibility if price continues to weaken.
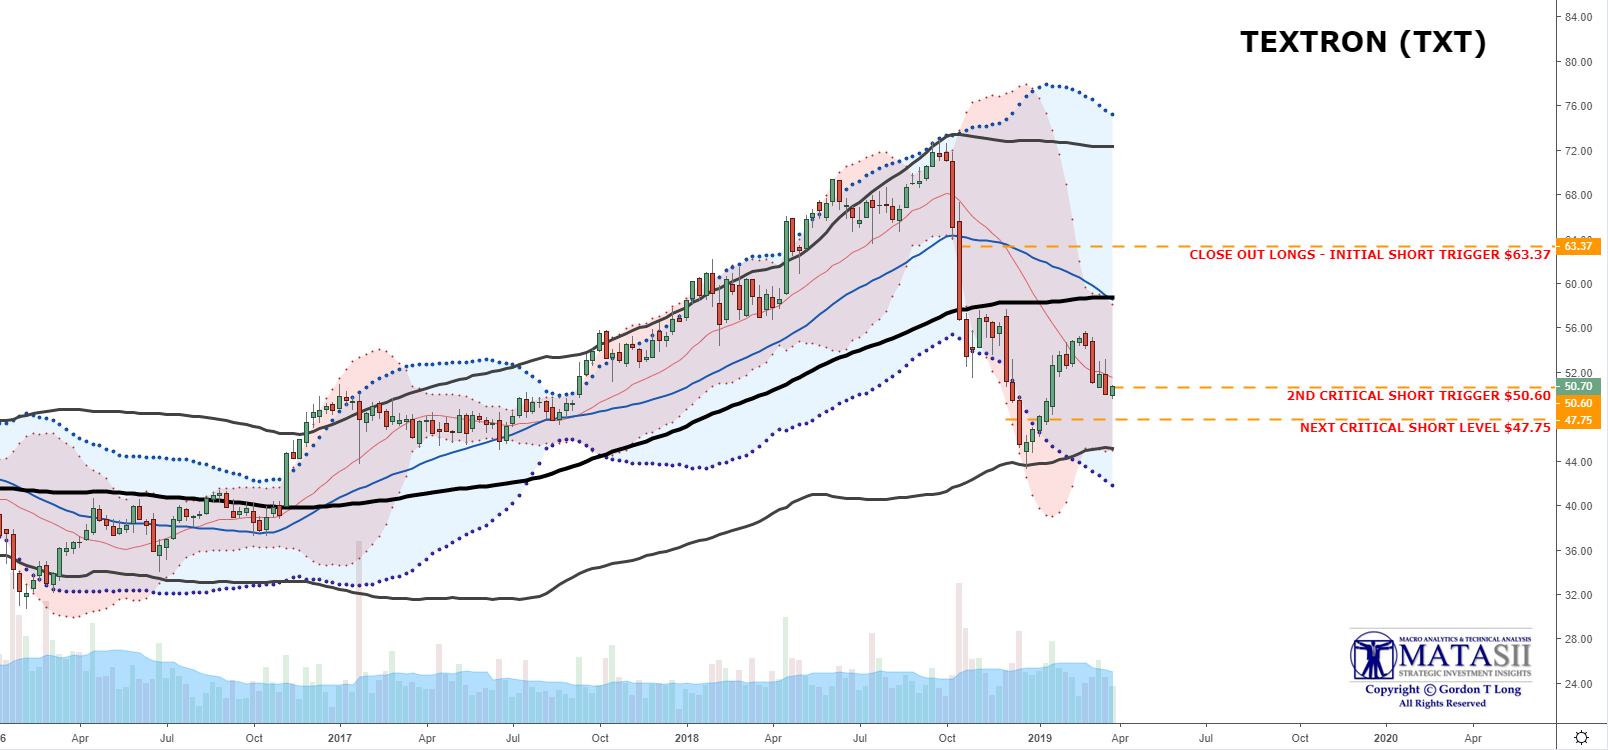
TERTIARY INDICATOR - Near Term - Next 1- 3 Months
- The 50 DMA has moved above the 100 as a result of price bouncing off the 200 lower Bollinger Band and a 61.8% Fibonacci Retracement,
- A lower GAP (NOT the upper one highlighted in yellow) is presently being filled as a result of this bounce.
- There is a strong chance that price will close on the falling 200 DMA before possibly heading lower.

- The MATA Indicator suggests we are headed lower if the current overhead resistance holds,
- Price is below the 89 DMA and the 31 DMAS is rolling over - not good signs,
- There are strong indications we will test the $47.47 support level which is 6% lower than we are currently trading at.

FAIR USE NOTICEThis site contains copyrighted material the use of which has not always been specifically authorized by the copyright owner. We are making such material available in our efforts to advance understanding of environmental, political, human rights, economic, democracy, scientific, and social justice issues, etc. We believe this constitutes a 'fair use' of any such copyrighted material as provided for in section 107 of the US Copyright Law. In accordance with Title 17 U.S.C. Section 107, the material on this site is distributed without profit to those who have expressed a prior interest in receiving the included information for research and educational purposes. If you wish to use copyrighted material from this site for purposes of your own that go beyond 'fair use', you must obtain permission from the copyright owner.
NOTICE Information on these pages contains forward-looking statements that involve risks and uncertainties. Markets and instruments profiled on this page are for informational purposes only and should not in any way come across as a recommendation to buy or sell in these assets. You should do your own thorough research before making any investment decisions. MATASII.com does not in any way guarantee that this information is free from mistakes, errors, or material misstatements. It also does not guarantee that this information is of a timely nature. Investing in Open Markets involves a great deal of risk, including the loss of all or a portion of your investment, as well as emotional distress. All risks, losses and costs associated with investing, including total loss of principal, are your responsibility.