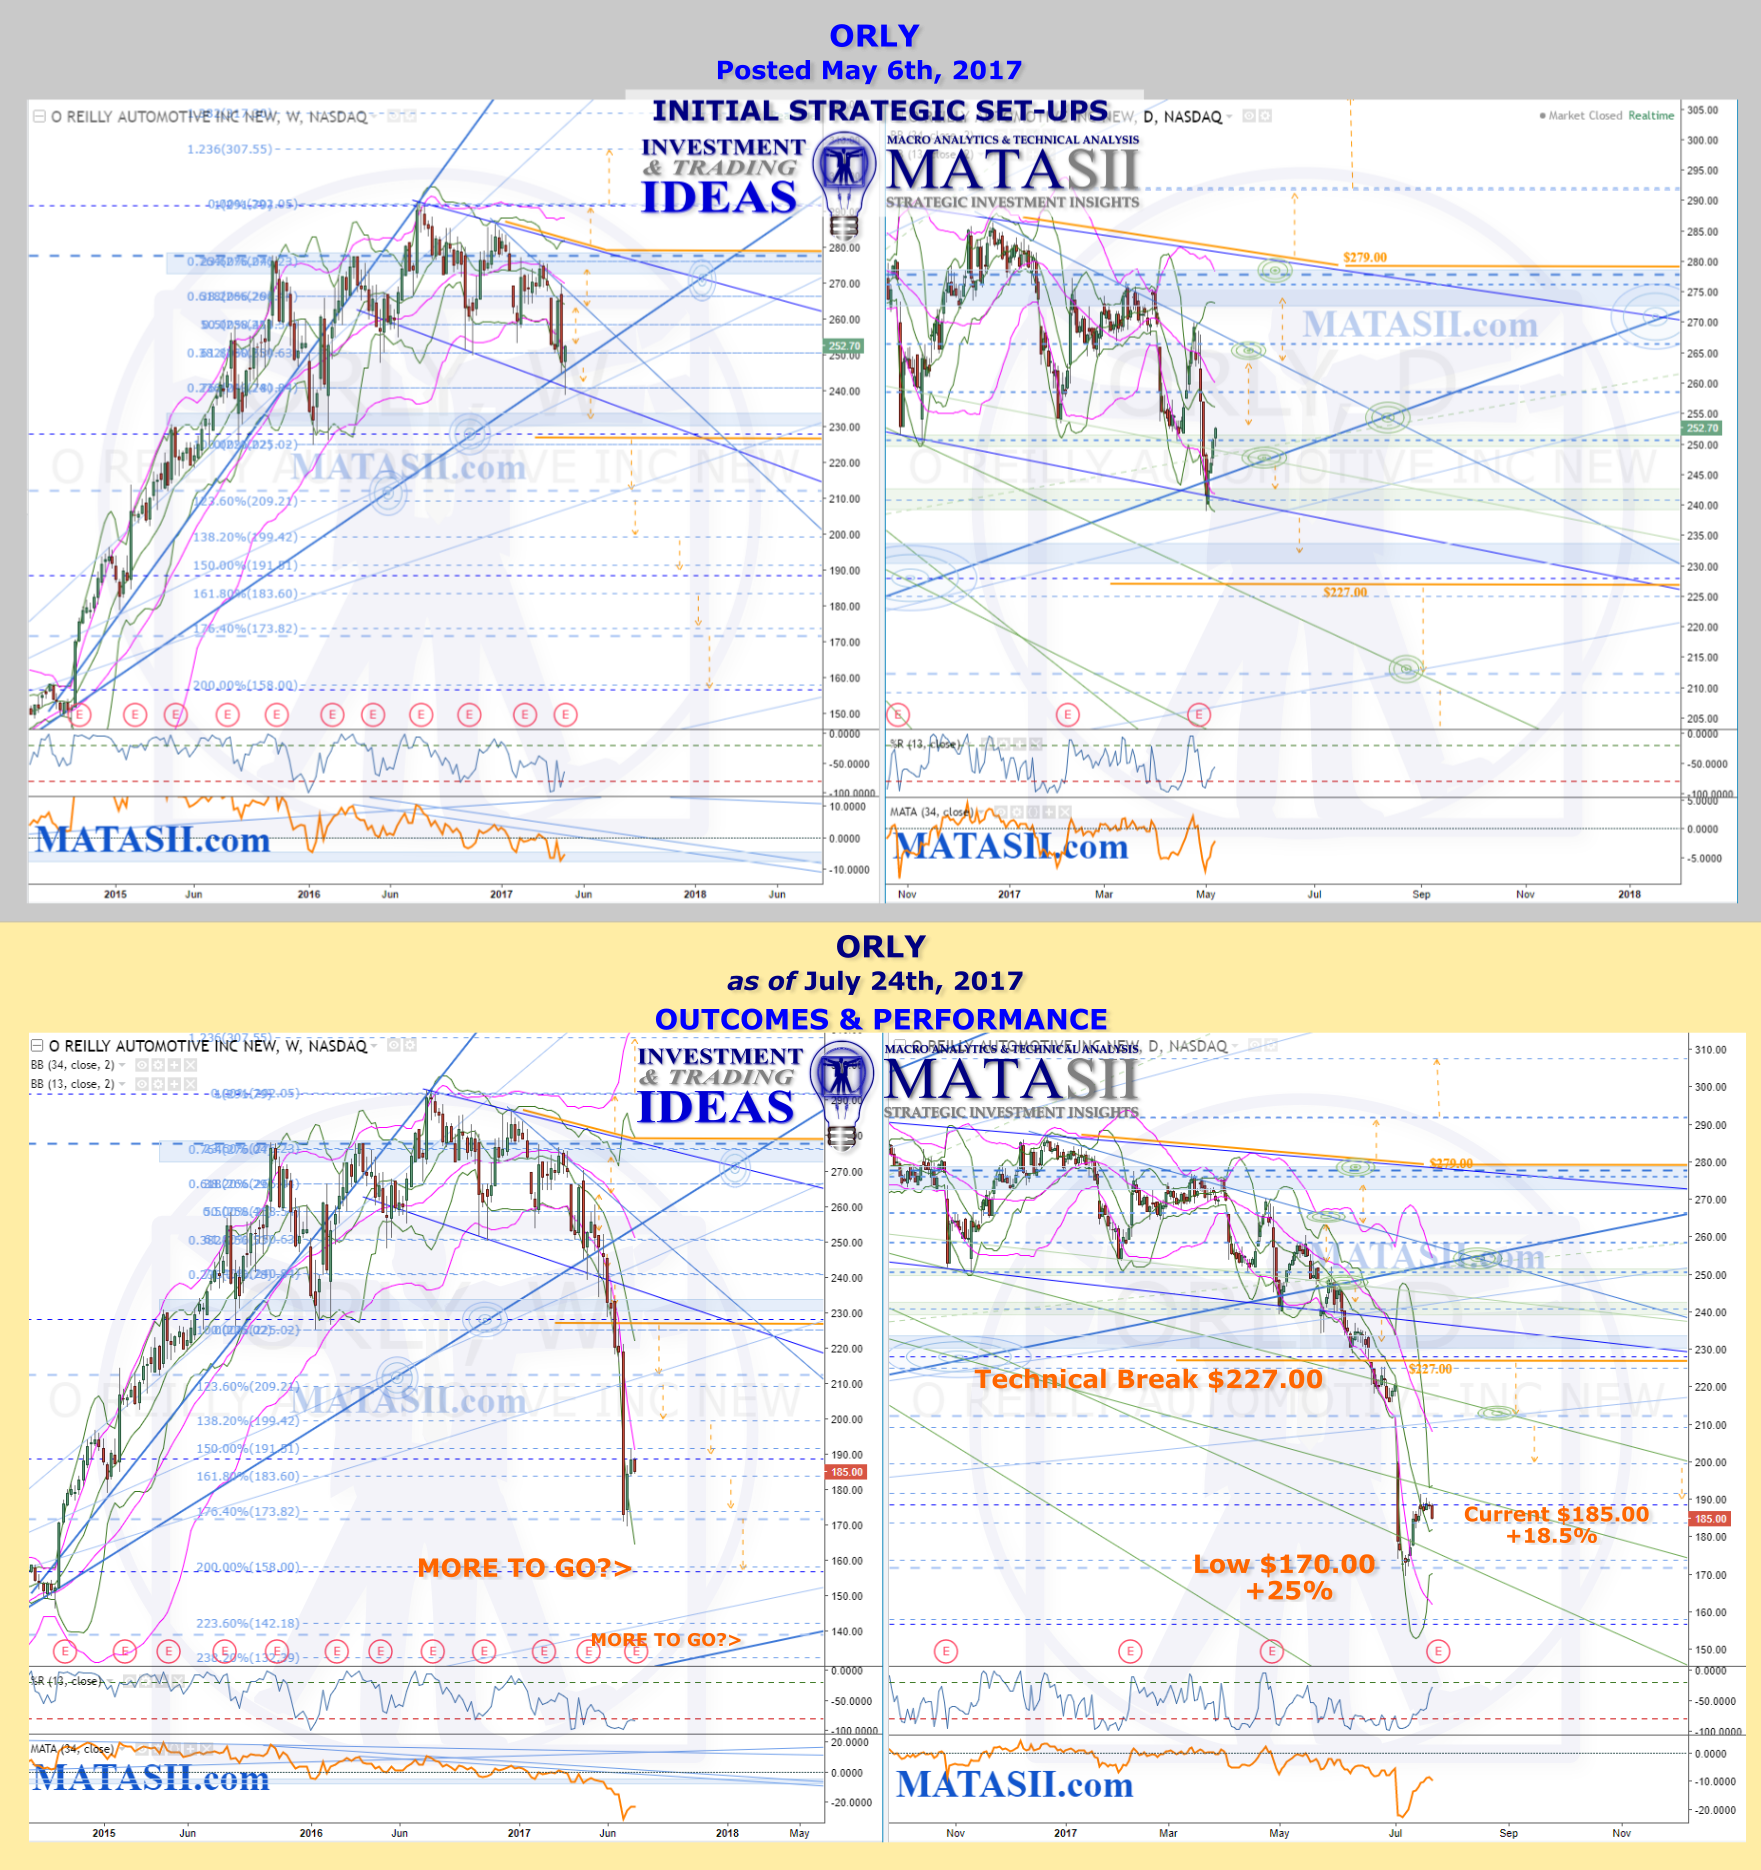
Below you can see the original post for ORLY's technical set-up on May 6th, 2017; and the current market as of July 24th, 2017. The significant technical break around the $227 level occurred; and a low of $170 (+25%) was reached. While we had identified the $227 level as one of significance, there were also several other potential opportunities given that could have resulted in an even better performance had you been willing to accept more risk (orange dashed arrows). Our original post on May 6th makes note of the technical road map given in our charts, discussing how we could expect to see a market reaction at the technicals, as well as movement between them. If you look closely you can see that the market does indeed follow the technicals well: pausing and consolidating at significant technicals as it moves and bounces between them. These are potential opportunities.