RELIABLE MOMENTUM DIVERGENCE SENDING AN EQUITY MARKET WARNING
-- SOURCE: 09-27-18 Kimble Charting - "Could This S&P 500 Divergence Lead To Another Historic Market Correction?" --
After navigating an early year stock market correction, investors have seen the S&P 500 climb back to new all-time highs.
While making new highs is bullish, it’s concerning when it comes with a significant divergence.
In this case, it’s a momentum divergence.
And history has shown that while some divergences are ignored for weeks or months, there have been a couple in the past 20 years that have lead to significant declines.
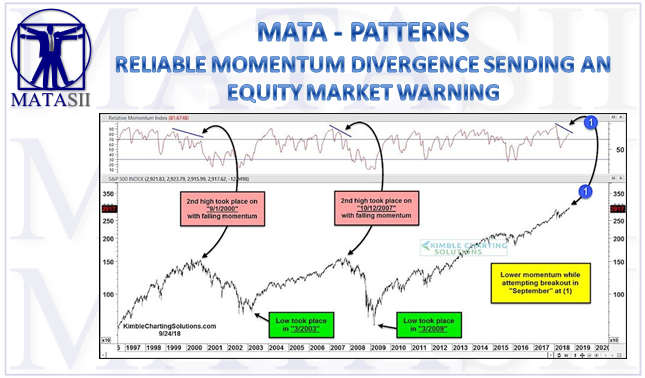
Both of these momentum divergences came when the S&P 500 made a “second high”. See chart below.
Looking at the chart below, you can see that while the S&P 500 is trying to breakout in September (and making a second high), it’s seeing a lower momentum reading.
Two notable times we saw divergence patterns and readings like this were September 2000 and October 2007. Yikes!
S&P 500 “Second” Peaks with Momentum Divergences

History doesn’t always repeat itself, but it does offer investors a thoughtful reminder of why it’s important to pay attention to risk indicators... and to always have a plan!