WEEKLY
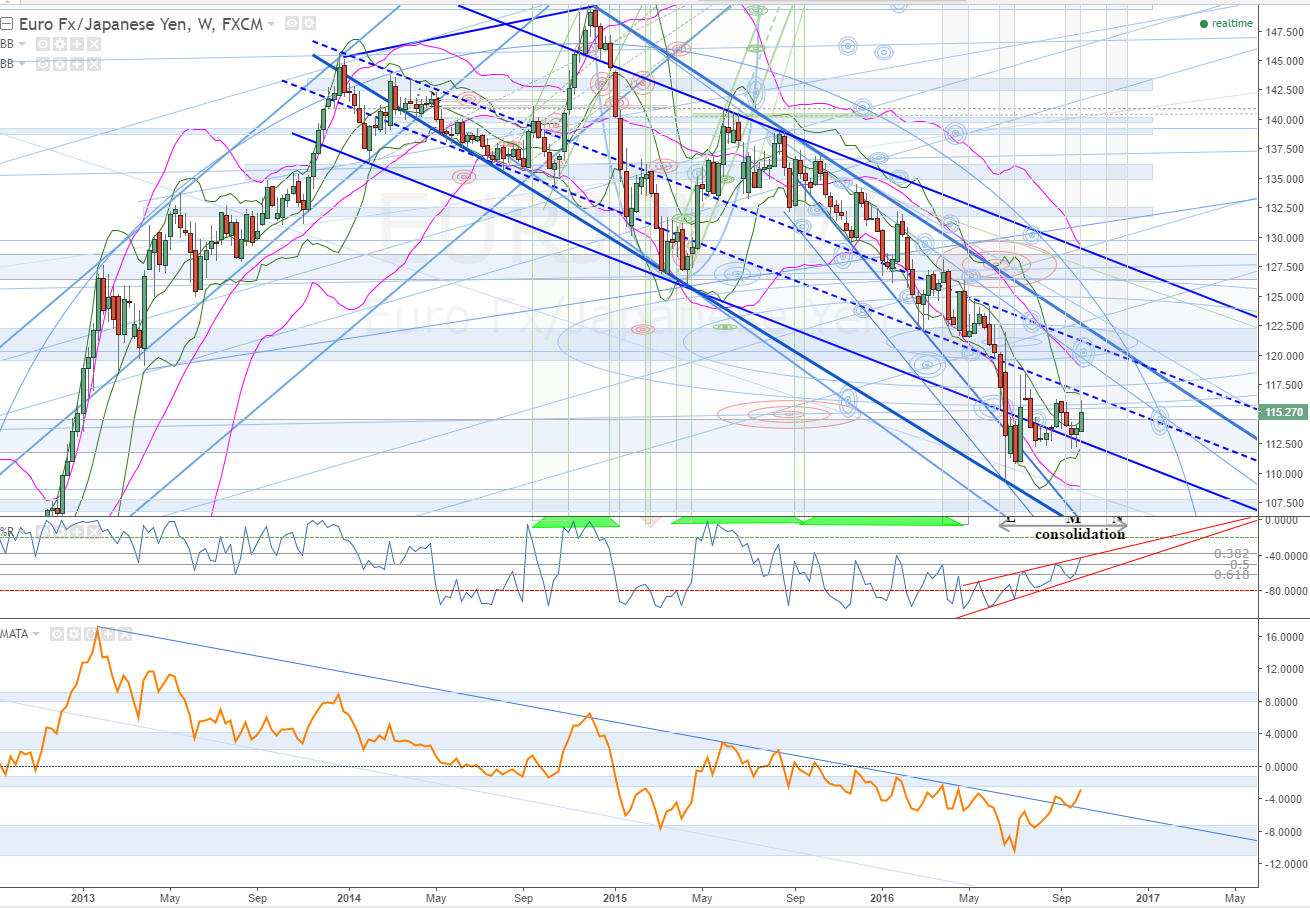
Market remains in sideways consolidation. Positive bias remains within the larger down trend. W%R was lifted higher yesterday, however it still indicates positive pressure on the market. Potential still exists for another significant lift, similar to the lift from the the lows in July (lows of the chart).
DAILY
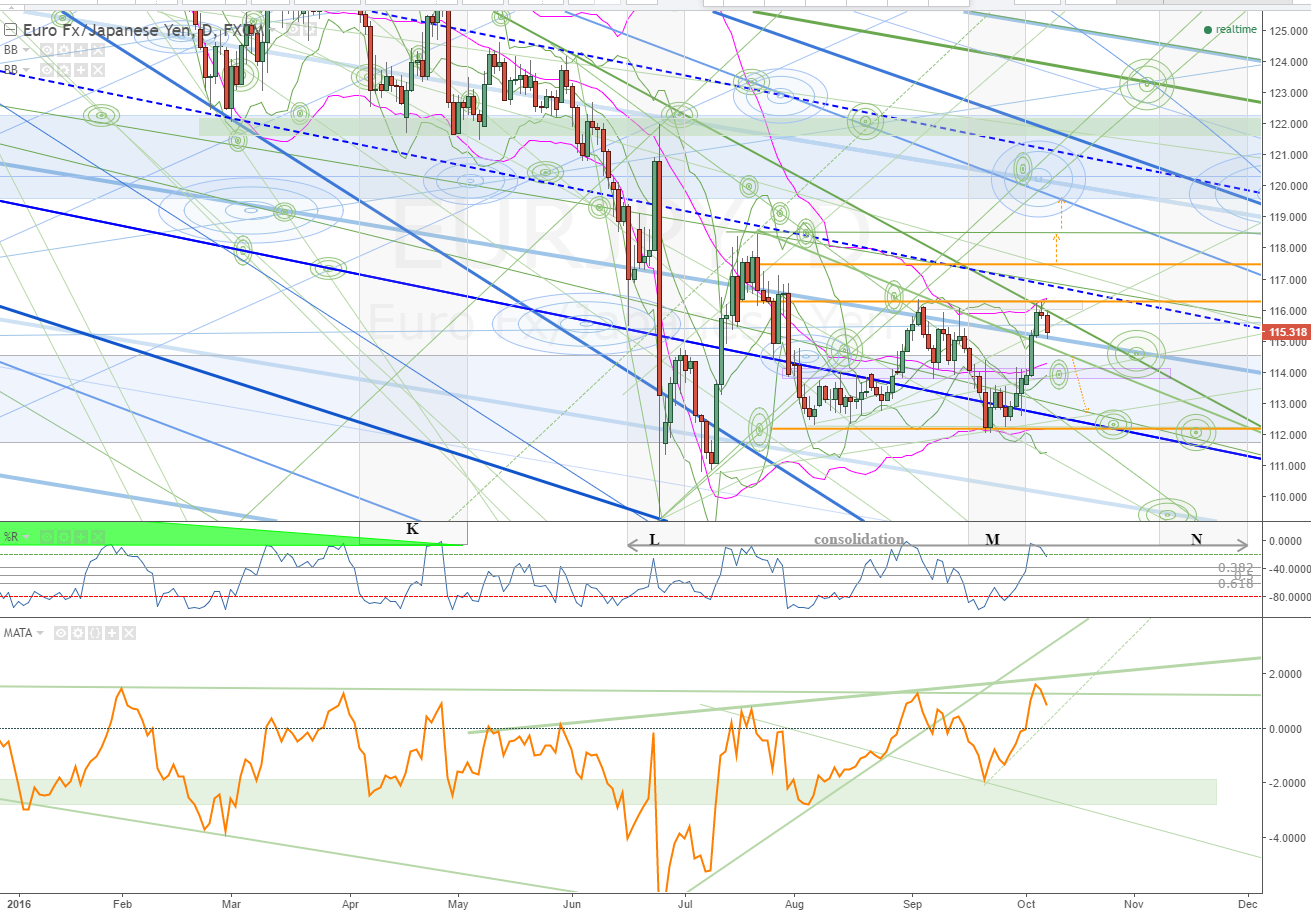
Resistance was found at significant technicals. At this point the move is still considered a consolidation or pullback to the recent lift and the potential exists for another wave up. W%R is still lifted (although turned) and needs to fall off further for a trend change consideration. MATA indicator is still in a positive trend; a break up through the thicker green s/r (support/resistance) is ideal to confirm a lift and continuation of larger trend.
Pullback to the 34ma a possibility, daily target can be seen. A drop to this could still see support and lift; a break through the technicals here would offer opportunities for a move back to the lows.
240
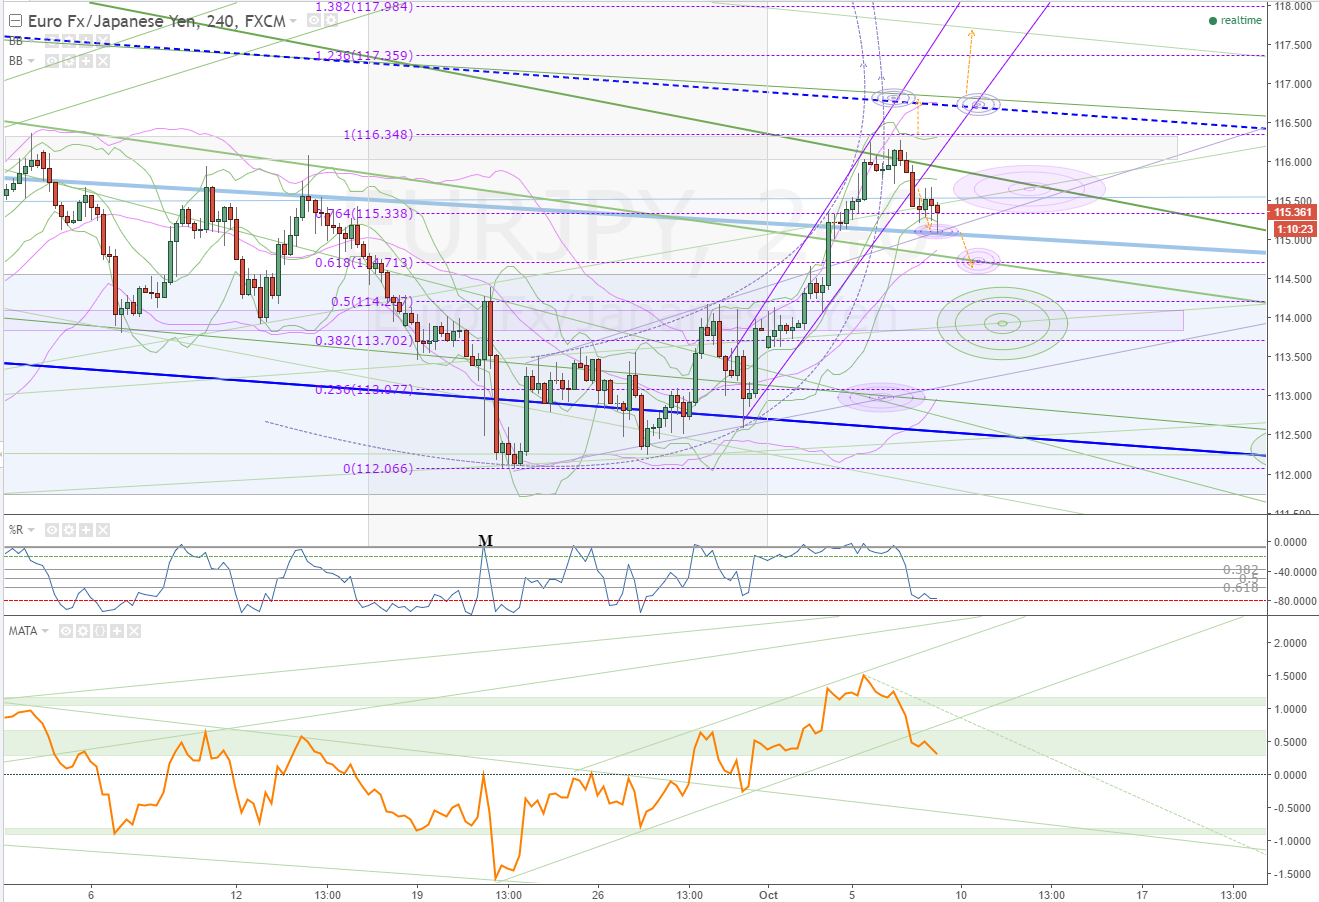
Recent drop landed in a purple 4hr (240min) HPTZ (High Probability Target Zone) and found support from the green LBB (lower Bollinger band) and the weekly blue s/r.
Breaking through these and the pink 34ma that can be seen lifting in to the area offer opportunities for further drop to the next significant technicals.
Note purple fib retracement levels - these can be used as triggers, targets and stops; we would expect the market to react to them in some manner.
240 time scale showing Negative pressure and more down potential. W%R has completely fallen off, MATA indicator has broken from pattern. Room on both for more down.
60min
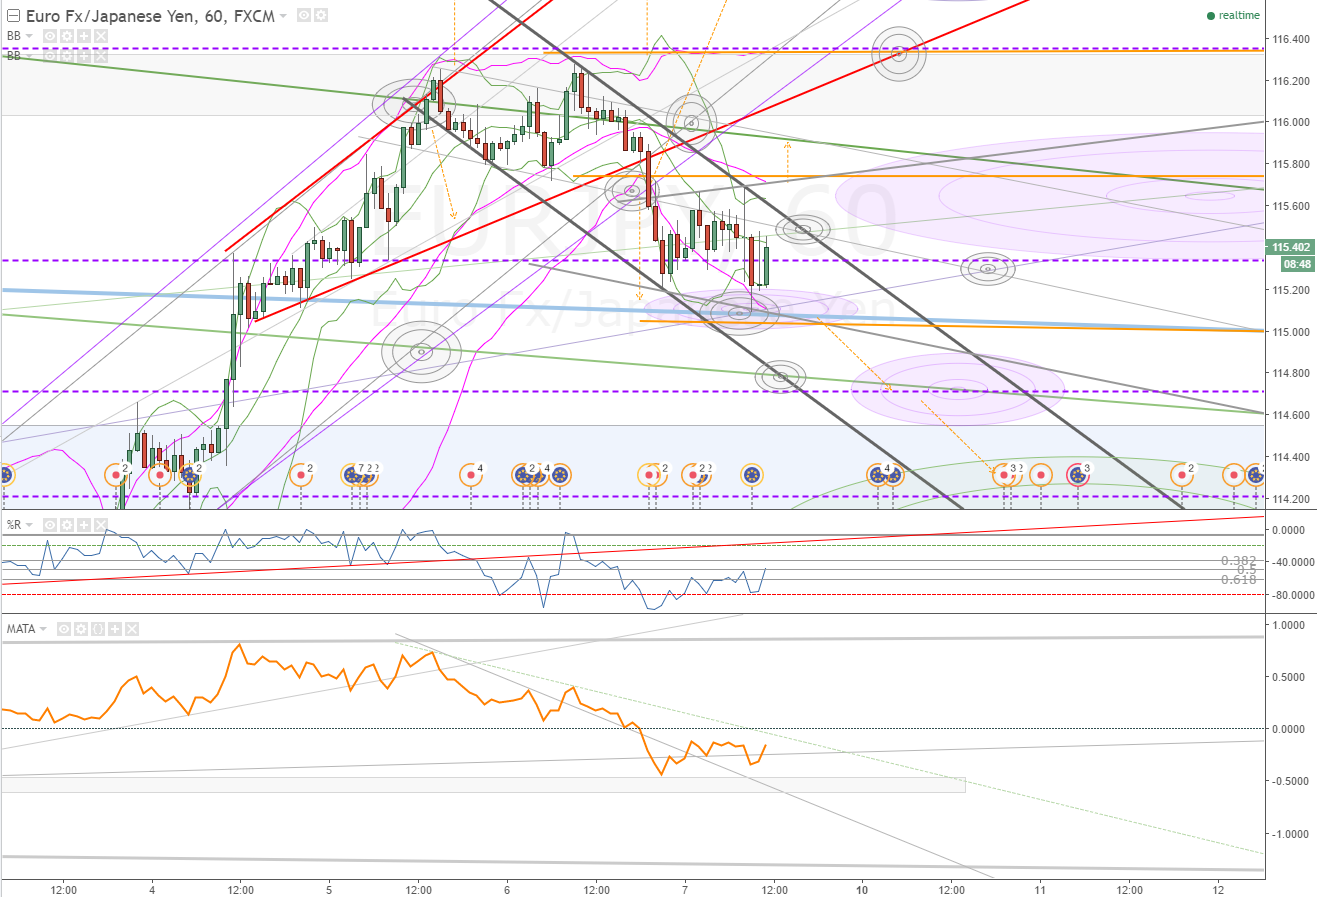
Since yesterdays conversation the market has fallen off: dropping through a HPTZ as it broke down through the red pattern s/r as well as the purple channel support. The drop continued, bounced at the grey s/r and eventually spikes in to purple 240 HPTZ and the 60min grey HPTZ as it consolidates sideways.
Short term opportunities exist as shown with the orange trigger levels and orange dashed arrows. Expect consolidation at significant technicals. These can be bound by s/r's and opportunities exist when those are broken for a move to the next significant technical.
Until grey channel is broken, negative bias remains and short opportunities exist.
When the market starts to lift through the 13ma, bounce between the 13 and 34ma, and then starts to find support from the 34ma, you know you have a potential reversal underway. this should occur as the market breaks from the channel. Moving through the ma's is a process, that repeats, and can be traded. It is the process of trend change and it can be traded through out. (very short term opportunities )
OVERVIEW
Long term weekly trend is still down, however the market is currently in a consolidation and there is a positive bias. Early indications suggest that this could eventually be more than just a consolidation to the larger down.
Shorter term we are seeing weakness. Resistance has occurred and we are watching to see how low it will go before it reverses. There is a possibility that this could see a drop to previous lows - recent daily pattern. Fib retracement levels and other significant technicals give us places to look for short term trade opportunities as the market moves through them; as well as places to watch for potential reversals and a possible continuation of the larger trend (up).