SEPTEMBER 2018 S&P 500 TARGETS
THERE IS A POTENTIAL FINAL UPSIDE HIGH OF ~3052-3200 BY YEAR END 2019
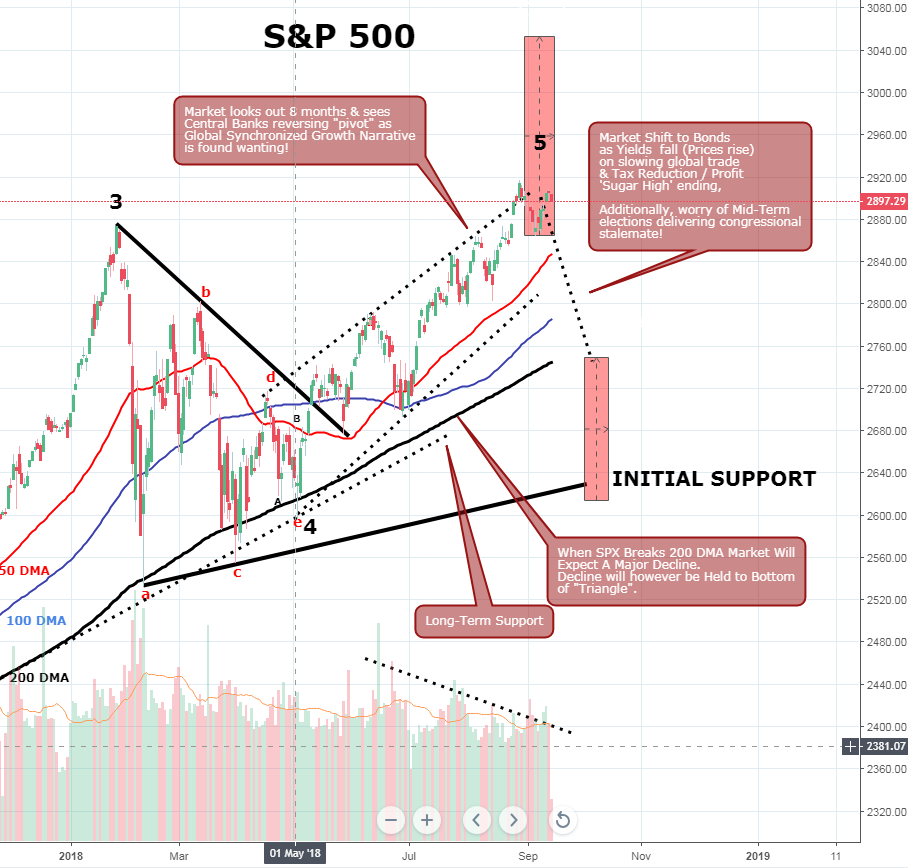
IN THE SHORTER TERM A SUPPORT TEST OF ~2500 (400 DMA) IS POSSIBLE BUT A LOW PROBABILITY
LONG TERM PRIMARY TREND
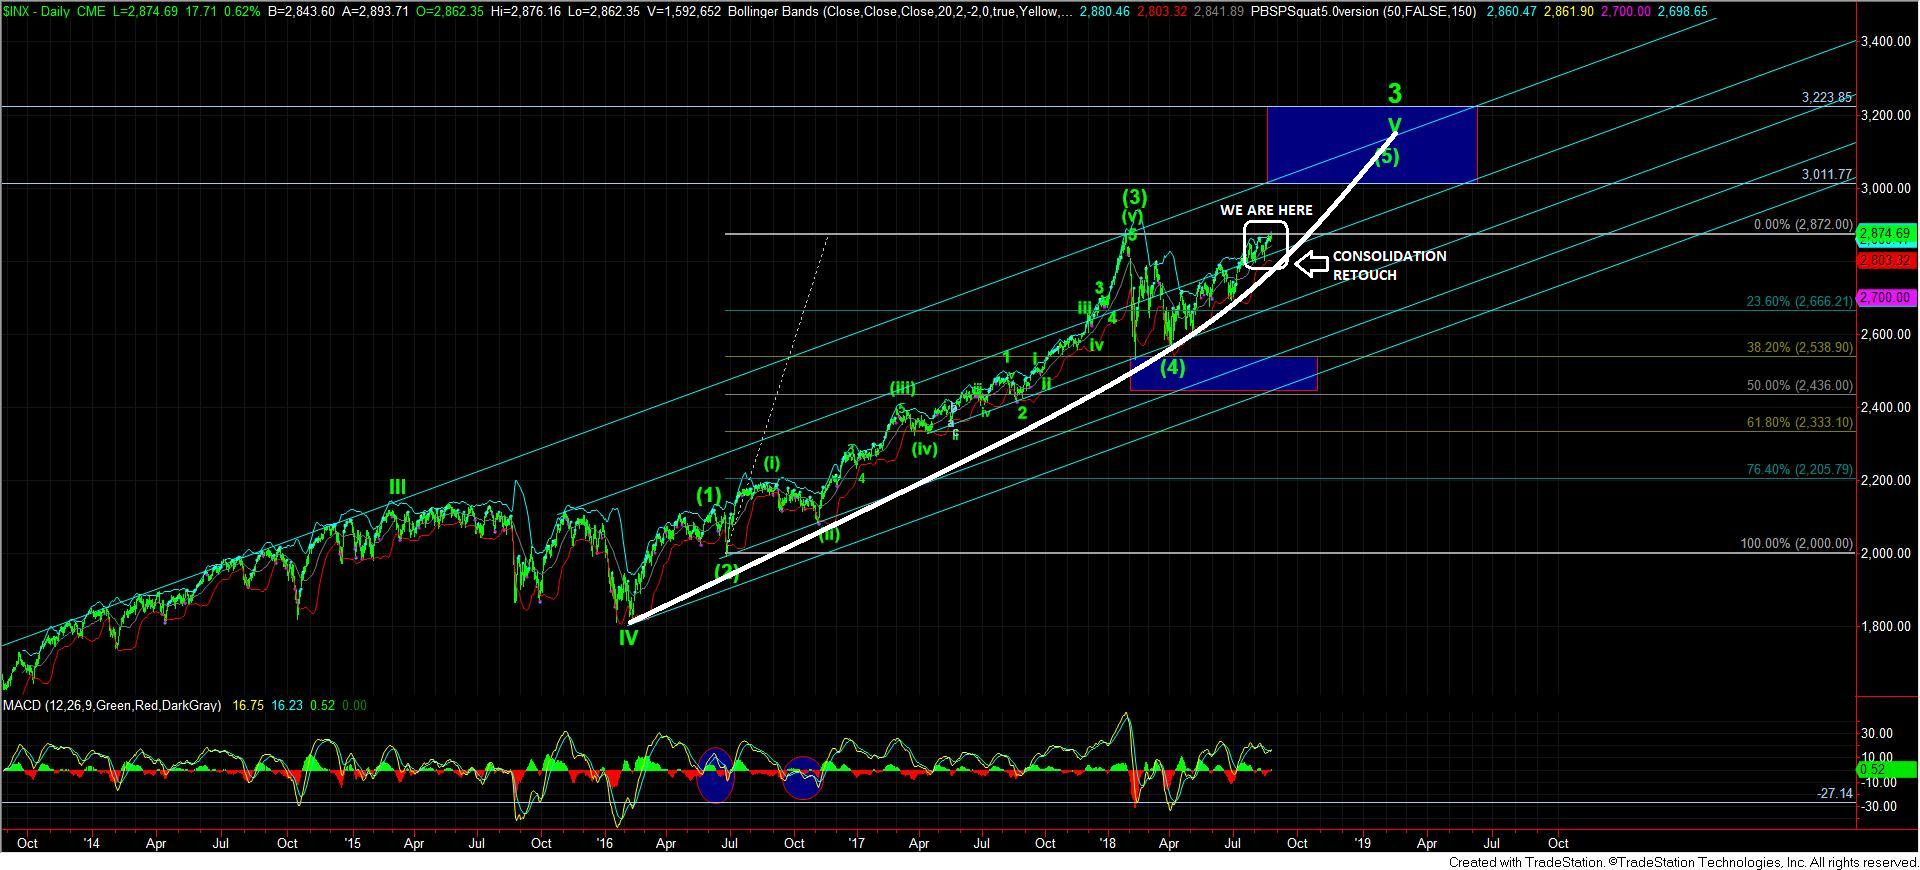
The Bollinger Bands for the 12 & 24 MMA's HAS YET TO "CURL". This is a strong indicator (WHICH HAS YET TO OCCUR) and then normally foretells that a corrective / consolidation period is underway.

ELLIOTT WAVE: COUNT APPROACHING TERMINATION
The Elliott Wave Count suggests that a final wave in second half 2018 could take the S&P 500 above 3000 by Year End but we are likely to see some corrective action prior to highs of S&P 500 of 3050.
- We are presently looking for a corrective consolidation back to the S&P 500 200 DMA,
- The Parabolic pattern (in white) currently approximates the 200 DMA