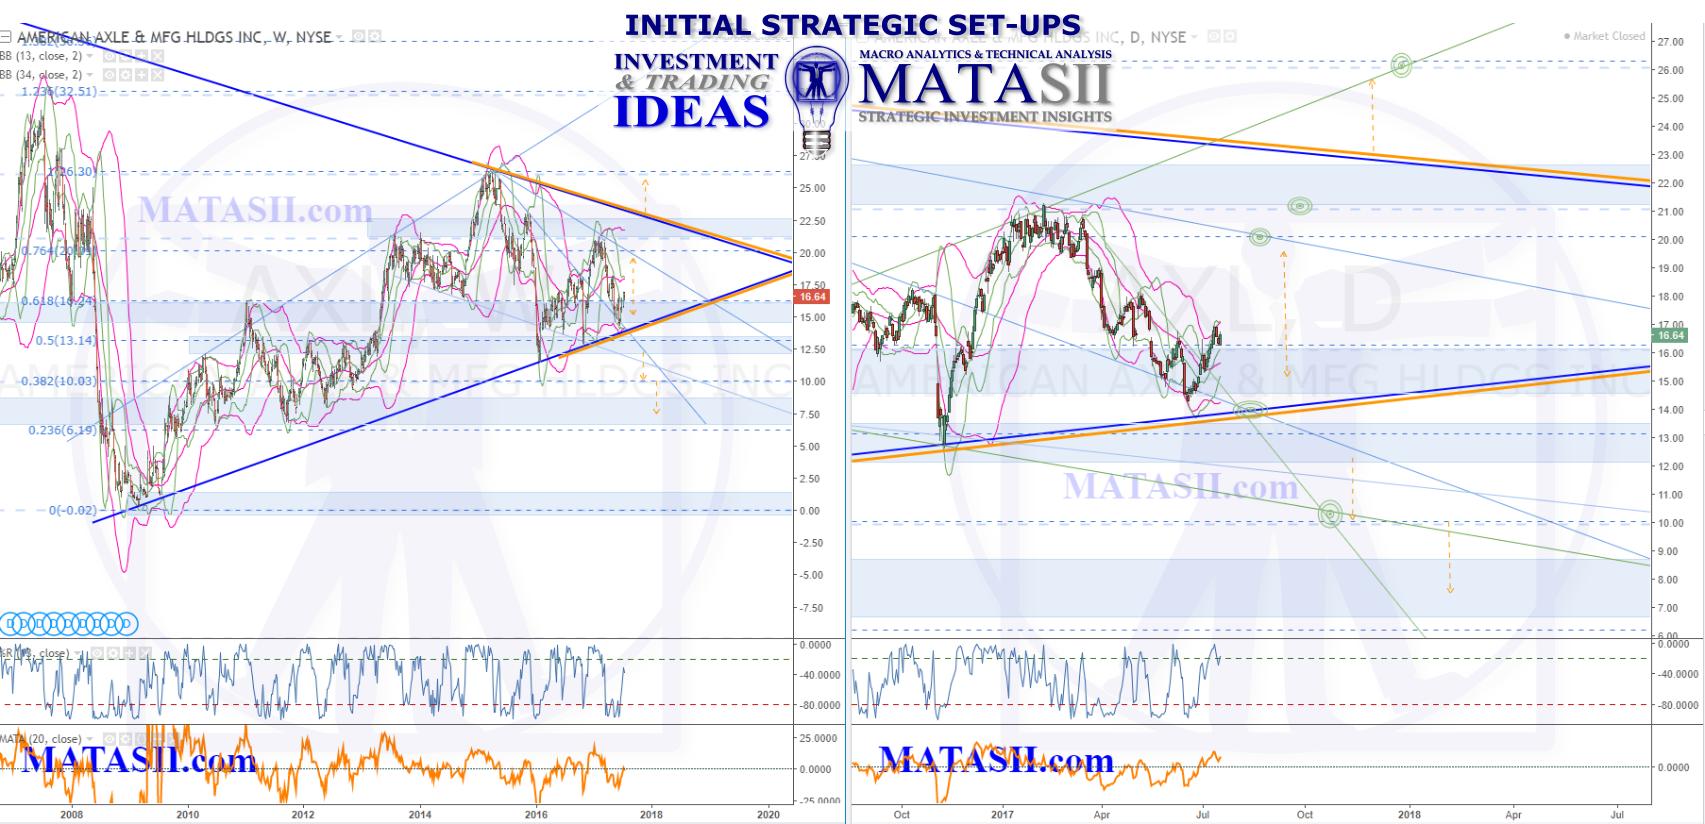
Our long term weekly perspective (left chart) shows AXL in a potential contracting wedge pattern. Solid orange highlights the patterns support & resistance; breaking these offers potential opportunities for the next significant move from the market. Along with the patterns support & resistance, blue s/r zones can be seen to have held the market, both from above and below. These also offer potential opportunities: we would expect market reaction at them, and when broken through, a move to the next blue s/r zone or other significant technical.
The indicators are suggesting more potential lift in the near future: the weekly W%R in particular looks like it could have more lift before rolling over. Note the market has fallen off from highs, and at this point the "highs" are lower than previous, suggesting a topping is in process. More play could be in store for AXL to bounce around in the large weekly wedge pattern; when this breaks there is potnetial for a significant market move.