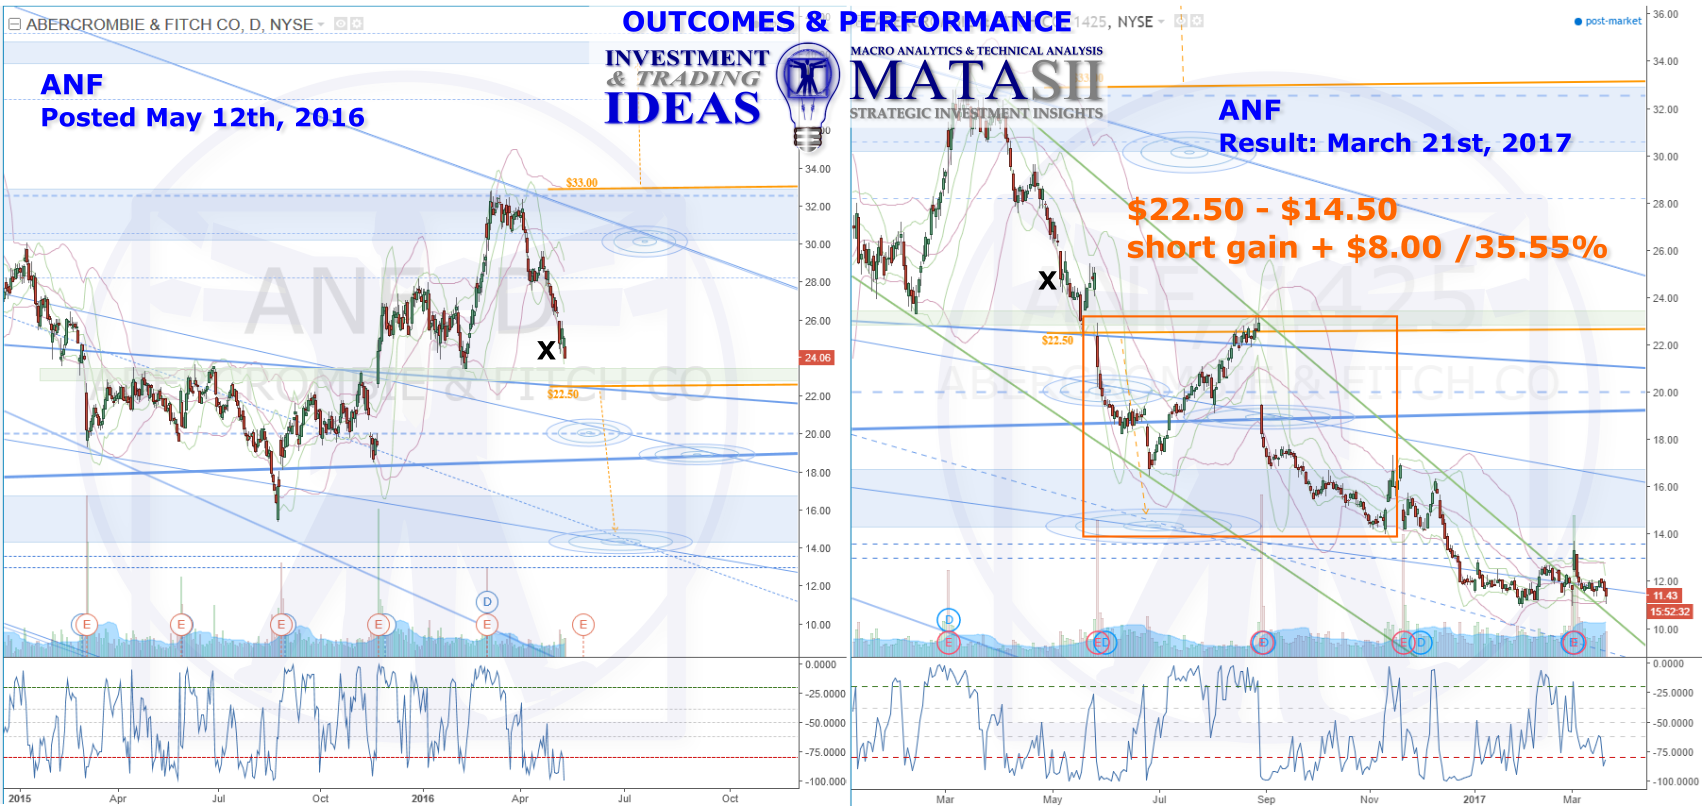
In May 2016 we posted ANF with some potential technical opportunities to consider. The left hand chart is the daily at that time; the right hand chart shows the current market as of March 21st, 2017. “X” marks the same location on both charts to help with orientation. From X we see a wiggle […]
Outcomes
JCP IDEA OUTCOME, HPTZ Method & Market Roadmap
Our original post and ideas can be seen on the left hand chart (JCP daily), posted May 11th, 2016. The right hand chart is the current daily JCP (March 14th, 2016). The long term macro bias for this has been negative, and overall the market is now down 25% ($8 – $6). It could have […]
WMT IDEA OUTCOME, HPTZ Method & Market Road Map
The High Probability Target Zones methodology (HPTZ) that is used to assess our charts provides a detailed and accurate market road map that can be used to facilitate any investment or trading strategies. Below we show an example of this using WMT, originally posted May 11th, 2016. The solid orange lines seen on the left […]
XLY IDEA OUTCOME +6.46%
After our initial posting the market continued sideways with a slight positive slant. An initial drop off and then lift stay within the potential trigger consideration boundaries before finally breaking to the up side. An orange dashed arrow highlights a potential move to watch for, and we can see that the market has now reached […]
SII TGT 5 Day Trade +10 1/3%
TRADE SET-UP Target was sitting about 1/2 way within a long term upward trending channel (blue). Recent movement had found support and resistance from previous s/r zones – green zones above and below current market. The technical trade considerations accounted for a lift or drop from the channel created by the green s/r zones. Target […]