The High Probability Target Zones methodology (HPTZ) that is used to assess our charts provides a detailed and accurate market road map that can be used to facilitate any investment or trading strategies. Below we show an example of this using WMT, originally posted May 11th, 2016.
The solid orange lines seen on the left hand chart offer technical trigger considerations if broken. These are usually placed at long term significant technicals, and if broken, represent a break out of the prevailing larger pattern or other support / resistances that are currently holding the market. Note that in our WMT idea below the market has yet to break through those highlighted technical trigger considerations.
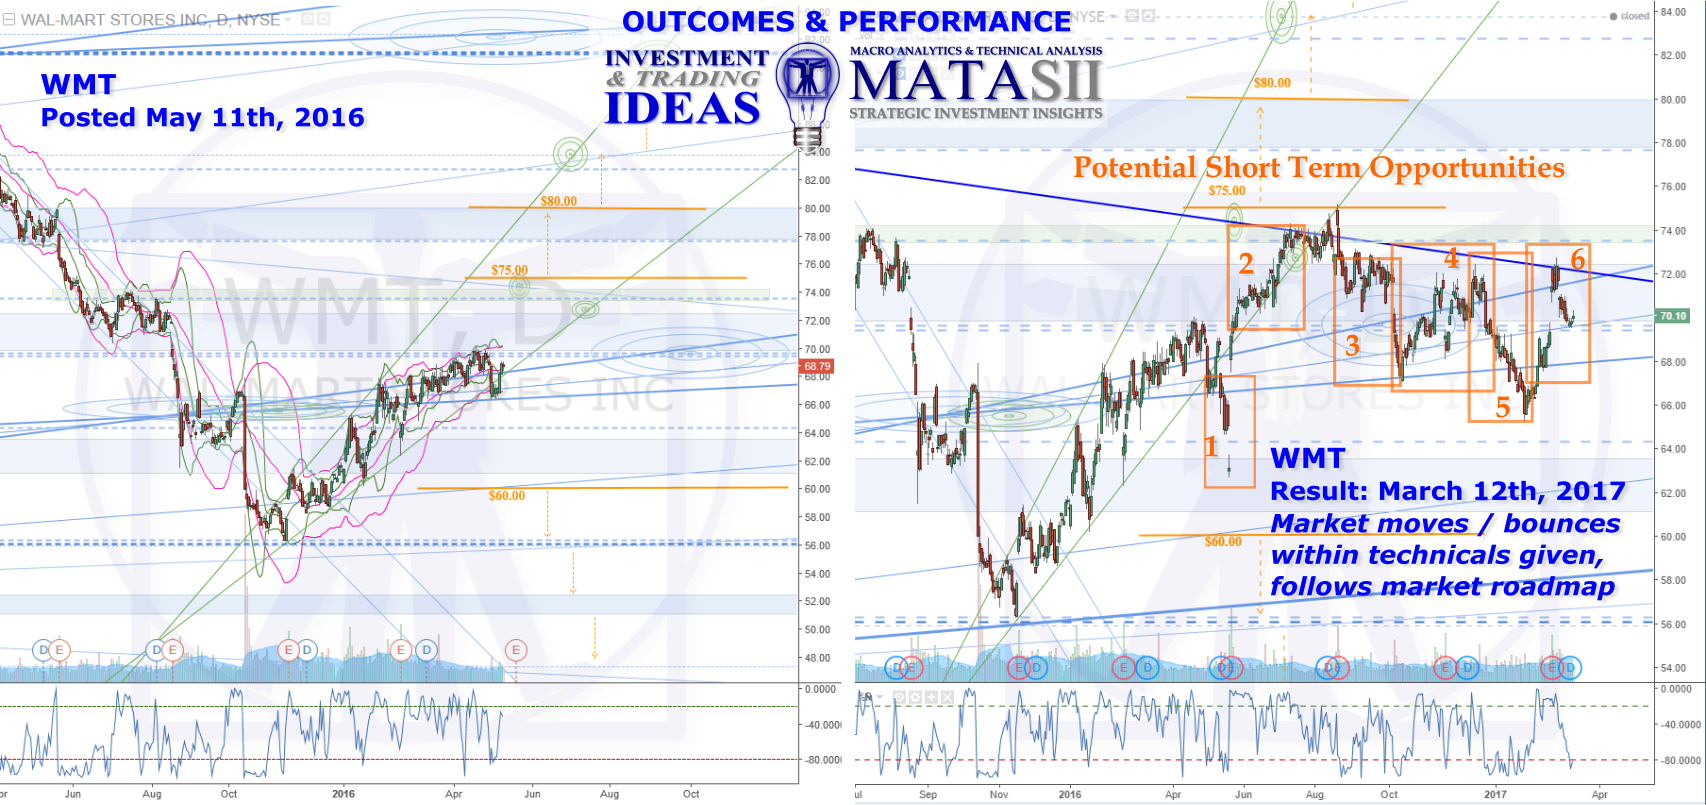
The technicals highlighted represent a break of a longer term structure and could be used in consideration with longer term investment strategies. As the chart on the right hand shows, the road map provided could also be used for shorter term and "swing trade" opportunities.
The overall method (short or long term) says that the market will move from one technical to another; bounce off of and/or break through technicals, moving to the next, up or down. It also provides potential targets to look for: these highlight areas of technical confluence that the market has a tendency to move towards.
The orange highlighted areas 1-6 on the right hand chart demonstrate the accuracy and potential use of the market road map provided for shorter term opportunities.
- Market falls out of green expanding wedge pattern it has been lifting in, and drops below solid blue weekly trend line support (technical trigger considerations). There was only one day however to make the decision to get out at the low once the market had dropped in to the blue s/r zone. Just above that however, there were a couple of days the market sat at the blue dashed Fib levels that could have been used.
- If you had taken that opportunity, but failed to get out at the next technicals, a gap up would have caused a little pain, but opportunity existed to get out just above the previous technical breaks. It then continues to lift, and at the bottom of area 2 we can see several days where a break in to the bottom of the blue s/r zone (and over the blue dashed Fib levels) offered potential opportunities. The market then lifts and moves over slightly, finding support from the green wedge pattern and lifts again: up through the blue s/t zone, in to the green s/r zone, finds resistance at the blue weekly trend line and hits the green daily target given 2 months prior.
- WMT then consolidates at the blue s/r line, green s/r zone, on top of the blue s/r zone, and retests the green wedge pattern. Note that where it retests the green wedge pattern is also at the same level indicated (orange highlight) for a technical consideration on further lift. The market however holds and never breaks up above the long term technical trigger consideration. It does fall off from the blue s/r line and back in to the blue s/r zone where it tests this several times before falling again, back to the same blue trend s/r that was discussed as a potential trigger consideration for area 1.
- The blue s/r line holds, the market finds support and starts to lift. Very close and just above the blue support the market bounces from, another blue s/r can be seen where the market briefly consolidates (technical opportunity) and then lifts back to the top of the blue s/r zone. We then see some volatility as WMT bounces around inside the blue s/r zone and trend lines, offering opportunity every time the market reached the top area of the the blue s/r zone, ultimately coming just shy of the long term blue resistance also seen at 2.
- WMT falls off once again from the top blue s/r line resistance, back down to previous lows and the blue s/r support line from 1 & 3. This support is consolidated around and broken to the downside. The drop fails to reach the next lower technical level and lifts back to the blue s/r line that was just broken through. Had this opportunity been taken it would have failed, however slippage could be minimal with lots of opportunity to get out where you may have gotten in, as the market found support once again inside the previous pattern support.
- Market lifts from blue s/r line (bottom pattern support) back once again to the top blue s/r trend line pattern resistance.
While the areas 1-6 and all the technicals that were contained within were not highlighted with orange, you can see how they can still be used to facilitate potential trade opportunities. Note that the original posting date of the chart was May 11th, 2016, and for the next 10 months (till the time of this current post) the market has followed the technicals given very well. With the exception of the bottom at area 5, all the turns, twists and consolidations from the market occur at and bouncing between the technicals given.
The HPTZ method uses several different technical techniques to locate areas of technical confluence, in doing so it identifies the significant market supports and resistances, patterns, etc. providing a detailed and accurate market road map that can be use as the backbone for any trading or investment strategies. While not all the technicals are highlighted as potential trigger considerations (only the significant, larger, longer term are for break outs), all the technicals on the chart can be used in this manner, with a reasonable expectation that a move to the next technical is likely to occur. Of course, past is no guarantee of future, and there is always risk; however the chart does offer evidence that it can also repeat and respect past levels and technicals very well. The issue is, will it do so again THIS TIME? 🙂
Good Trading!