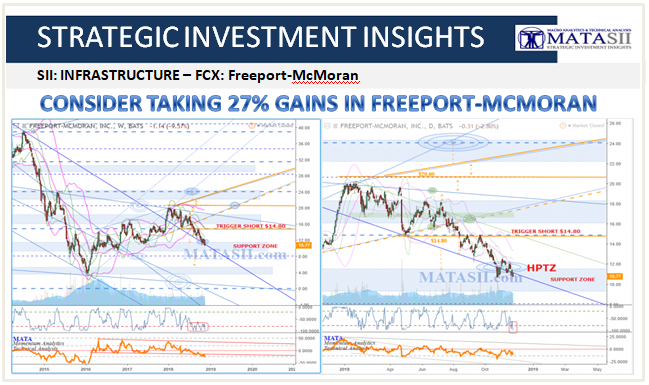
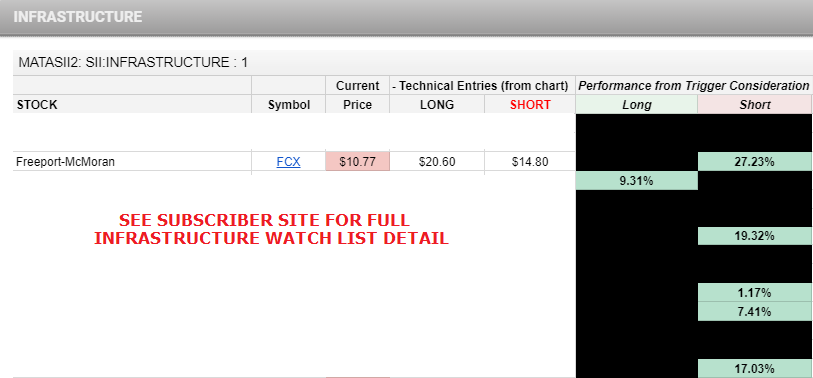
CONSIDER TAKING 27% MATASII GAINS IN FREEPORT-McMORAN
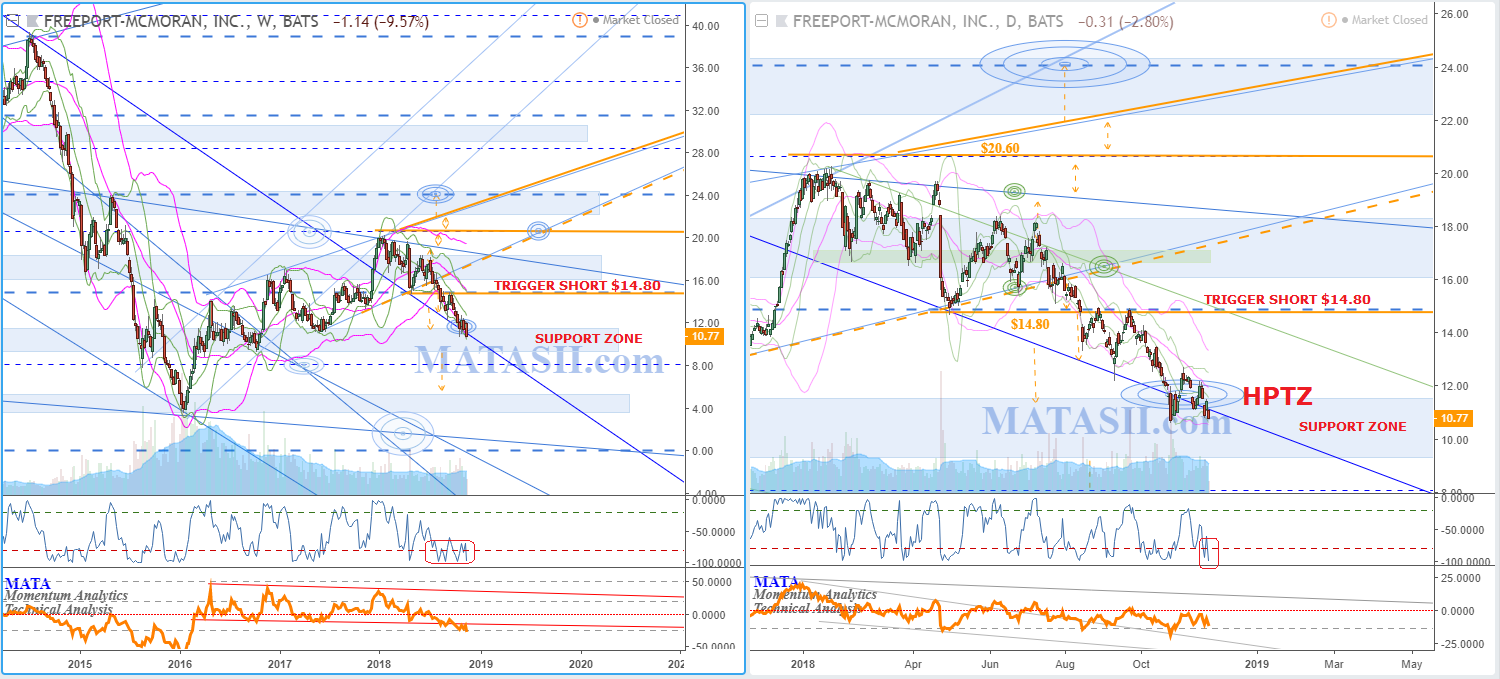
FCX CHART AS OF CLOSE 11-23-18
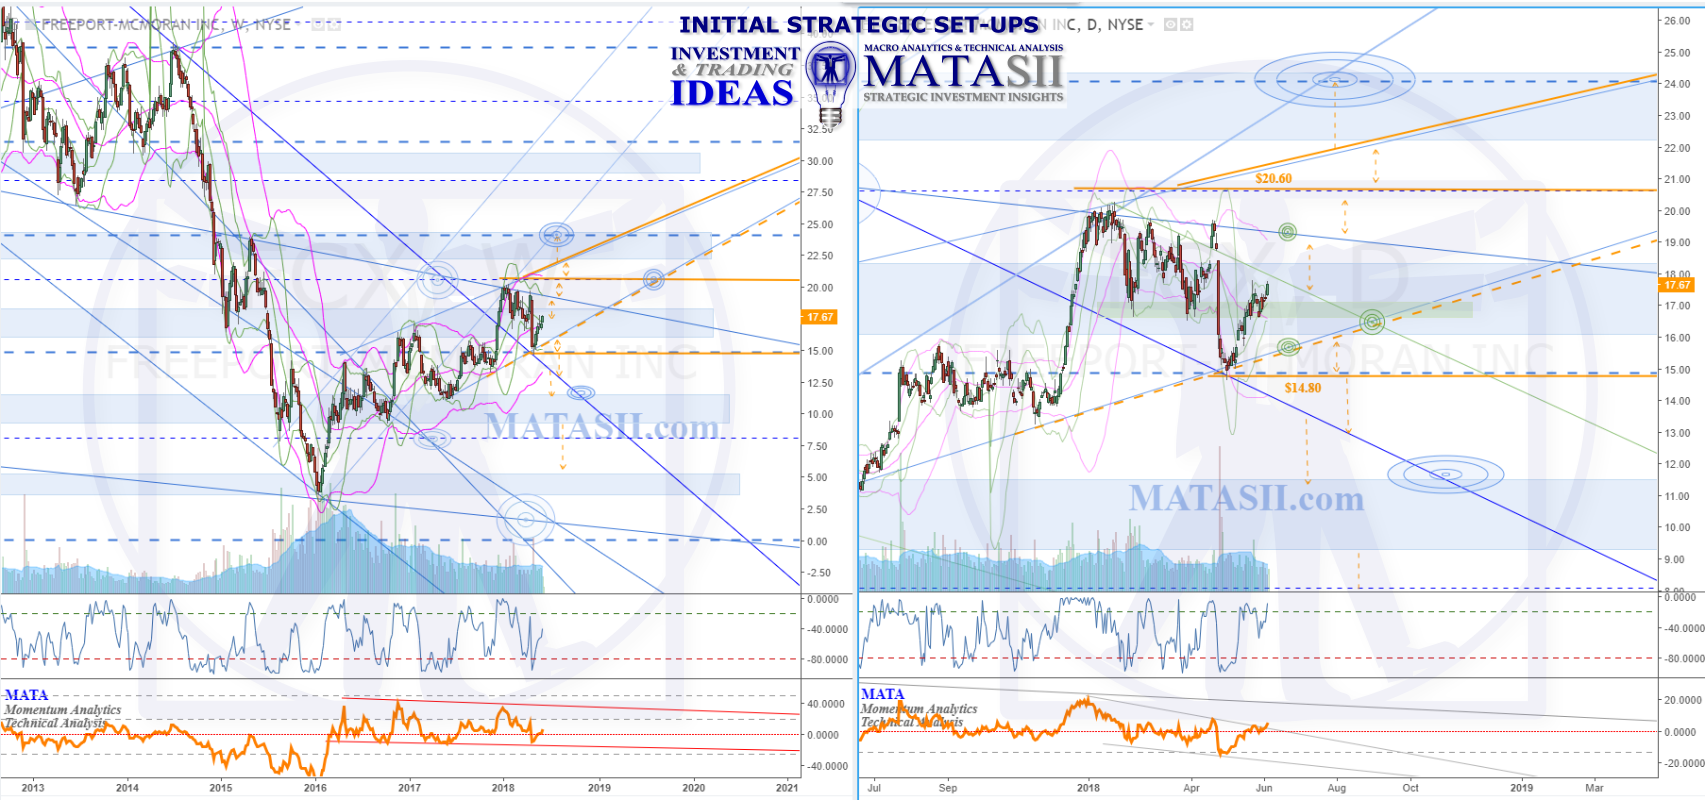
INITIAL FCX Freeport-McMoran IDEA: June 5th, 2018
Bouncing from lows seen on the weekly chart (left) in 2016, FCX broke out of a long term down channel (blue, weekly). The market has recently tested the channel (May 2018, daily chart right) and bounced from it.
Overall we are watching to see if FCX will continue to show strength and move from the long term weekly channel recently broken out of. Several technicals above the market offer potential trigger considerations if moved over, two in particular have been highlighted with solid orange. The Fibonacci level at $20.60 that is just over previous highs has been marked, along with the resistance from the current lift. Lifting up through these could indicate a strong up-trend and more lift to go.
The support for the current lift has been highlighted with dashed orange, indicating more risk than the solid orange $14.80 level.