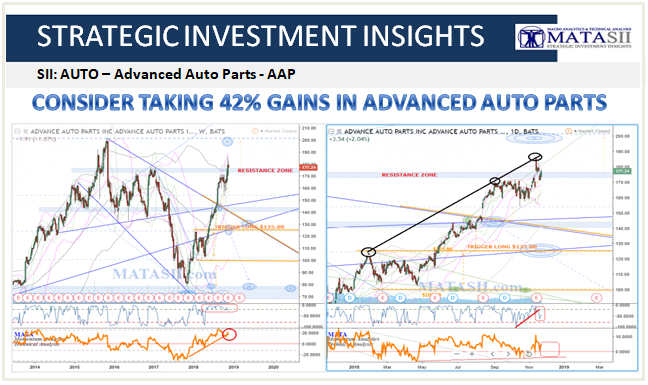
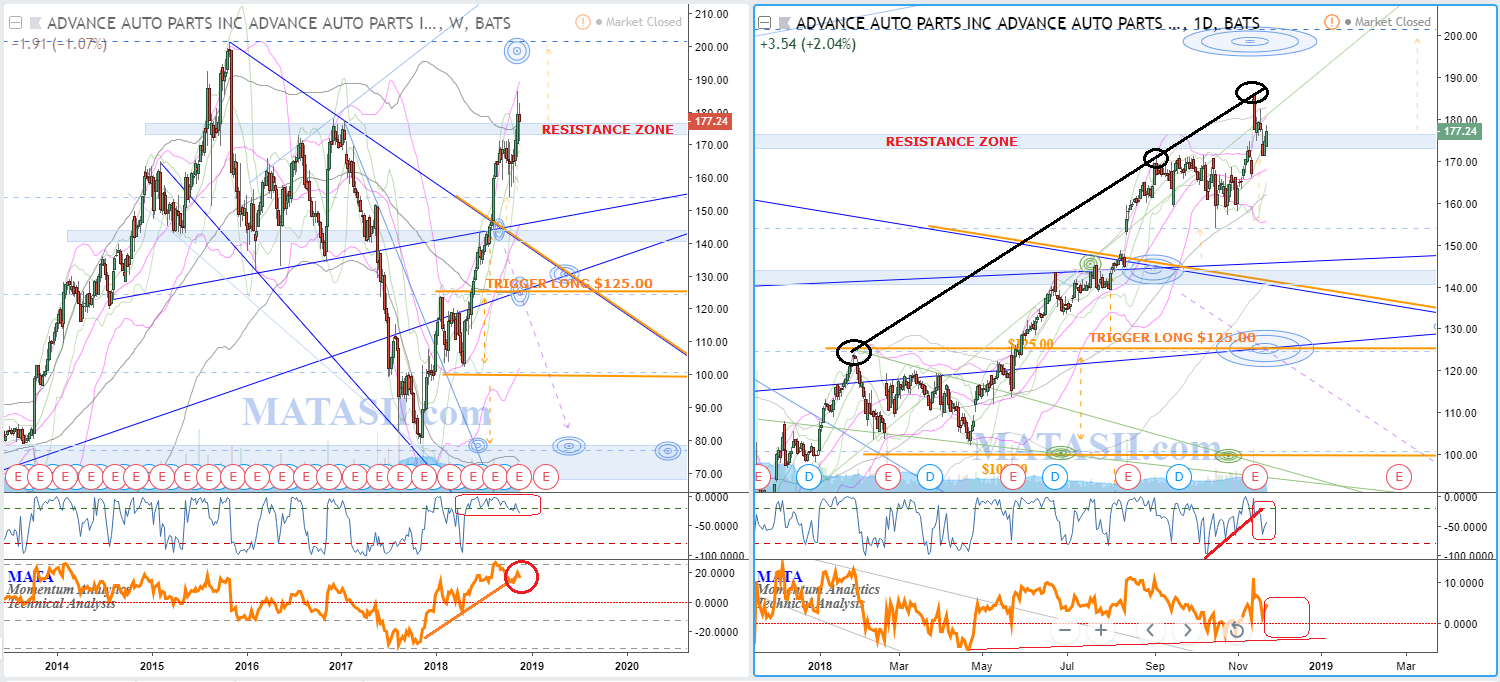
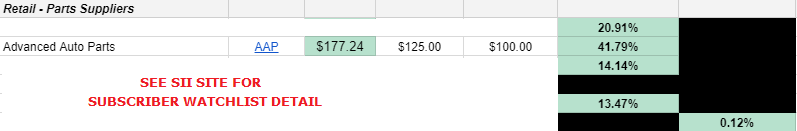
CONSIDER TAKING 42% MATASII GAINS IN ADVANCED AUTO PARTS
AAP CHART AS OF CLOSE 11-23-18
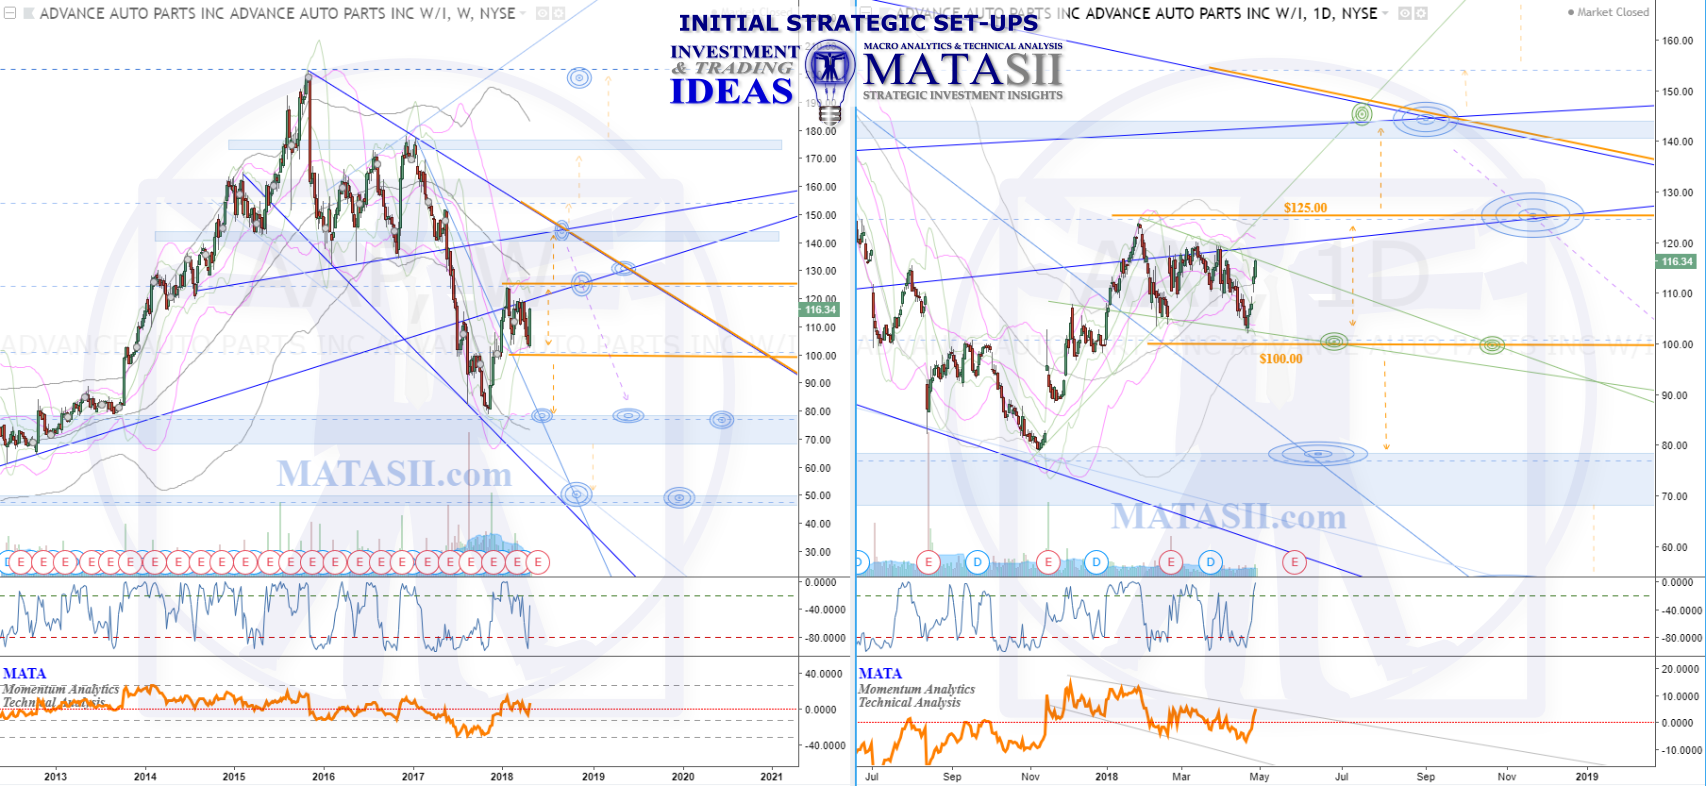
INITIAL AAP Advance Auto Parts IDEA: April 29th, 2018
A large expanding wedge can be seen for the drop off since the 2015 highs, with the market currently sitting about halfway inside it (weekly chart left). On the daily chart (right) we can see the market consolidating since the end of Jan this year; two orange highlighted levels mark the highs and lows for the consolidation as well as Fibonacci levels ($125 $ $100).
The lift we can see on the daily chart from Nov.2017 - Jan.2018 could again be repeated once the current consolidation has completed: this would take the market back up to the blue weekly resistance of the expanding wedge pattern. From there we could see resistance and then another significant drop to continue the wedge pattern. A dashed purple arrow highlights this possibility and should be watched if the market lifts out of the current consolidation. IF we were to see further lift and a break up out if weekly expanding wedge pattern then we would be looking to previous high levels.
IF resistance is found and the market drops we would be looking to previous lows and the next two blue s/r zones for possible target levels and market reactions.