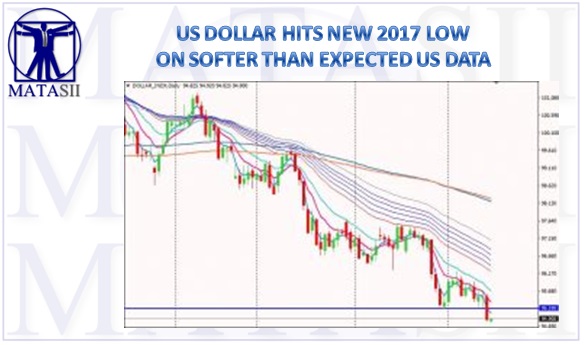
DOLLAR HITS A NEW 2017 LOW ON SOFTER THAN EXPECTED US DATA
Summary:
- The greenback slipped to a new low this year after bad U.S. economic releases.
- Gold ended its downtrend since 6, June low as it broke above H4-period EMA60.
- We will get monetary policy decisions both from BOJ and ECB.
U.S. dollar weaken and created a new low for 2017 on Friday as United States retail sales in June decreased by larger-than-expected at -0.2%, its second straight such decrease, while its gauge for consumer-price changes was at 1.6% which was lower than both previous reading (+1.9%) and the consensus (+1.7%), the fourth decrease for its CPI growth as well. The Dollar Index (DXY) dived and remained downward pressures. The non-U.S. currencies and gold, in the contrary, got a boost and recovered.
Technical
The dollar extended its downtrend of the year further after hitting a new low for 2017. Its short-term and long-term moving averages both diverged magnificently with bearish bias, indicating its downtrend still in the process. The dollar could consolidate its losses in the short term after dipped below its psychological level at 95.

Let’s look at non-U.S. currencies. Euro received a boost Friday, however, it could form a short-term top pattern if its failure to reach a new height last week led to a retracement and continued to fell back. The sterling jumped and broke above its weekly-period EMA60 resistance and a new high from its rally as well. It could extend its uptrend further this week. The commodity-link currency Aussie continued its uptrend and broke above 0.78 figure after rising sharply. Watch out potential retracement given its large and up-to 250 pips increases.

As to precious metals, gold rose straightly and smashed its major trend line resistance on its 4 hour chart. Its short term moving averages crossed above its long-term moving averages while kept the latter interacting with each other quickly and turning higher as well. Its trend has turned bullish as told by its 4 hour chart and keep an eye on its resistance around EMA169.
