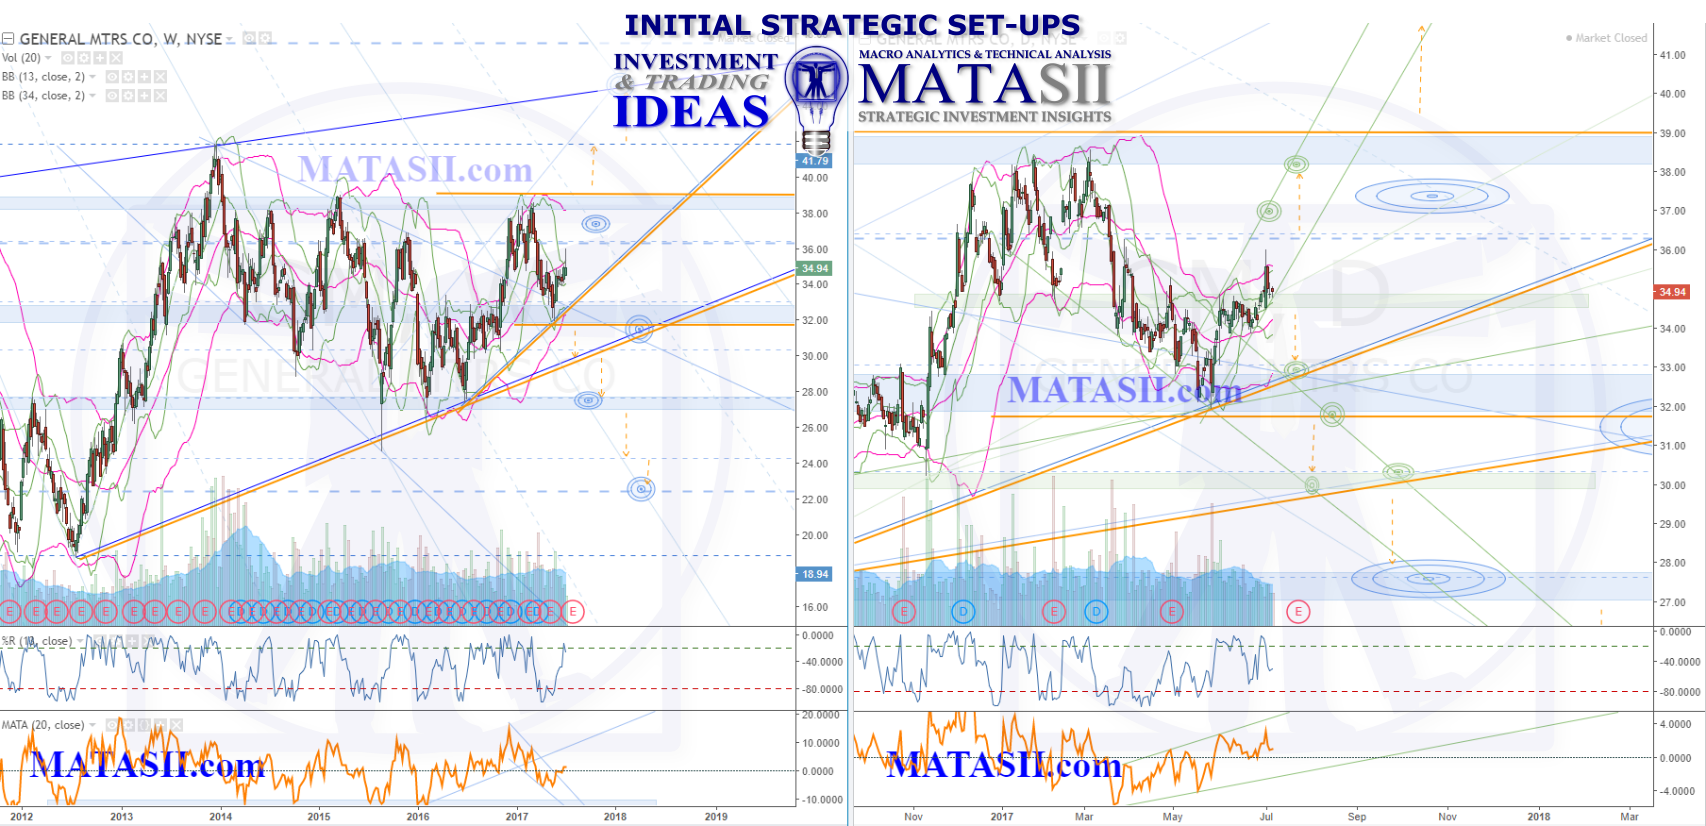
After reaching a high of almost $42.00 at the end of 2013, GM has shown some volatility, falling off and retesting the $38-39 level several times (on the high end) while finding support around $27. Three blue s/r zones can be seen to make channels offering potnetial opportunities as the market bounces off or moves across them. Solid orange lines highlight significant technicals to be aware of: these can offer potential opportunities when broken or bounced off of. Orange dashed arrows highlight potential moves from technical to technical.
Overall we can see a couple of possibilities for GM: The long term weekly chart looks like a contracting wedge with the market most recently lifting off the pattern support. IF the lift continues then technically we could see a move back to the weekly wedge resistance (potentially around $45.20). There is strong resistance around $38-39 (blue s/r zone) and this needs to be broken through first. IF resistance is found and GM starts to head lower, a drop to the next lower blue s/r zone and previous lows ($27.75) would be technically reasonable. Previous lows on the weekly chart around $19.00 are also not unreasonable should we see significant supports continue to fail.

