IN-DEPTH: TRANSCRIPTION - LONGWave - JULY 2019 - SII UPDATE: 2nd HALF 2019
COVER
Thank you for joining me. I'm Gord Long.
A REMINDER BEFORE WE BEGIN: DO NO NOT TRADE FROM ANY OF THESE SLIDES - they are COMMENTARY for educational and discussions purposes ONLY.
Always consult a professional financial advisor before making any investment decisions.

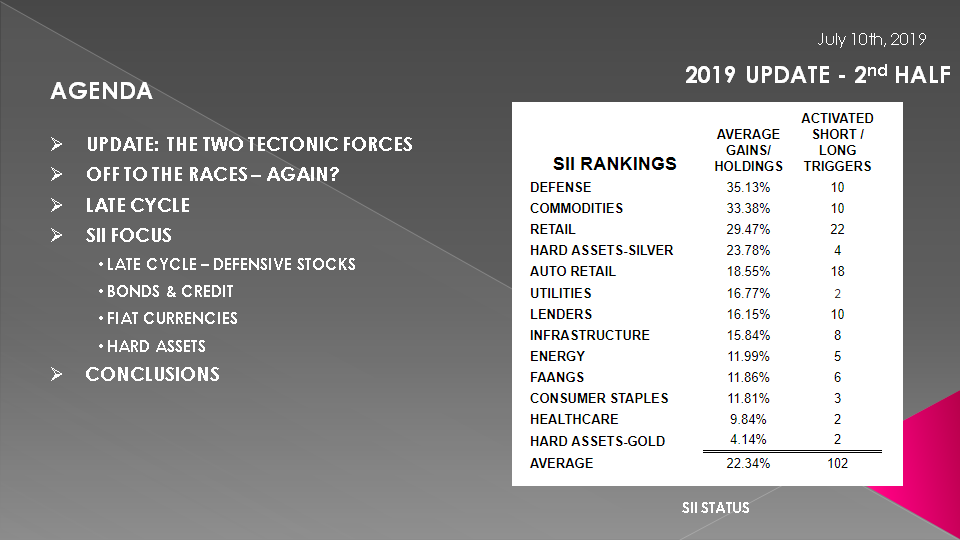
AGENDA
In this Month’s LONGWave video I would like to update our Strategic Investment Insights or SII's activities and our current thinking.
As such I would like to cover those items listed here.
SLIDE 5
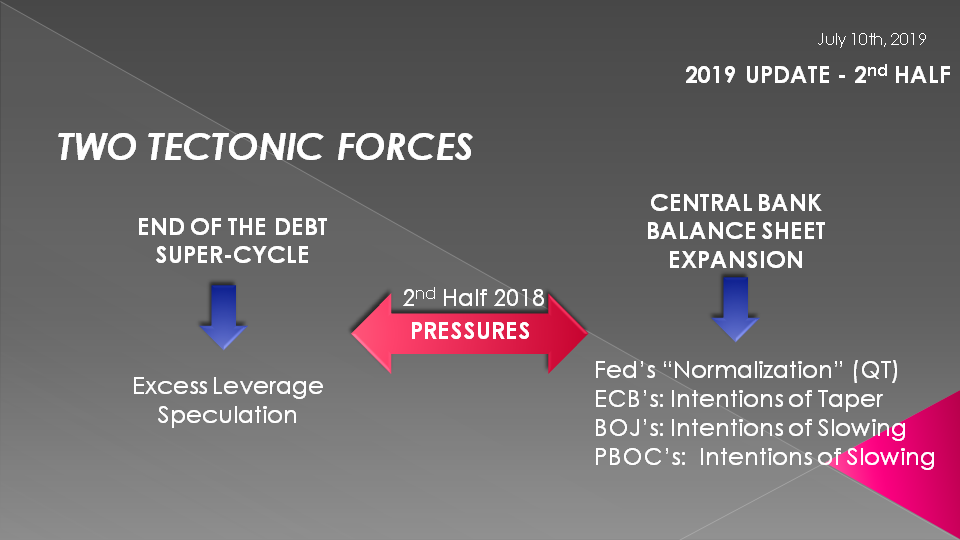
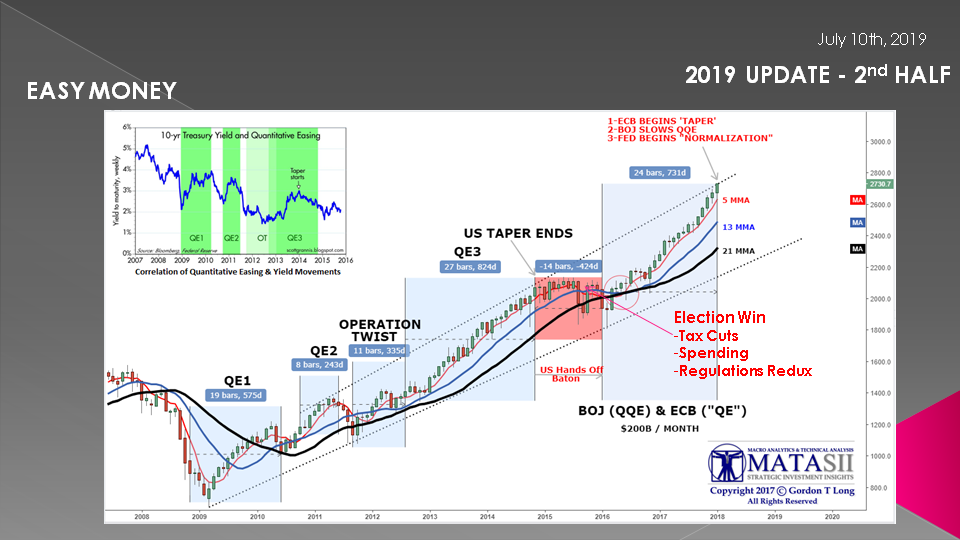
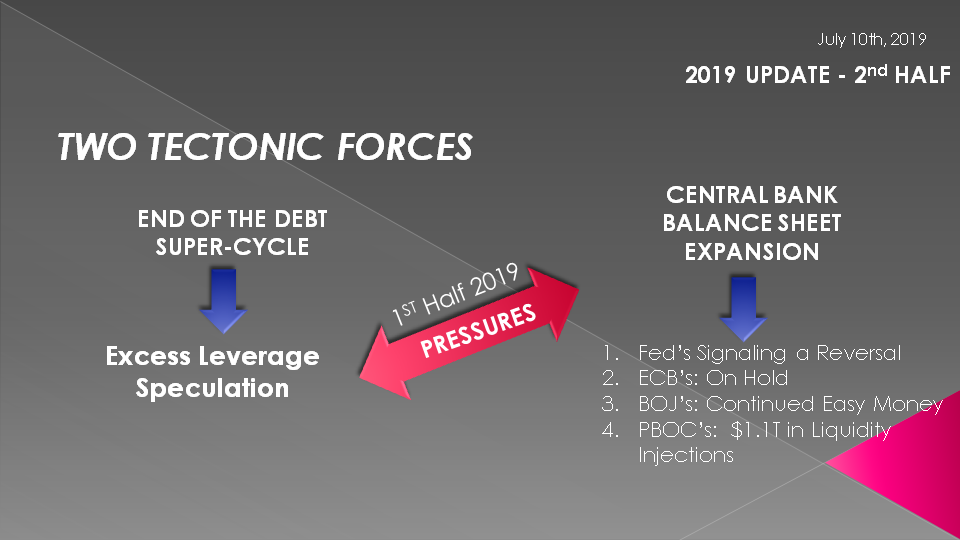
Since we began presenting SII Updates we have discussed the two Tectonic Forces at play in the markets. The Natural force of the End to the Debt Super-Cycle versus the managed monetary actions of the Global Central Banks.
In 2018 the central banks took their foot off the accelerator with:
- The Fed’s “Normalization” program of its Balance Sheet or Quantitative Tightening,
- The Fed’s going on “pause” with regard to its Fed Fund Rate Increases,
- The ECB’s stating its intentions of “Tapering” it's Monetary Policies,
- The BOJ’s intentions of slowing the rate of increasing easy money, and
- The PBOC indicating its intentions of slowing its liquidity injections.
SLIDE 6
As the red labeling at the top of this chart shows the markets were starting to go parabolic and clearly had disconnected from historic valuation metrics.
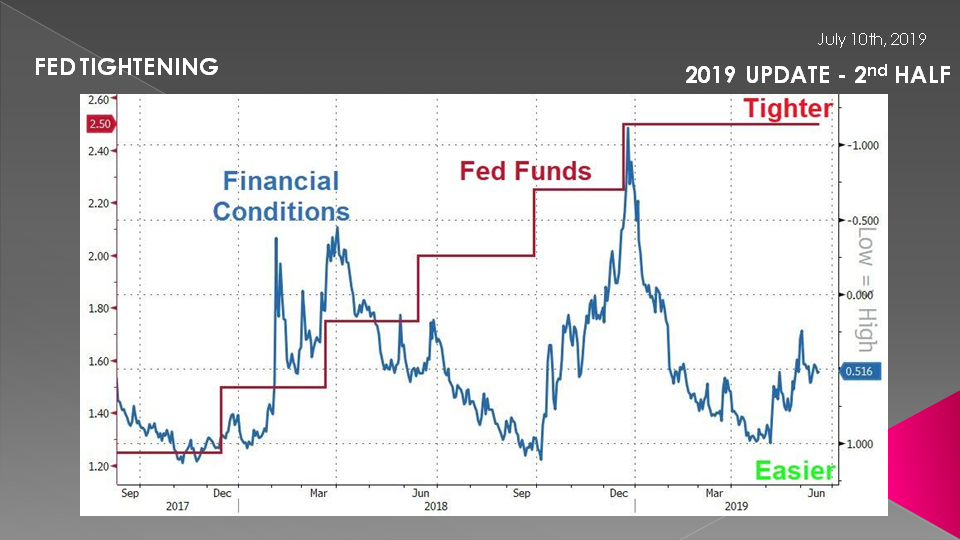
SLIDE 7
The Fed Funds Rate shown in red was halted, with the last increase in December 2018 when the markets reacted violently leading to the Treasury Secretary’s “Mnuchin Massacre” on Christmas Eve when it was rumored he was forced to call in the infamous PPT (Plunge Protection Team).
The Federal Reserve's Fed Funds Rate had reached the upper bound of rate increases which usually is signaled by an unpopular market adjustment. Since the Fed always follows the 2 year Treasury Bill market (which was falling in yield) it was clear to the financial community that this was the end of this tightening cycle.
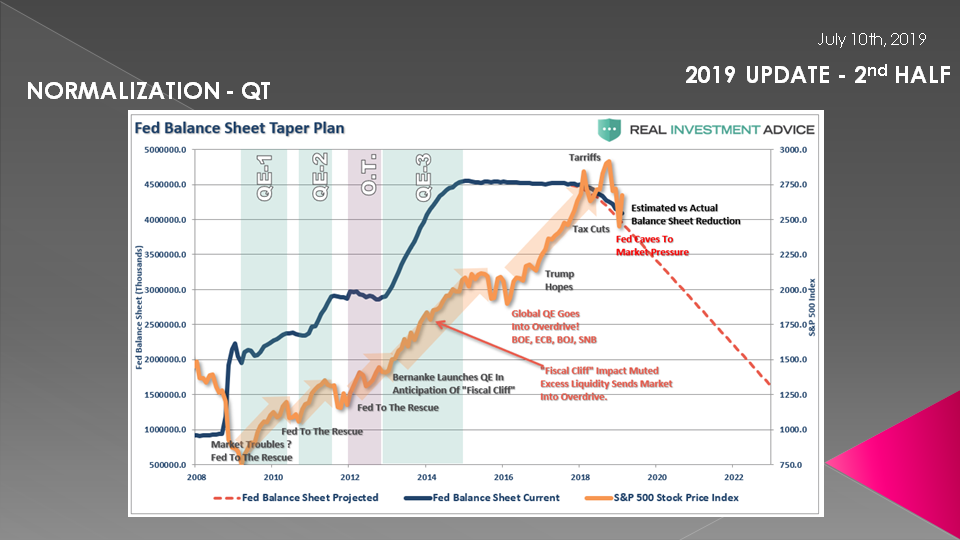
SLIDE 8
The Fed’s Quantitative Tightening or Balance Sheet “Normalization” program was only just beginning to take effect (shown here in Black) but the reduced global dollar liquidity was being felt and abruptly came home to roost like a sledge hammer in Q4 2018.
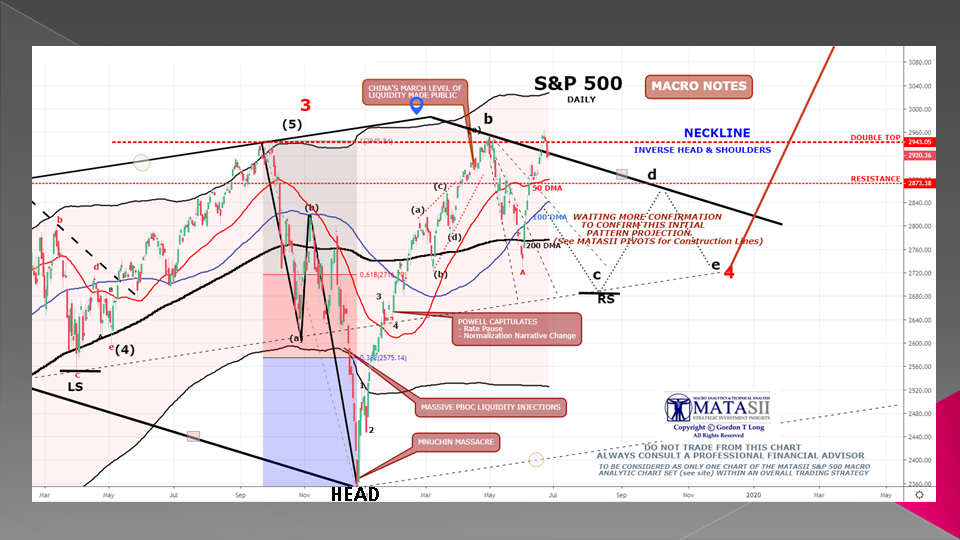
SLIDE 9
This chart particular S&P 500 chart you have seen continuously since we started posting it in 2018. It shows our expectations for a Head & Shoulders pattern with a neckline completion at “a” in black at the bottom of the chart. We didn’t get the typical “W” bottom we expected but we were extremely close in price and time with a bottom price print as part of our expected January Quadruple Witch. Our Right Shoulder also was also pretty well right on ....
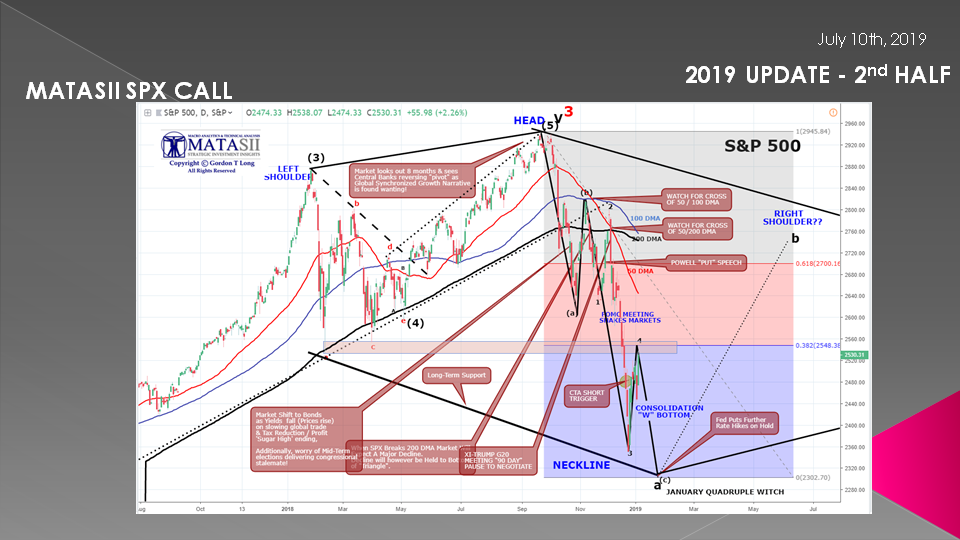
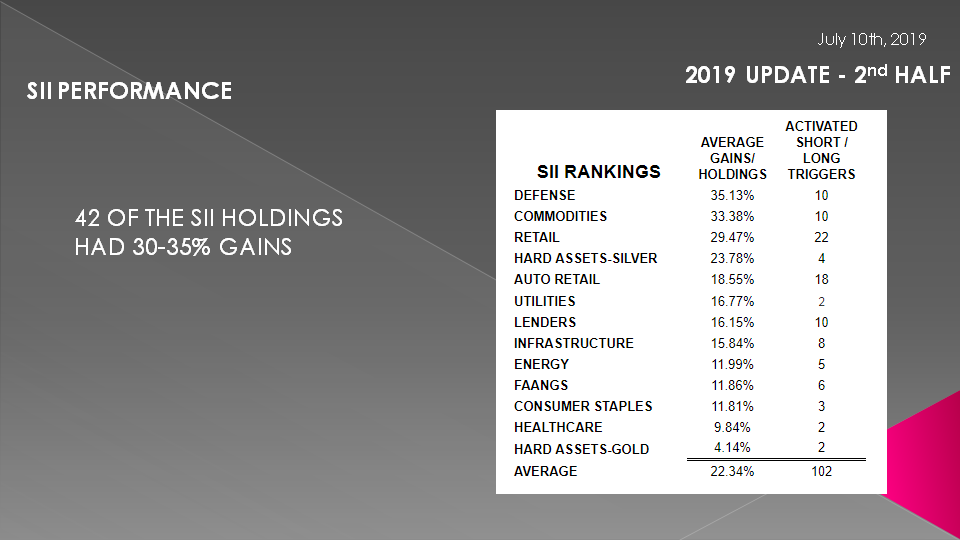
SLIDE 10
.... and as a consequence our SII performance has reflected this in first half of 2019.
SLIDE 11
What happened is the Central Banks once again took control with:
- The Federal Reserve halting any further Rate Increases and Reversing it Tightening Policy guidance,
- The ECB’s guidance of “Tapering” was put on hold,
- The BOJ’s continued its easy money policy and in fact increased it,
- A critically important catalyst was the PBOC’s sudden injection of an initial $1.1T in Liquidity Injections
We were off to the races again.
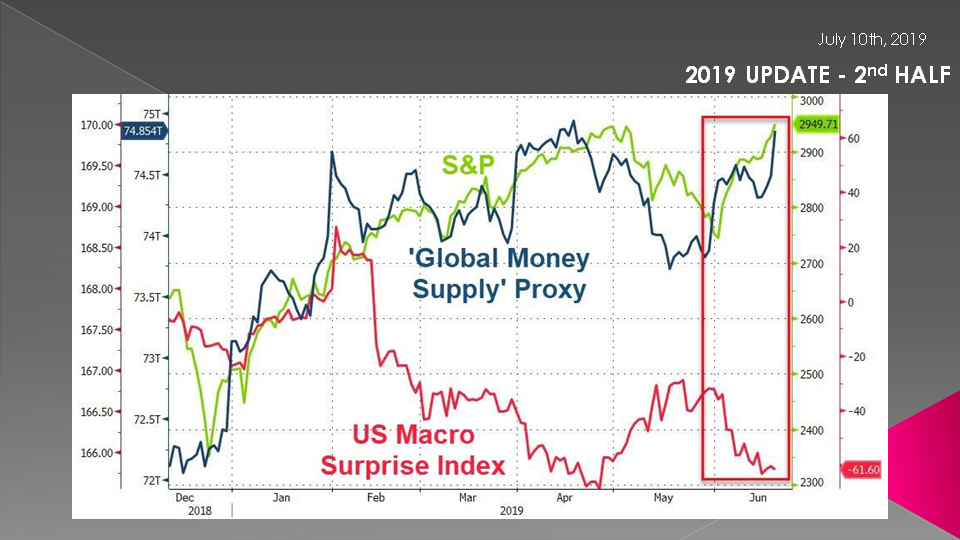
SLIDE 12
You can see that the dramatic increase in Global Money Supply directly correlates with the lift in the S&P 500 and overall equity markets.
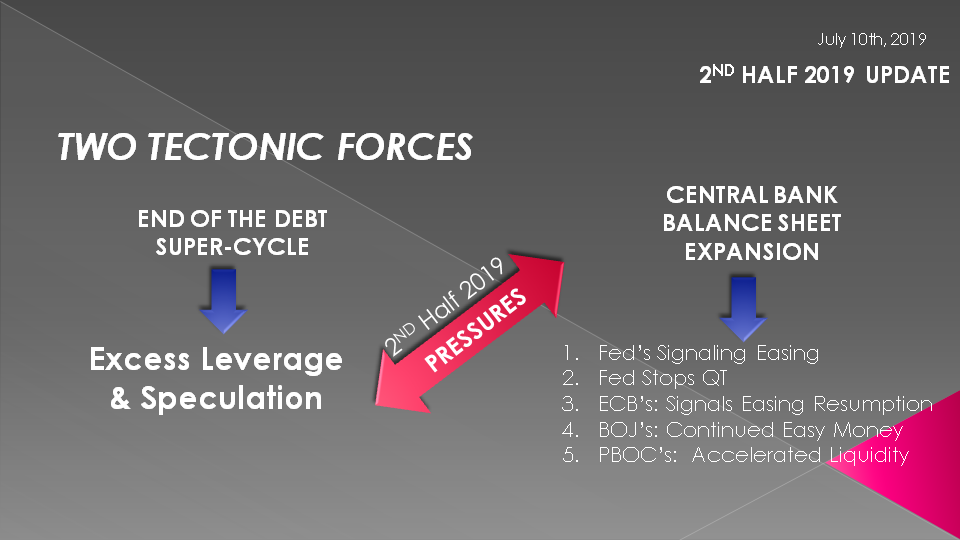
SLIDE 13
Since then we have seen further policies of financial easing:
- The Fed has Signaled Easing and Rate cuts from simply halting rate increases,
- They now plan to halt QT in September,
- The ECB is Signaling the resumption Policy Easing'
- The BOJ’s has continued Easy Money and is considering new ways of increasing it,
- The PBOC’s has further accelerated its targeted liquidity injections.
SLIDE 14
Subsequently the SPX delivered our Right Shoulder and EVEN more. In fact it delivered a Double Top.
As a consequence what has happened is our Head & Shoulders pattern has POTENTIALLY been inverted and we COULD now have THE POSSIBILITY of an inverse Head and Shoulders emerging as shown here. This means higher S&P 500 levels after a likely consolidation.
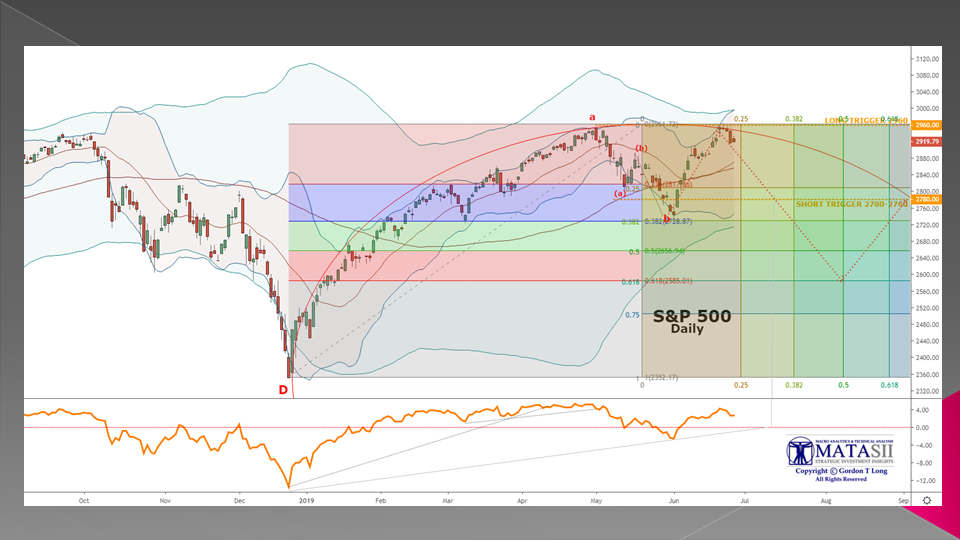
SLIDE 15
This SPX chart was drawn at the red “a” and was part of an SPX subscriber video at MATASII.
We are actually quite surprised how precisely our ‘Elliptical Theory” chart has called the price movements in the SPX since its inception. It has given us a lot of confidence in the potential Inverse Head and Shoulder pattern, which could take the SPX to 3050 to 3200 before a final top is in.
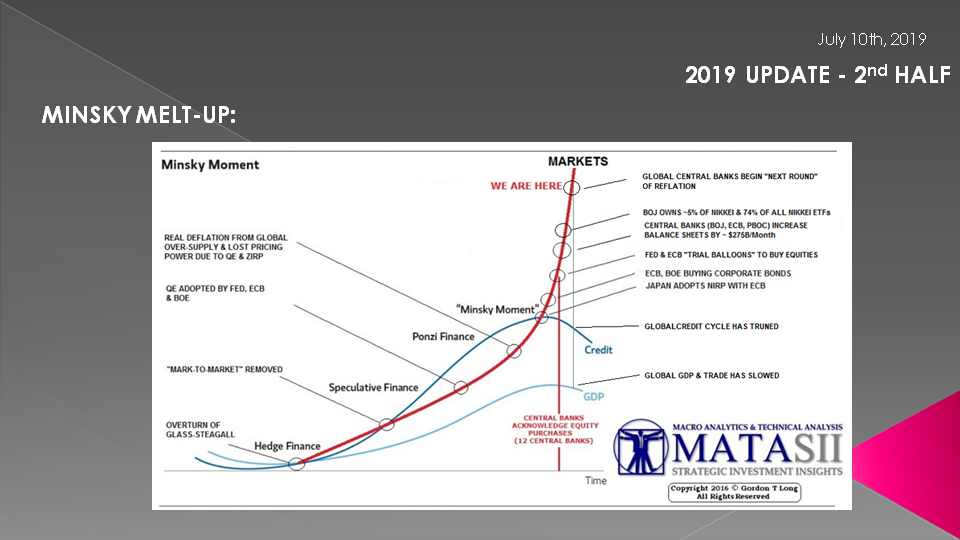
SLIDE 16
What all this translates into is a continuation of our prediction of a Minsky Melt-Up. A chart many of you no doubt are getting tired of us showing - but is still very much in play!
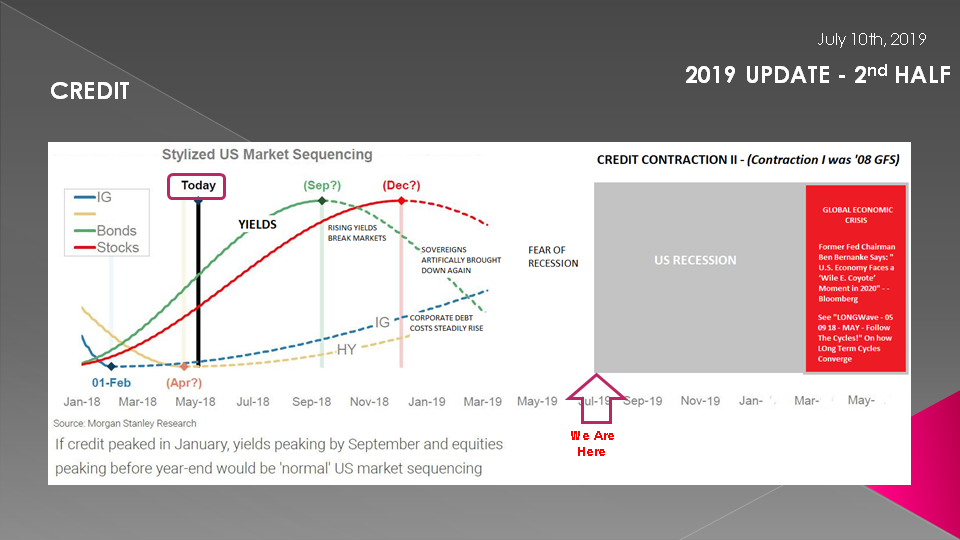
SLIDE 17
We posted this schematic in May of 2018 (marked "Today”). We are now at the red arrow.
We have experienced the actions in both the High Yield sector and Treasury Yield's predicted.
The yield curve is now inverted and there is a strong evidence that a recession is very close.
Though this chart has been amazingly accurate to-date, it is now potentially misleading because of the degree to which the central banks are aggressively reversing monetary policy.
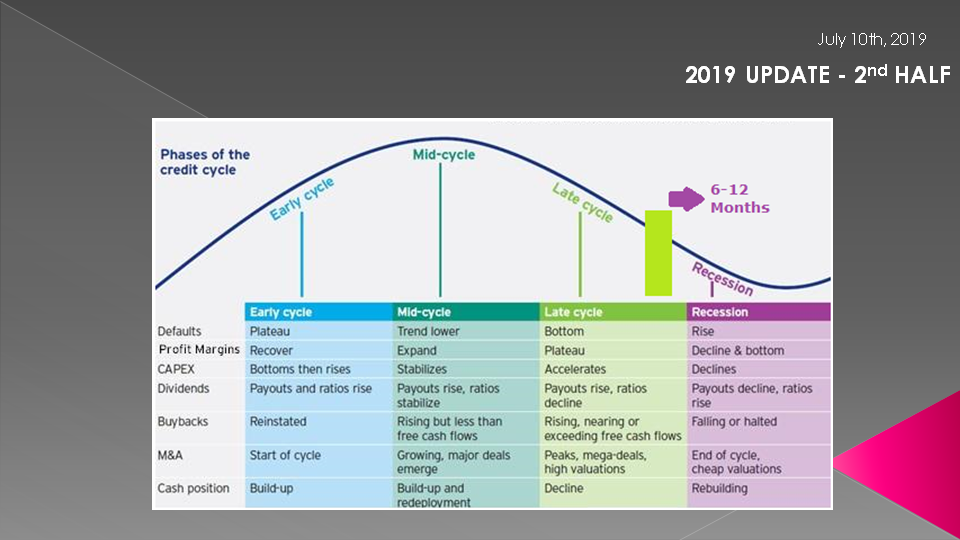
SLIDE 18
Yes, we are in the late stages of the credit cycle.
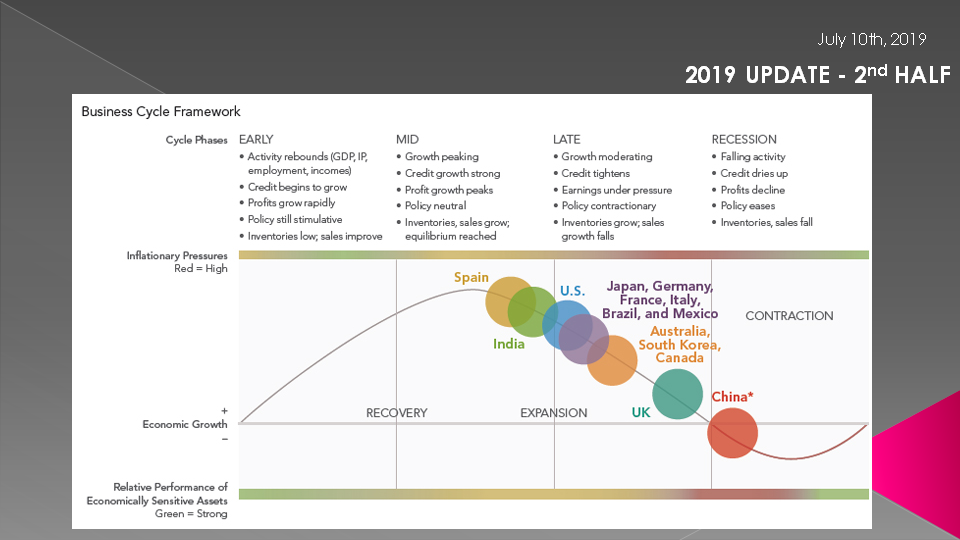
SLIDE 19
Yes, the rest of the world is further along than currently showing in the US in the end of their business cycle!
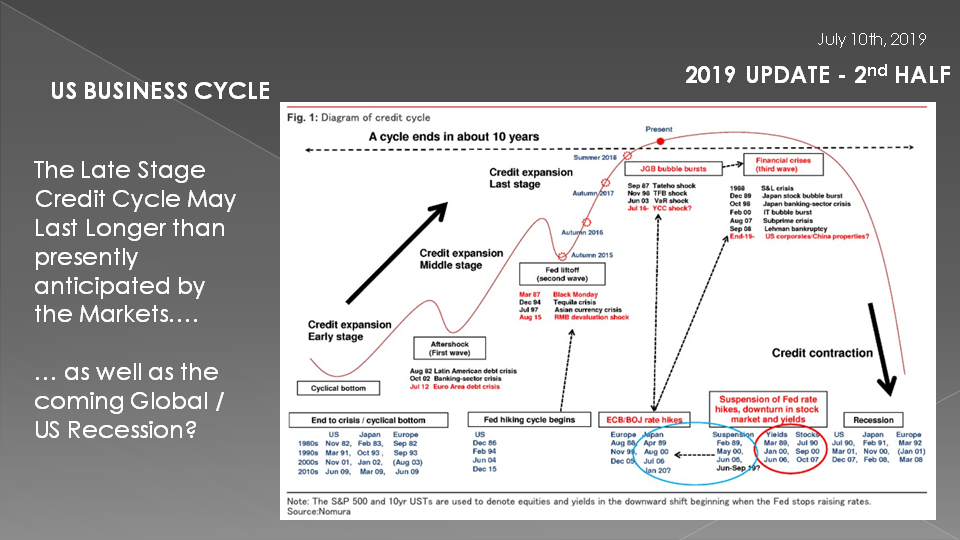
SLIDE 20
However, the Late Stage Credit Cycle may last longer than presently anticipated by the markets if the central bank money spigot is once more opened up to “full throttle”!
Remember however, this will only delay the inevitable and therefore the coming Global / US Recession will only be that much longer and more painful when it does finally occur -- AND YOU CAN BE CERTAIN THAT IT WILL!
SLIDE 21
We will get into the charts that go with the grid shown here in the upcoming UnderTheLens video, but suffice it to say that the next global central bank round of easing will be different – much different!
What the grid shows is the steepening differential that has occurred during prior recessions. We are not talking about the inversion that warns of a recession, but rather what happens during and as the recession ends.
In the Recession of the early 1990’s the 10 Year Treasury Yield dropped 5.5% while the Fed reduced the Fed Funds rate by 3%. This gave the banks 2.5% to work with. We see the Dot-Com Bubble gave the same 2.5% but the 2008 Housing Bust only gave the 1.5% as the Fed reached a Zero bound on the Fed Funds Rate.
In the next recession the Fed Funds Rate will be forced into negative rates. Currently we have globally close to $13T in negative yielding bonds but have not had that situation in America - yet. That will change as the recession unfolds.
Effectively we will be paying banks to take $$ and banks will be charging to hold $$ to large depositors.
There are significant consequences of this since the US$ is the global reserved currency and US Treasury’s are considered the benchmark for risk and the risk free data point. Disruption here simply have unknowable consequences.

SLIDE 22
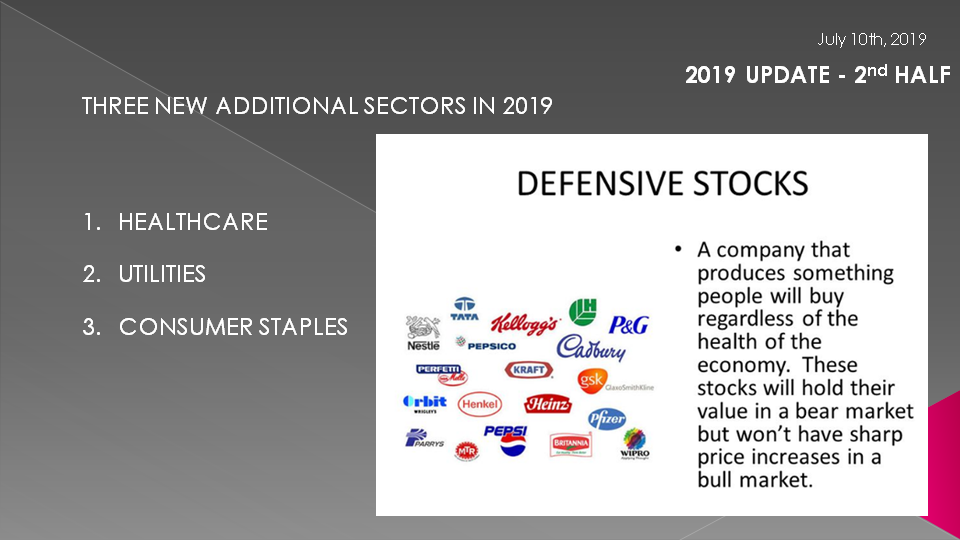
Until this occurs our 150+ SII Watch List and 13 sectors need to be watched closely through our tracking analytics engine for re-positioning and reallocation trends.
We have already witnessed this occurring in three of our late cycle sectors.
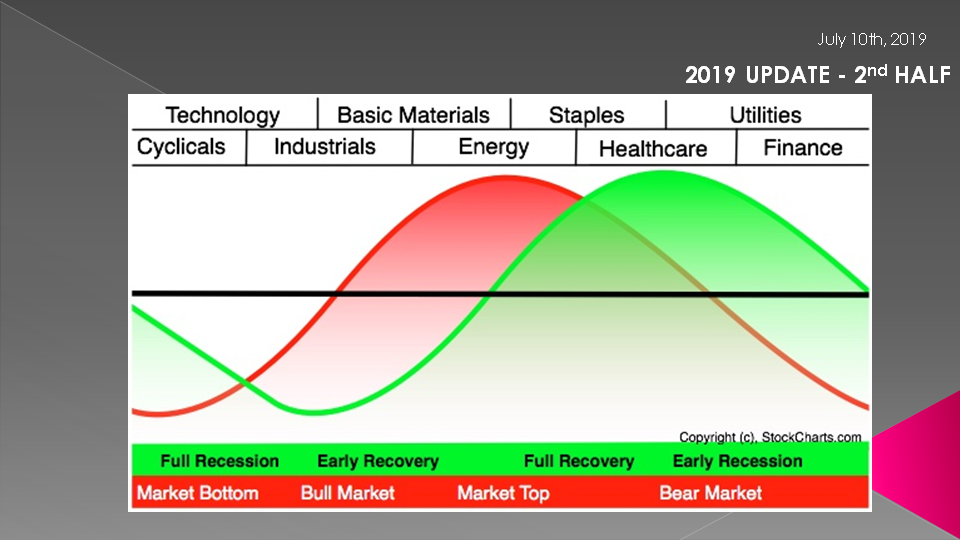
SLIDE 23
Healthcare, Utilities and Consumer Staples have all been steadily performing as more and more funds adjust their allocation mix. We will continue to add to our Watch List for these and other defensive sectors as merited.
SLIDE 24
In the area of Bonds & Credit we fully expect to see Bond Yields fall much further and gains to be made on bond price while locking in yields.
However there are cross currents at play such as a potential trade war inflation shocker, continued “Flight to Safety” and …..
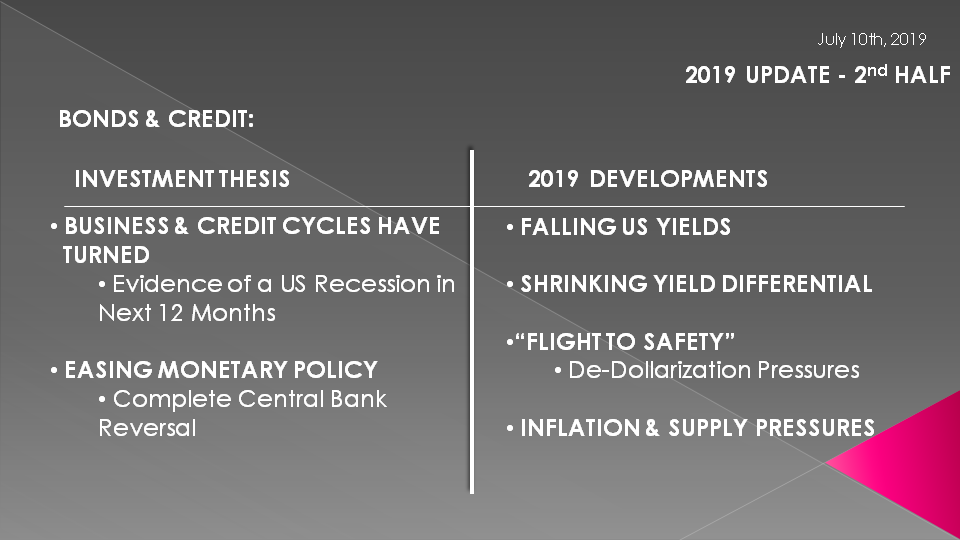
SLIDE 25
…. shifting cross-border yield differentials that need to be watch closely.
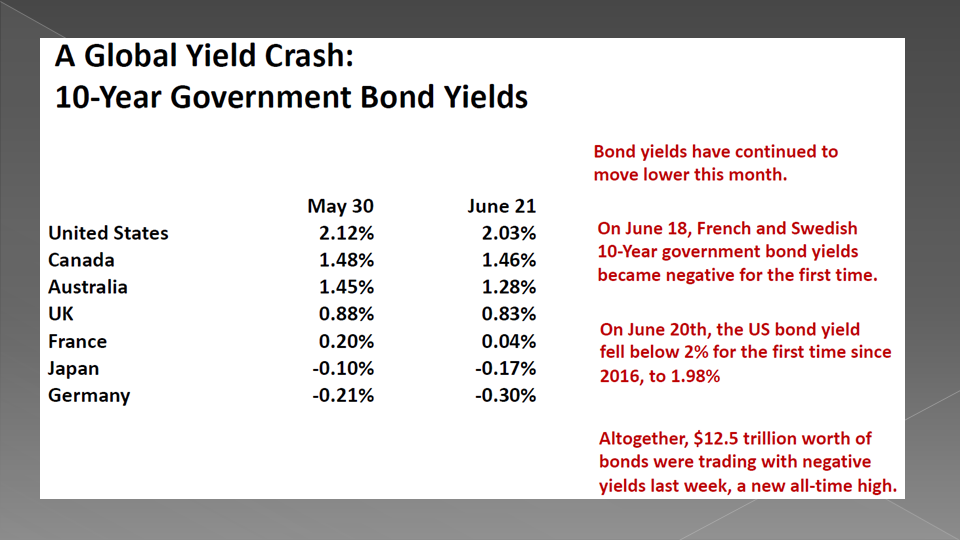
SLIDE 26
We have argued for some time that near term we are likely to see a retracement of the recent drop in treasury yields before attempting to head lower. This is one of the reasons we called 2019 the year of the “Right Shoulder”.
All bets are off on lower long term bond yields if foreign buyers in total continue to reduce both their holdings and rate of buying while US Supply explodes with increasing deficits.
The only way around this for the US will be to sacrifice the dollar!!

SLIDE 27
We expect this to occur.
We are close to a dollar high and likely at the beginning of a steady erosion in the US dollar. We have long believed the dollar would be the last to fall in a massive fiat currency failure but this doesn't mean it won’t be preceded by a steady fall in fiat currencies.
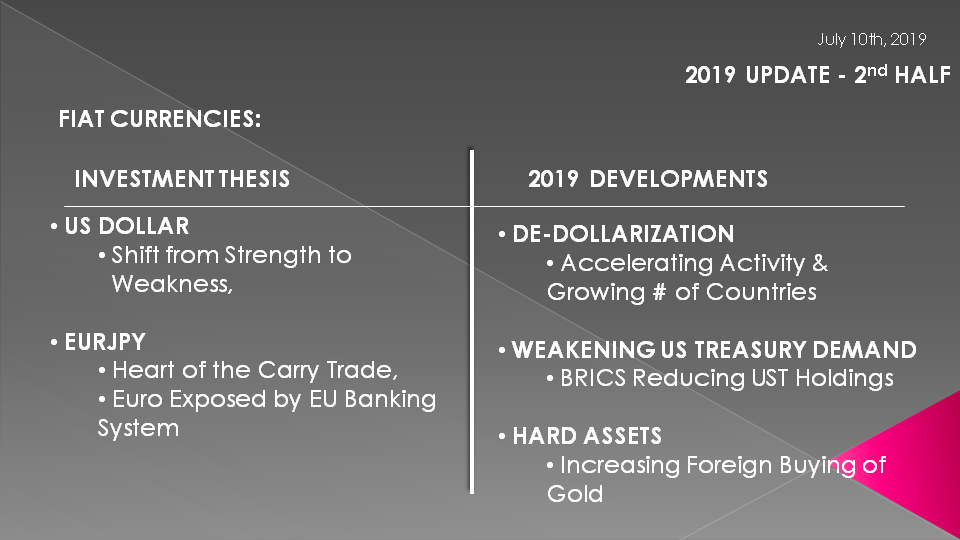
SLIDE 28
Our longer term dollar charts are showing how close we are to a critical inflection point. We have shown both these charts many times previously and since the central bank reversal in Q4 2018 they have only continued to worsen.

SLIDE 29
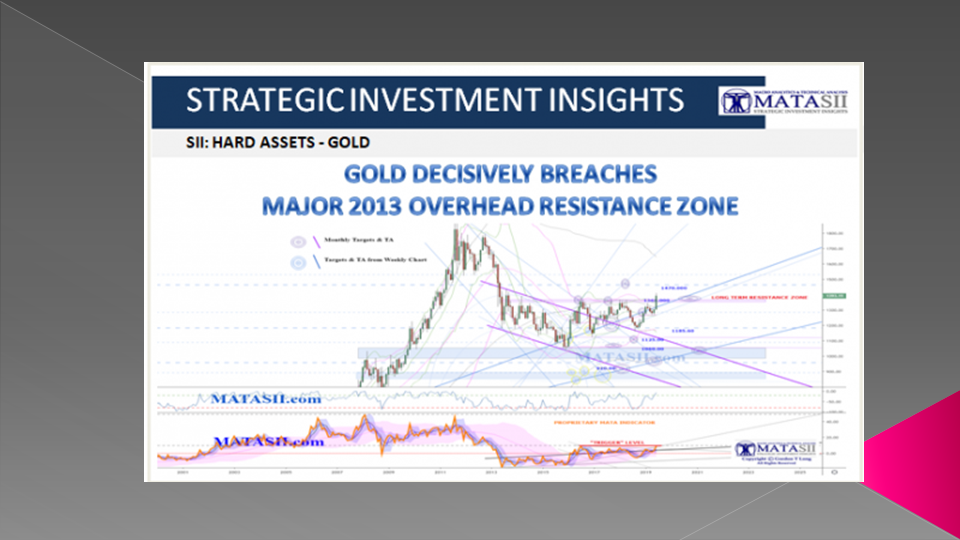
We think this will be positive for Hard assets like Gold, Silver, Platinum, Colored Diamonds etc.

SLIDE 30
We have already broken long term over head resistance in gold which we warned about on numerous posts prior to the recent $160/oz advance.
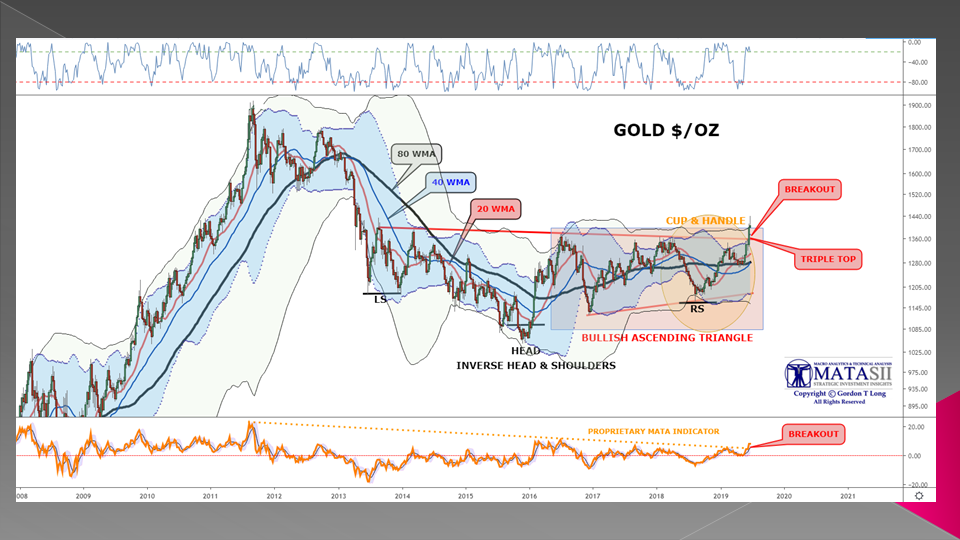
SLIDE 31
The Technicals haven’t been this strong in nearly 10 years….
SLIDE 32
… and the recent performance in our Watch List performance is highlighting this potential opportunity.

SLIDE 33
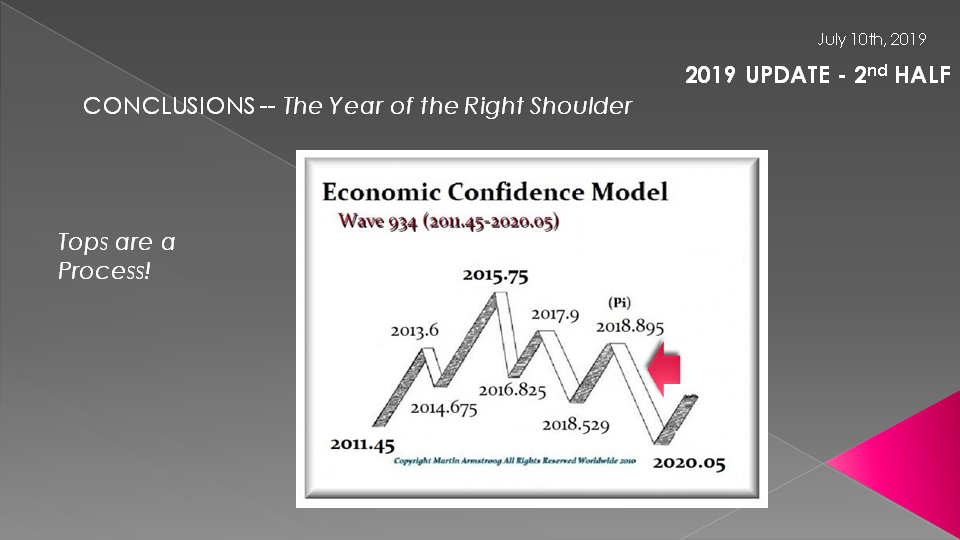
Never forget that tops are a process. The process entails sector rotations not only within equities but within the Bond, Currency, Commodity and Credit markets.
The next recession is going to be challenge so get a strategy in place now!
SLIDE 34
As I always remind you in these videos, remember politicians and Central Banks will print the money to solve any and all problems, until such time as no one will take the money or it is of no value.
That day is still in the future so take advantage of the opportunities as they currently exist.
Investing is always easier when you know with relative certainty how the powers to be will react. Your chances of success go up dramatically.
The powers to be are now effectively trapped by policies of unsound money and fiat currencies.

SLIDE 35
I would like take a moment as a reminder: DO NO NOT TRADE FROM ANY OF THESE SLIDES - they are for educational and discussions purposes ONLY.
Thank you for listening and until next month may 2019 be an outstanding investment year for you and your family.