IN-DEPTH: TRANSCRIPTION - US UPDATE - JULY 2019
COVER
It is Wednesday June 26th, 2019 I'm Gord Long.
As is normally the case, we have a lot of charts for us to go through, so therefore we will pass over some of them quickly BUT leave you to examine them further at your leisure.
You will need to open your viewer to full screen viewing or you will not be able to see some of the detail I will be discussing in the charts.
A REMINDER BEFORE WE BEGIN: DO NO NOT TRADE FROM ANY OF THESE SLIDES - they are for educational and discussions purposes ONLY.
AGENDA
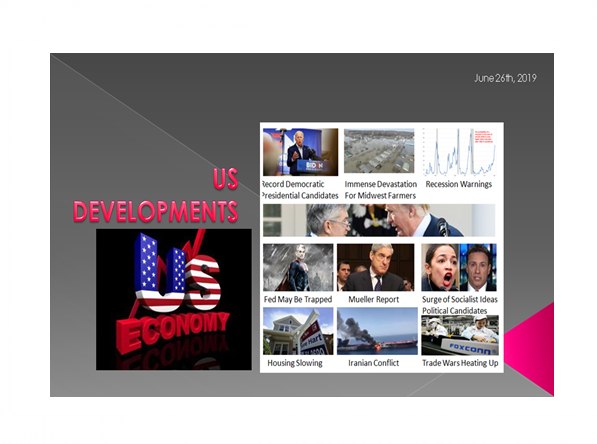
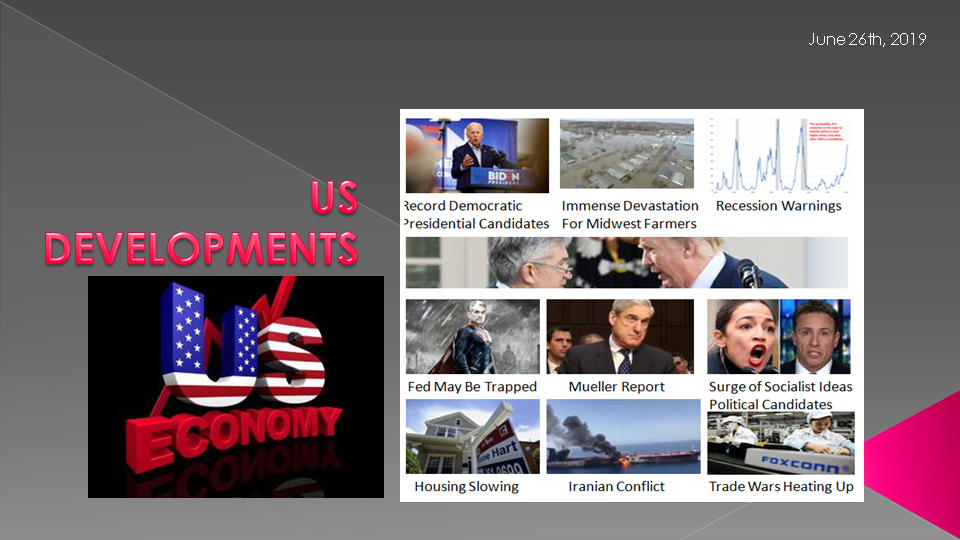
This month I would like to highlight some of the key messages outlined in the materials posted at MATASII.com as part of our Tri-Annual update on US Developments.
As such I would like to discuss the areas highlighted here.
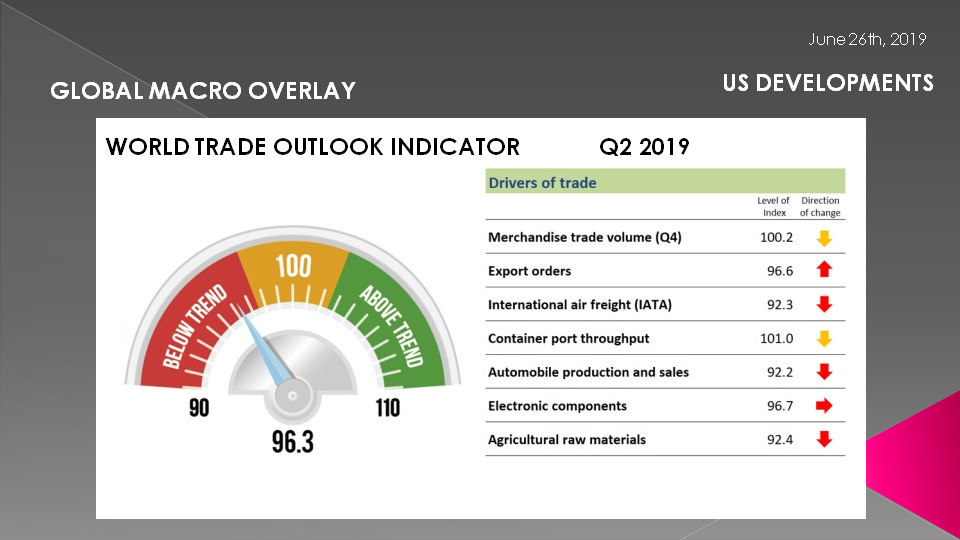
SLIDE 5 - GLOBAL MACRO OVERLAY
According to the WTO the Outlook for trade could worsen further if heightened trade tensions are not resolved.
World trade growth will likely continue to remain weak into the second quarter of 2019, The new WTOI reading is 96.3 which maintains the weakest level since 2010. The WTOI remains well below the baseline value of 100 for the index, signaling continued falling trade growth in the first half of 2019. The latest result of the WTOI was driven by declines in all but two component indices.
- Indices for international air freight (92.3), automobile production and sales (92.2) and agricultural raw materials (92.4) fell further below trend.
- The index for container port throughput (101.0) also declined but remained above 100, suggesting growth in line with recent trends.
- Indices for export orders (96.6) and electronic components (96.7) appear to have bottomed out, even as both remained firmly below trend.
WTO noted that there are significant downside risks to the 2019 forecast. “Any rebound in 2020 would depend on reduced trade tensions and/or improved macroeconomic performance” the WTO said.
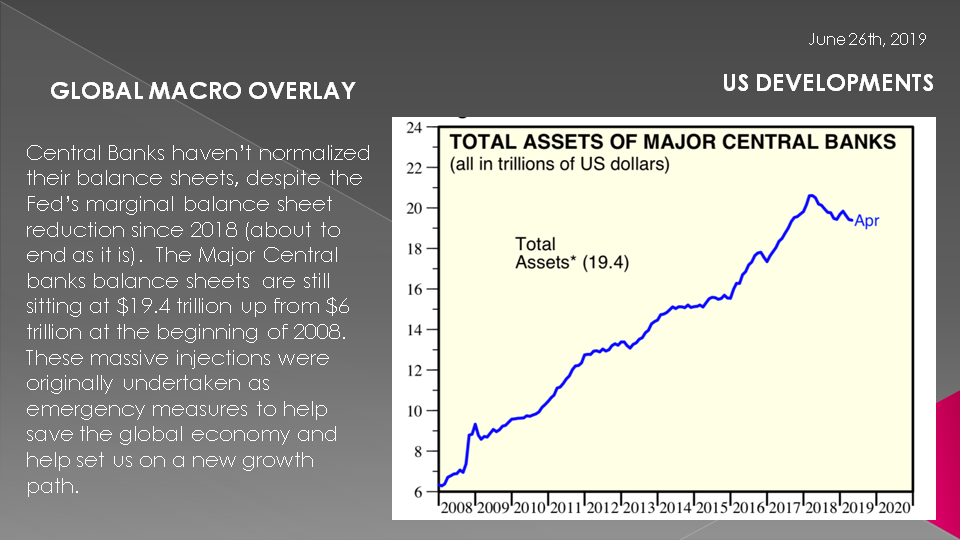
SLIDE 6
Central Banks haven’t normalized their balance sheets, despite the Fed’s marginal balance sheet reduction since 2018 (which is about to end in September).
The Major Central banks balance sheets are still sitting at $19.4 trillion up from $6 trillion at the beginning of 2008. These massive injections as you recall were originally undertaken as emergency measures to help save the global economy and help set us on a new growth path.
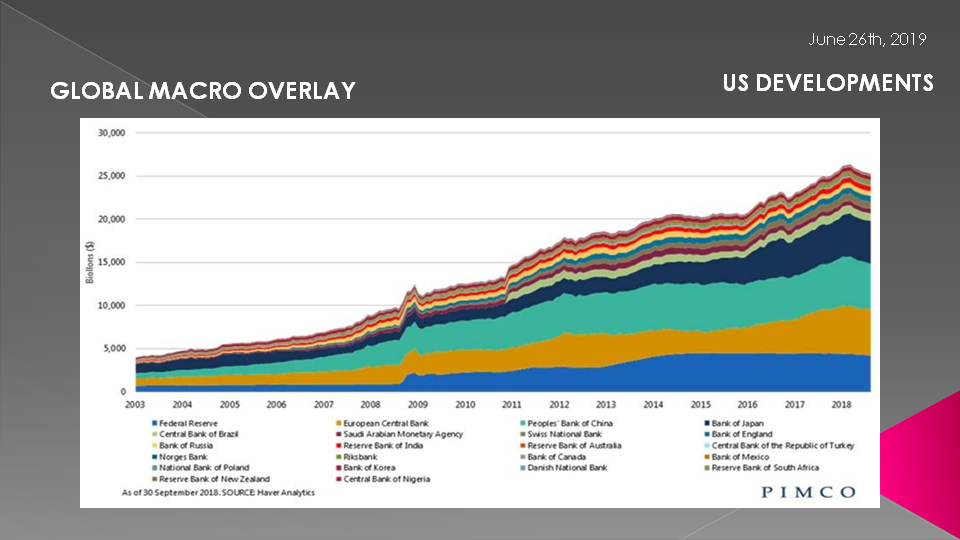
SLIDE 7
The overall central banks of the world have expanded their balance sheets by upwards of $22 trillion since the turn of the century, thereby massively monetizing the erupting public debt of the US and most of the world via fiat credit snatched from thin air.
So did that massive $22 trillion "buy" order from the central banks weigh heavily on the supply of funds side of the scales in the fixed income market, thereby driving bond prices skyward and yields ever lower?
Why, goodness gracious, yes it did!
The current worldwide regime of Keynesian central banking has so corrupted both financial discourse and pricing in the bond pits that this central bank balance sheet explosion is treated as inert financial wallpaper----utterly irrelevant to the whys and wherefores of daily actions of sovereign politicians. Moreover, the entire system is so mired in the fantasy called "Debt Doesn't Matter" (both public and private) that in fact debt levels to GDP are still rising!
SLIDE 8
The yellow line gives a little better granularity to the change in Balance Sheet Expansion. It is the US which is reducing its Balance Sheet. As such it is “pulling” US dollars from the global liquidity pool.
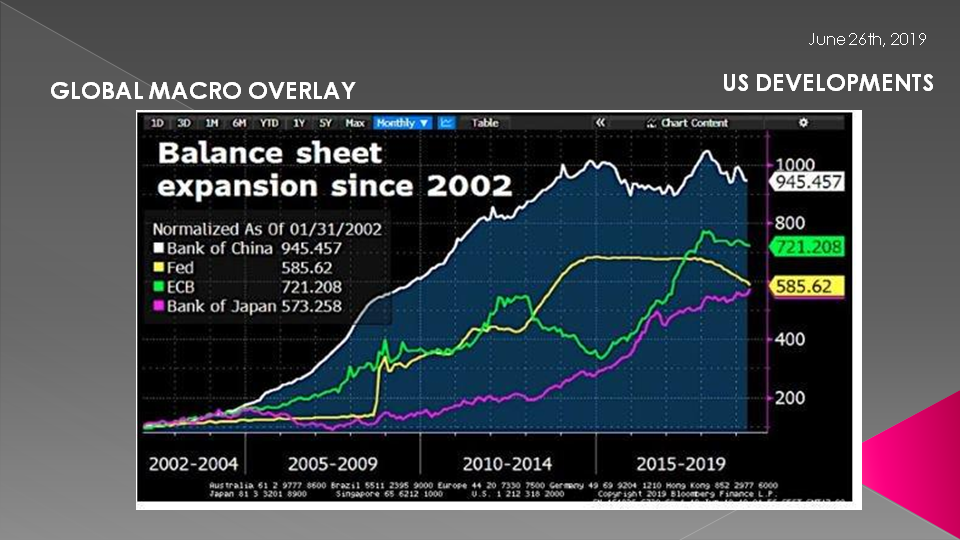
SLIDE 9
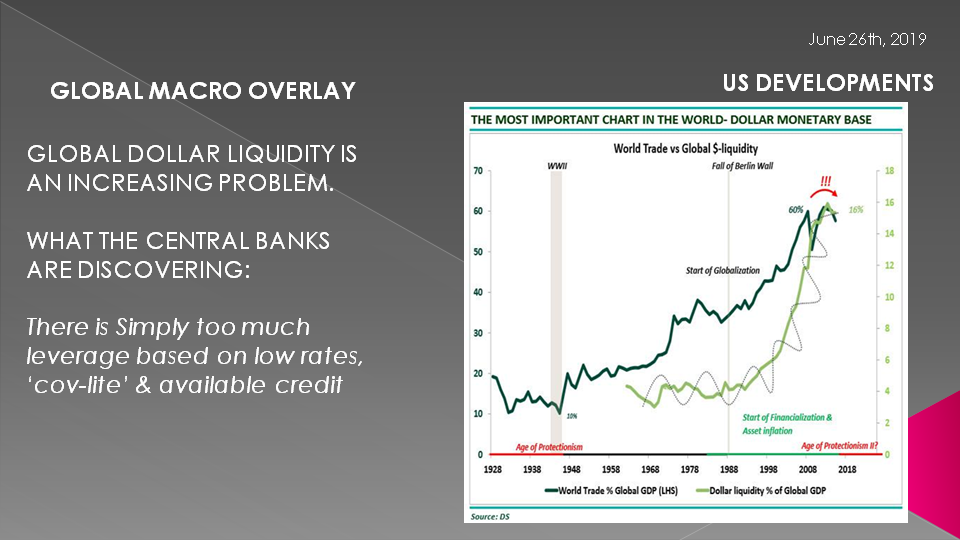
As a consequence we have a US$ and a EuroDollar shortage.
GLOBAL DOLLAR LIQUIDITY IS AN INCREASING PROBLEM.
WHAT THE CENTRAL BANKS ARE DISCOVERING IS:
There is Simply too much leverage based on low rates, ‘cov-lite’ & available credit
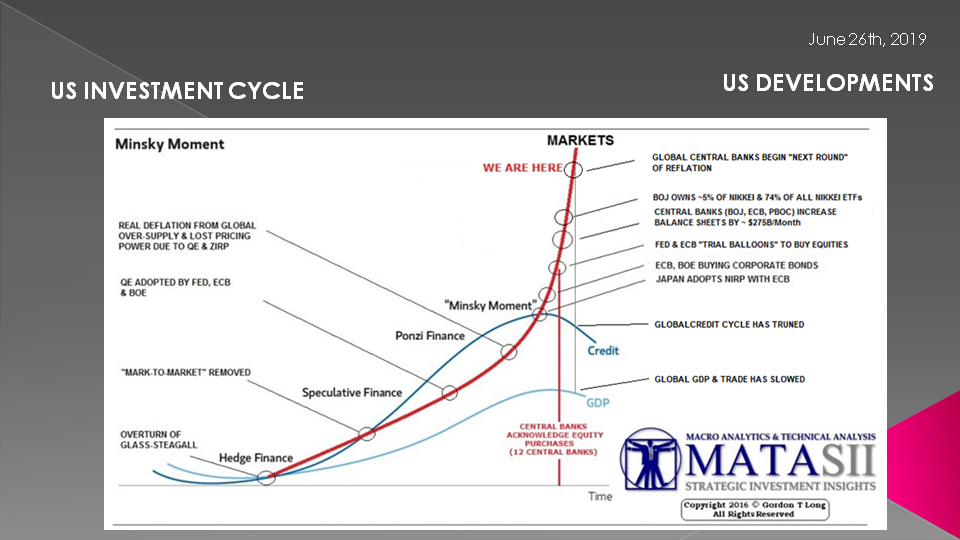
SLIDE 10 - US INVESTMENT CYCLE
Synchronized global growth has turned into a synchronized global slowdown. Growth has already turned negative in two of the world's largest economies, Japan and Germany, and is slowing rapidly in the world's biggest economies, China and the U.S. When the next crisis happens, the Fed will cut rates back to zero. But it won't be enough.
Then they'll have to abandon QT and go back to QE4. Other central banks will follow the Fed's lead.
The market sees this coming, but the Fed is only now seeing this coming.
Investors should prepare now for the inevitable final crackup boom.
- The Fed will lower rates to the zero bound,
- However Bond Yields will be stubbornly high due to a shortage of foreign buyers to buy US Treasury Debt,
- The US Dollar can than be expected to begin to fall,
- A weaker dollar will make US based global equities more expensive in US$,
- A Final "Crack-Up Boom" will unfold.
SLIDE 11
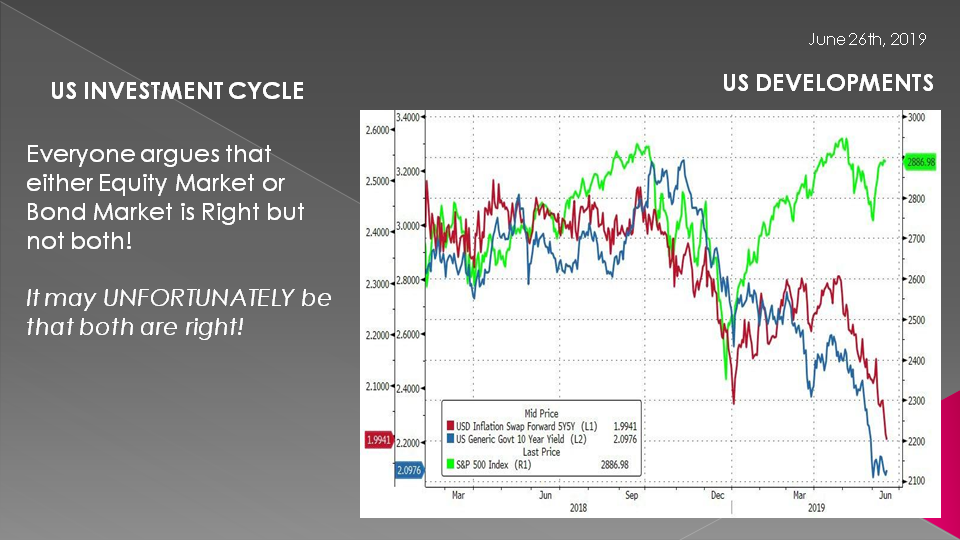
I think more and more global investors are sensing this and this is why we are seeing a mind blowing chart like this!
The media and analysts say it is because the Bond market sees something the Equity market doesn’t. The Bond Market sees a Recession looming, while the US Equity Market is falsely believing that the markets are fine because the US Economy is fine.
I suspect it is more that the Bond Market is absolutely right and many believe the outcome will be a debased dollar which will push US equities up in dollar denominated terms.
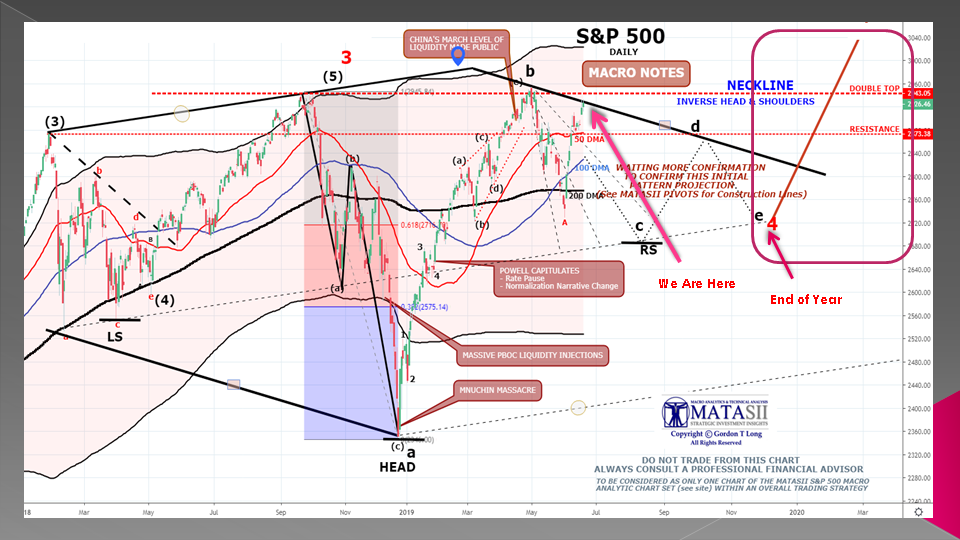
SLIDE 12
….. or one like this.

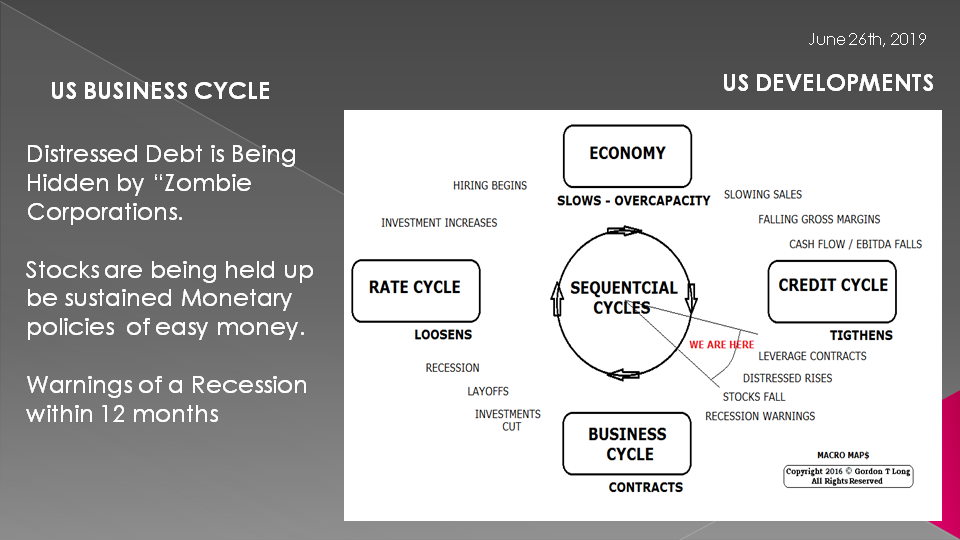
SLIDE 13 - US BUSINESS CYCLE
Our US Business Cycle analysis suggests we are quickly moving towards late cycle.
The Credit Cycle not shown here but which we have shown in previous videos is much further advanced suggesting that this cycle slope is much steeper than shown here.

SLIDE 14
We are not yet seeing Distressed Debt rising, which is normal at this point in the cycle. We suspect it is being hidden by the fact that according to the Bank of International Settlements somewhere between 12 and 20% of Global Corporations can now be labeled "Zombie Corporations" where their profits or cashflows don't match their debt payments. They are surviving by rolling debt over and financing interest payments with more debt.
Measures such as falling stocks values are being held up to sustain Monetary policies of easy money.
However, we are seeing endless numbers of indicators that warn of an impending recession within 12 months.
SLIDE 15
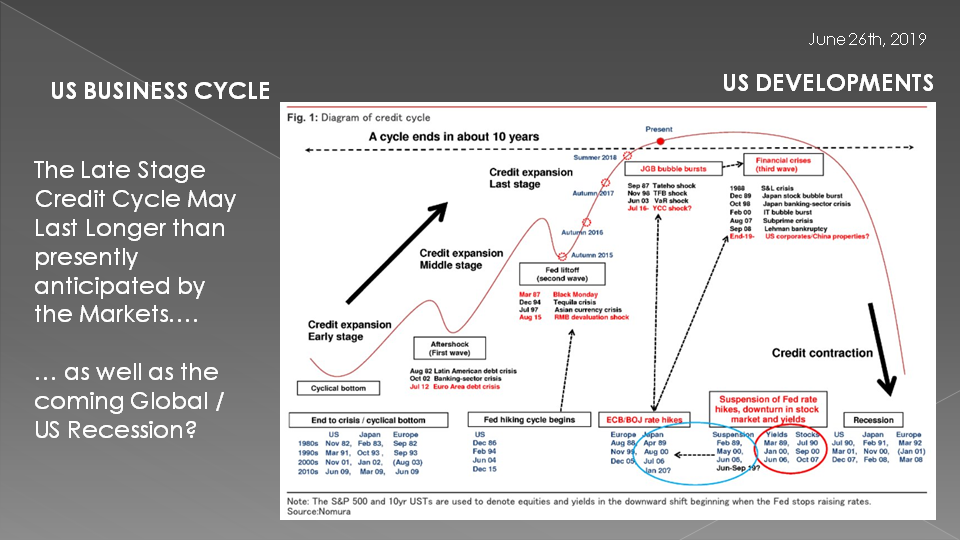
The Late Stage Credit Cycle may last longer than presently anticipated by the Markets if the central bank money spigot is once more opened up “full throttle”!
This will only delay the inevitable and therefore the coming Global / US Recession will also be much longer and more painful.
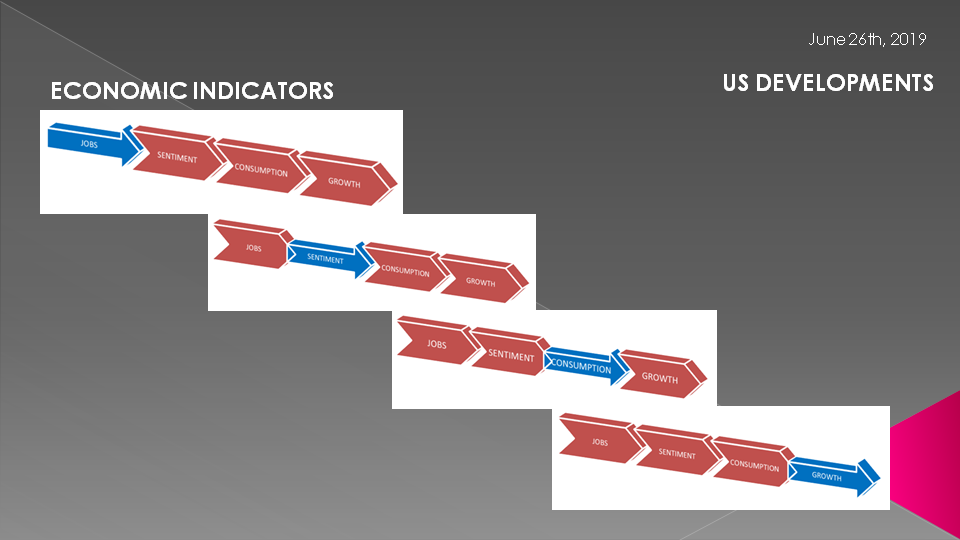
SLIDE 16 - ECONOMIC INDICATORS
We have posted many Economic Indicators on MATASII covering various Economic Indicators. Let me just focus on just one of the recently released Regional Federal Reserve Surveys.
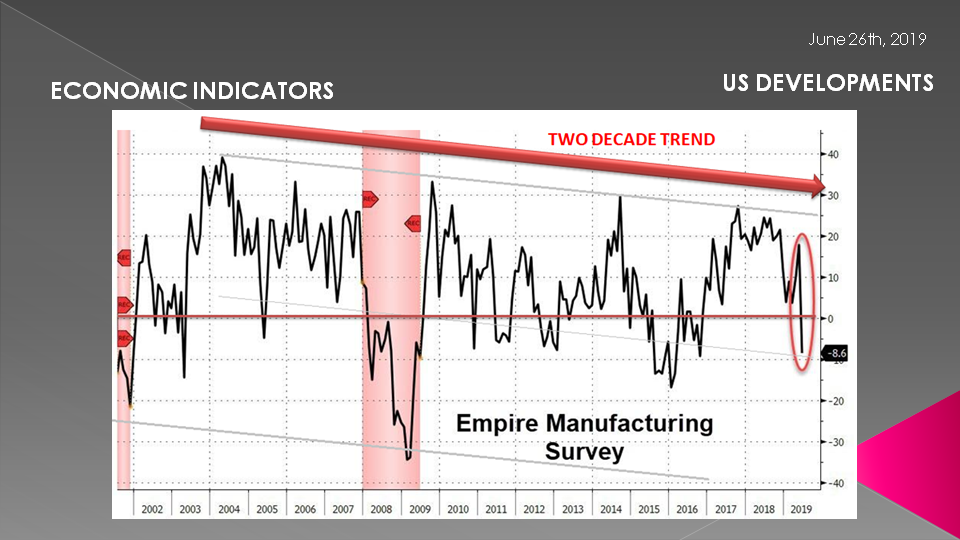
SLIDE 17
Against expectations of a small drop to 11.0, Empire State Manufacturing Survey collapsed - by the most on record - from +17.8 to -8.6 in June. This is the first negative print since Oct 2016.
This was 10 sigma below expectations...
This is the biggest M-o-M drop in the survey in its history
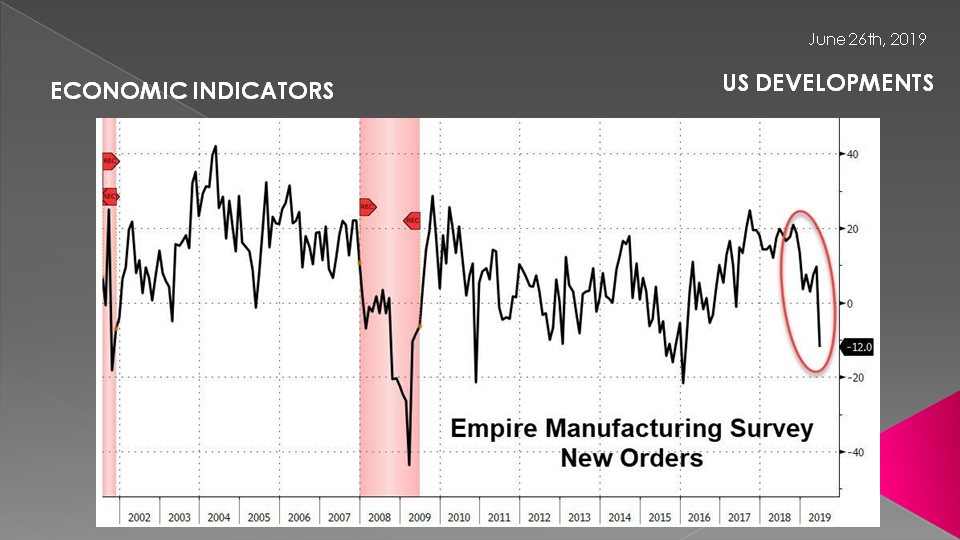
SLIDE 18
… led by a complete collapse in New Orders
Additionally, contraction (not slowing) was evident throughout the survey...
- Number of employees fell to -3.5 vs 4.7
- Work hours fell to -2.2 vs 4.4
- Inventory fell to -5.3 vs -4.1
- Six-month general business conditions fell to 25.7 vs 30.6
SLIDE 19
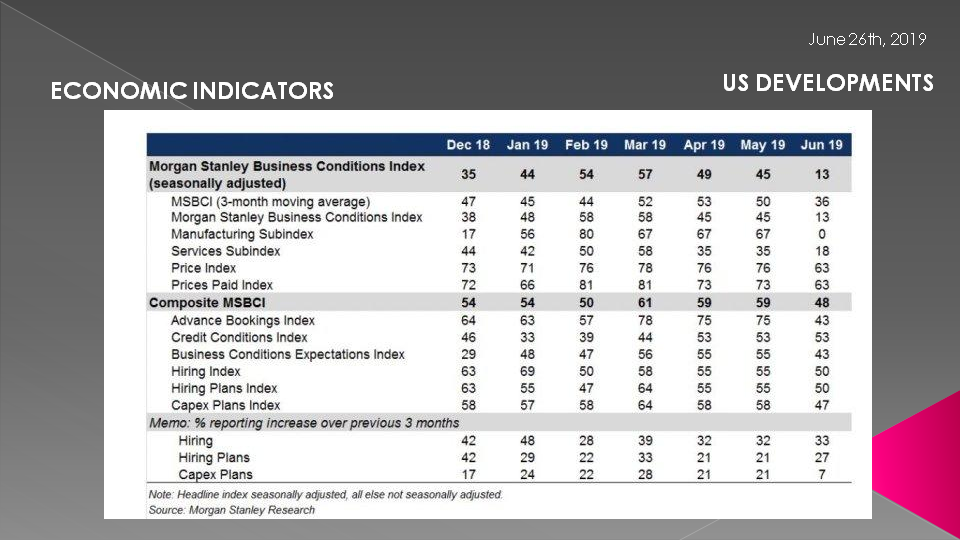
The Morgan Stanley Business Conditions Index collapsed by 32 points in June, the largest one-month decline on record, to a level of 13, a low since Dec 2008!
SLIDE 20
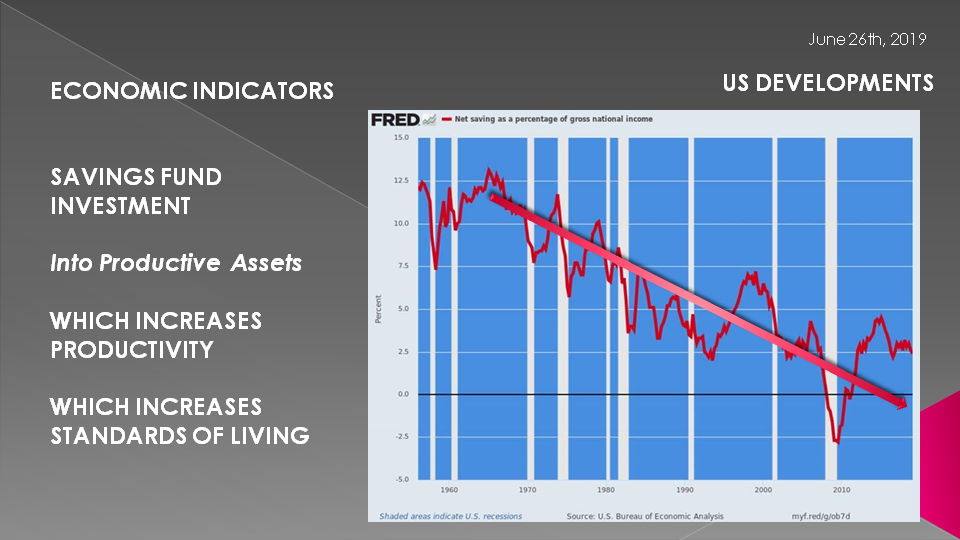
In a functioning Capitalist System, SAVINGS FUND INVESTMENT
However, the Savings must go dominantly Into ‘Productive Assets’. If it does
IT INCREASES PRODUCTIVITY --- WHICH INCREASES STANDARDS OF LIVING
Savings come from two sources:
- The Consumer
- Corporations
The problems is both sources are spending this savings not on Productive Assets but:
- Consumers on Consumption (Spending ‘beyond their means’)
- Corporations on Stock Buyback (Financial Engineering)
SLIDE 21 - POLICY – MONETARY, FISCAL & PUBLIC
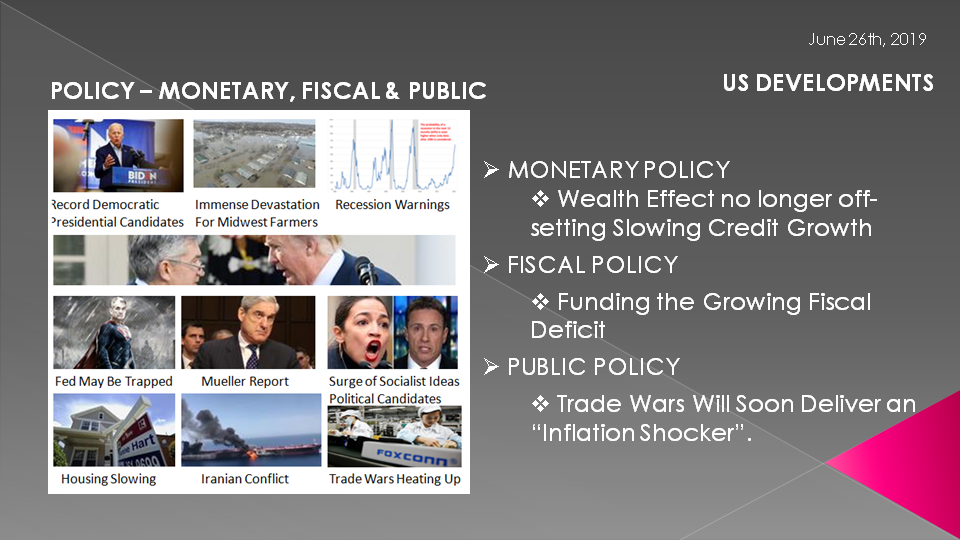
Let me highlight some of the key US policy issues:
1- MONETARY POLICY
The Wealth Effect is no longer off- setting Slowing Credit Growth
2- FISCAL POLICY
The ability of the US Government to Fund the Growing Fiscal Deficit
3- PUBLIC POLICY
The possibility that the number of mounting Trump Trade Wars Will Soon Deliver an “Inflation Shocker”.
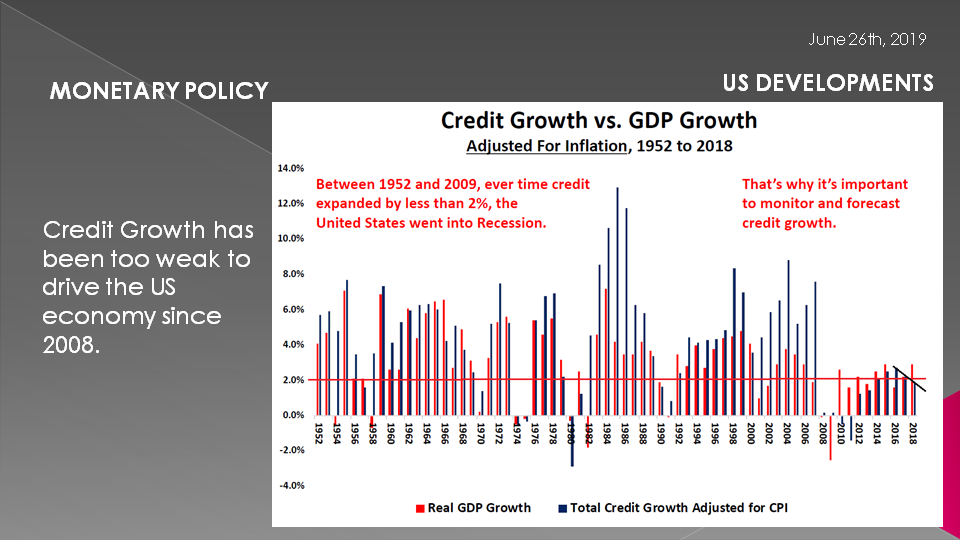
SLIDE 22 - MONETARY POLICY
First, Monetary Policy:
The Federal Reserve has been well aware since 2008 that credit growth was weak and would likely remain below the critical 2% threshold.
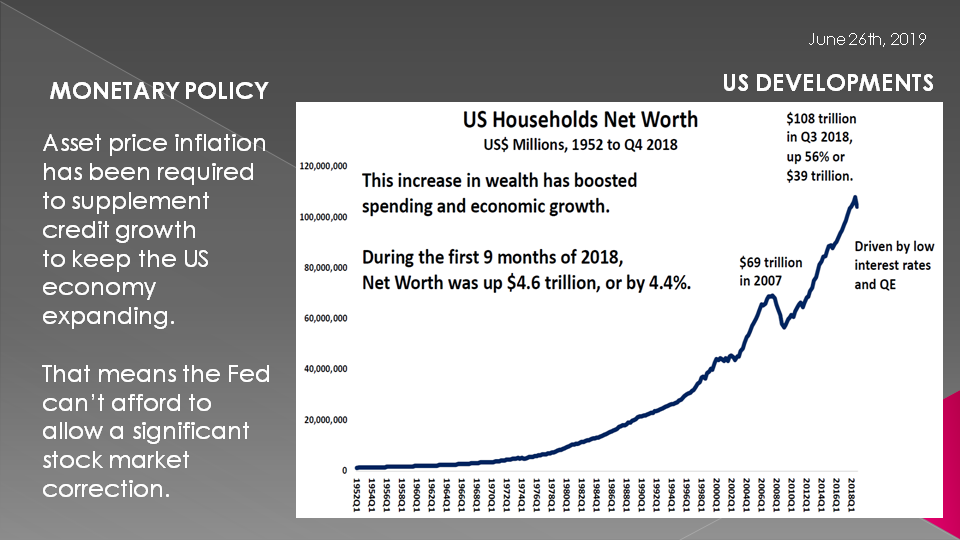
- That has meant the US economy would remain dependent on asset price inflation if it was to avoid falling into a recession,
- That sustained dependence has slowly trapped the Fed and made it hostage to the stock market. It wasn’t by design but rather a natural evolution of a slowing rate of growth of the global economy,
- Presently, the Fed simply can’t afford to let stock prices fall, or for that matter even flatten out,
- That has meant for some time now that the Fed would have to begin cutting interest rates in 2019 to make sure asset prices kept rising if the economy was to continue expanding – even at a slower rate.
This obviously flies in the face of lowering rates when the US Economy is supposedly strong!
The Fed has therefore been trying to spin this distortion since the fall of 2018.
This has given Chairman Powell the untenable task of convincing the public that low inflation is bad, the strong US Economy needs help, that full employment requires rate cuts not historical rate increases, that QT must be stopped and soon new QT measures are once again required.
The answer has been to blame it on the global economy & trade wars. That is flawed because it is the Fed’s choking of US & Euro$ that has precipitated the rate of global slowing trade!
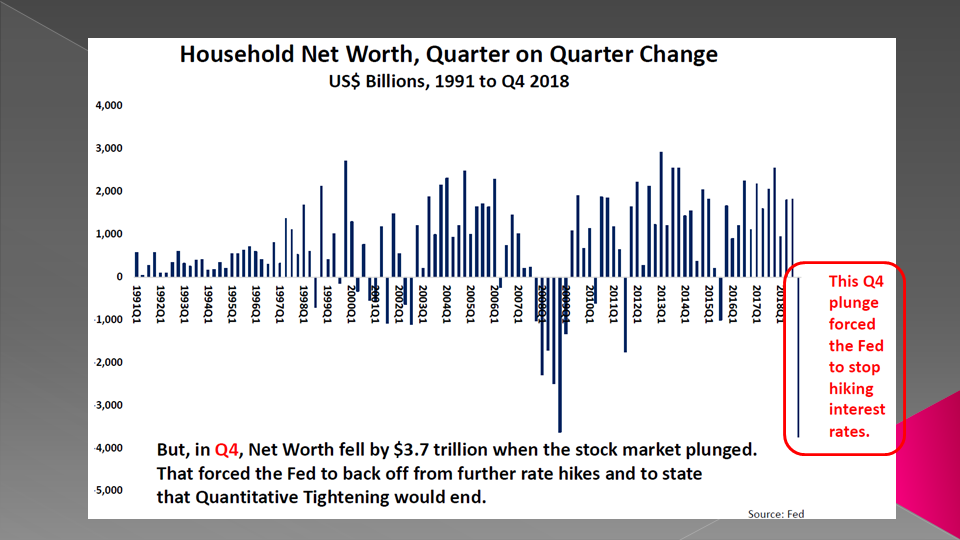
SLIDE 23
Since 2008 things were holding together regarding asset inflation. On the surface it appeared that the Financial Crisis was in the rear view mirror and it was time to tap the brakes on QE and ever so lightly on QT….
SLIDE 24
That blew up in Q4 2018 and the Fed has since had to abruptly reverse everything it had been espousing or at least what the public had been buying! QT stops in September and rate reductions likely begin in July.
- If lower interest rates aren’t enough to keep the economy from falling into recession, the Fed will launch QE 4 or some political acceptable version of it.
- If the Fed is forced into a new round of Quantitative Easing, there’s every reason to expect it to be temporarily successful. QE 4 would drive asset prices higher, aid near term economic growth and push the looming recession out a little further – possibly until after the upcoming US Presidential Elections.
SLIDE 25
It’s only a matter of time before this new QE scenario plays out. It may be sooner than everyone currently realizes
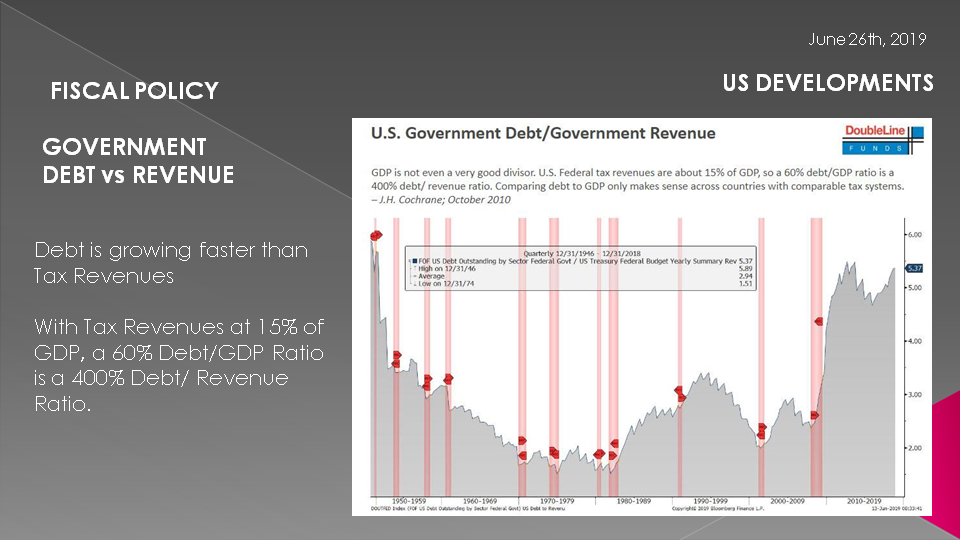
SLIDE 26 - FISCAL POLICY
Though the Trump Tax cut and the “Sugar High” it created has run its course the Fed & Congress are left with a mounting disconnect between slowing revenue growth and increasing debt servicing costs.
The unwritten job of the Federal Reserve is to ensure the US government can be financed. High rates are problematic especially when Tax Revenues at 15% of GDP result in a 400% Debt/ Revenue Ratio.
SLIDE 27
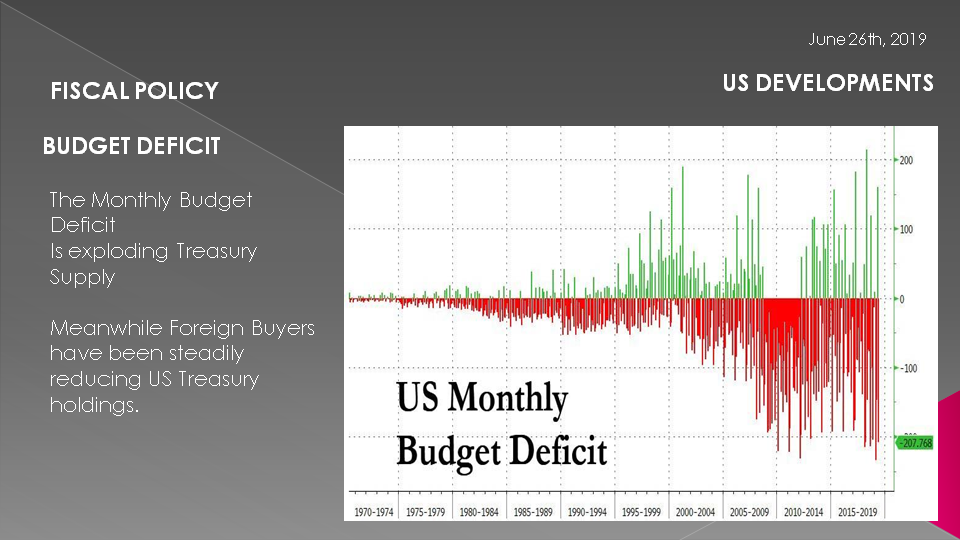
The Monthly Budget Deficit is exploding Treasury Supply. Meanwhile Foreign Buyers have been steadily reducing US Treasury holdings.
SLIDE 28
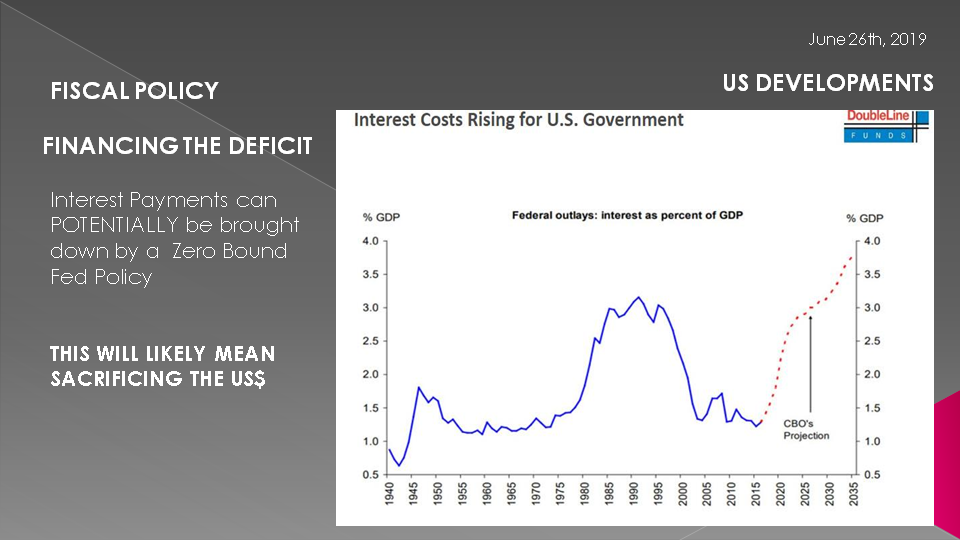
If the CBO Projection history is any indication, then you can expect this chart of Federal Interest as a percentage of GDP to be much worse.
Interest Payments can be brought down by Zero Bound Fed Policy
THIS WILL LIKELY MEAN SACRIFICING THE US$
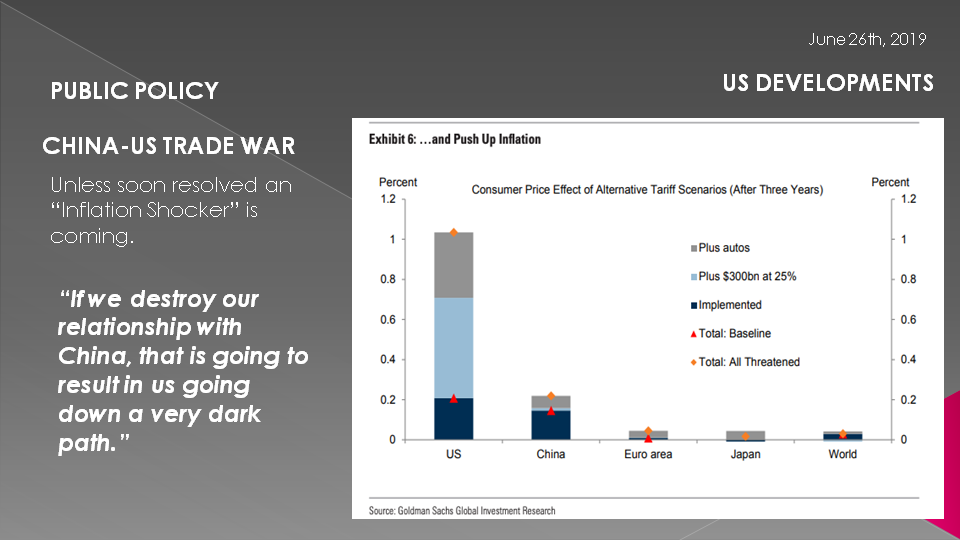
SLIDE 29 - PUBLIC POLICY
As if Monetary and Fiscal problems are not sufficient, Public policy is adding dramatically to the problem!
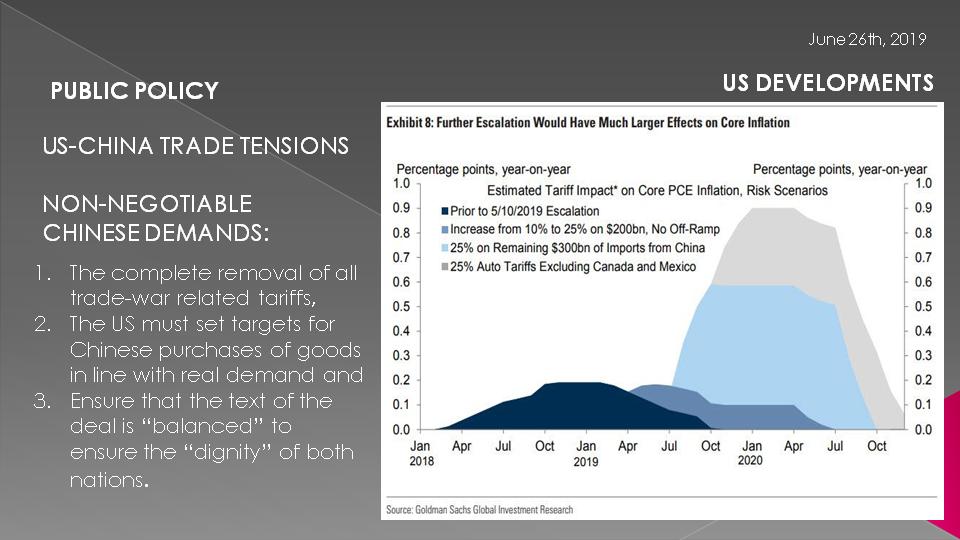
The US China Trade Tensions have escalated significantly! Trump first doubled down on trade war with China... then he escalated the trade war with Mexico, "weaponizing" tariffs as a means to achieve his border policy. I don’t believe the Mexico tariff situation is fully resolved. Meanwhile Trump completed the trifecta when last week he also dragged India to the precipice of another trade war.
All of this impacts trade and growth. But there is something else it impacts ….
SLIDE 30
Tariffs are a tax on the US Consumer. It is the US Consumer and US distributors who will pay the tariffs in elevated consumer prices or shrinking profits.
WalMart & Targets as example have already approached the President on the magnitude of the impact to US Retail price hikes it will be forced to implement. It has thrown the retail space into chaos while currently farmers are getting all the headlines.
Unless this is soon resolved an “Inflation Shocker” is coming. That is something that US Monetary and Fiscal policy is frankly ill-equipped to handle!!!
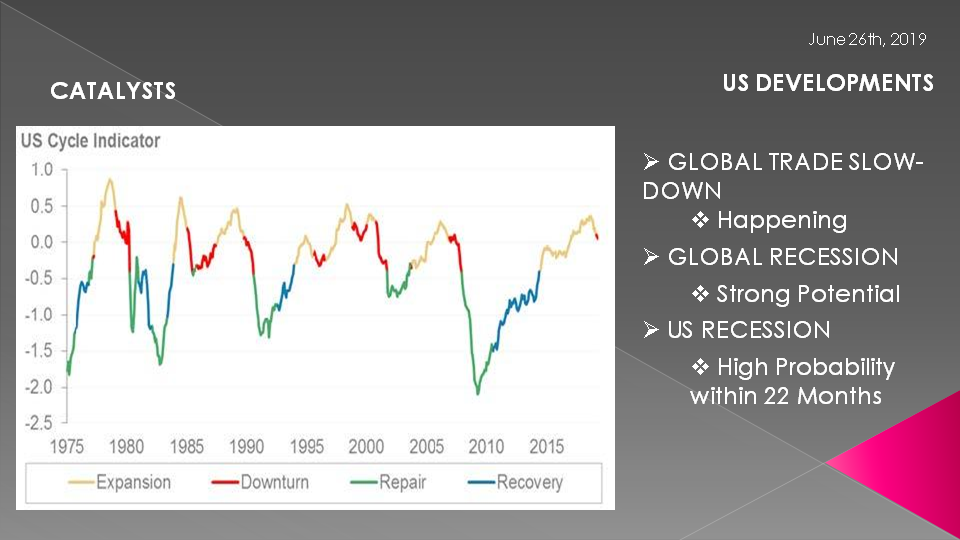
SLIDE 31 - CATALYSTS
The catalysts of a Global Trade Slowdown, a potential Global Recession and an overdue cyclical US Recession together sounds like a potential perfect storm!!
In the upcoming July LONGWave video entitled “2nd Half Strategic Investment Insights (SIIs) – Update”, we will discuss the Investment Strategies used for such a scenario.
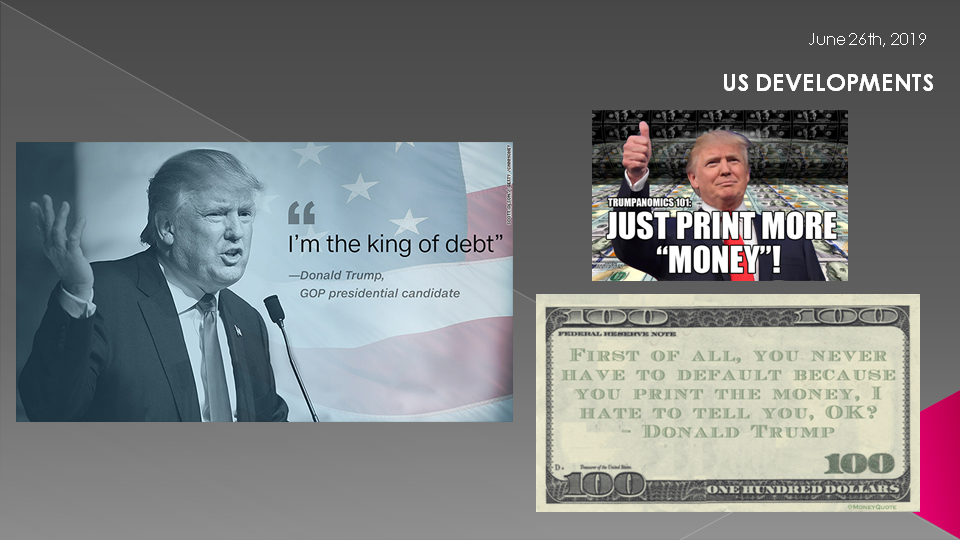
SLIDE 32 - TRUMP
So, in closing, as I always remind you – remember the answer will be to print more money.
It is the only answer politicians will ever agree on. Until No one wants it or Trusts It!
Invest accordingly.
SLIDE 33 - - DISCLAIMER & WRAP
I would like take a moment as a reminder
DO NO NOT TRADE FROM ANY OF THESE SLIDES - they are for educational and discussions purposes ONLY.
As negative as these comments often are, there has seldom been a better time for investing. However, it requires careful analysis and not following what have traditionally been the true and tried approaches.
Do your reading and make sure you have a knowledgeable and well informed financial advisor.
So until we talk again, may 2019 turn out to be an outstanding investment year for you and your family.
Thank you for listening