IN-DEPTH: TRANSCRIPTION - LONGWave - JUNE 2019 - SHIFTING INVESTOR CONFIDENCE
SLIDE - COVER
Thank you for joining me. I'm Gord Long.
A REMINDER BEFORE WE BEGIN: DO NO NOT TRADE FROM ANY OF THESE SLIDES - they are COMMENTARY for educational and discussions purposes ONLY.
Always consult a professional financial advisor before making any investment decisions.
INTRODUCTION - WHAT WE WILL TALK ABOUT
In this Month’s LONGWave video, as I did last month, I would like to discuss what we are seeing in our MATASII charts to put them into an integrated context
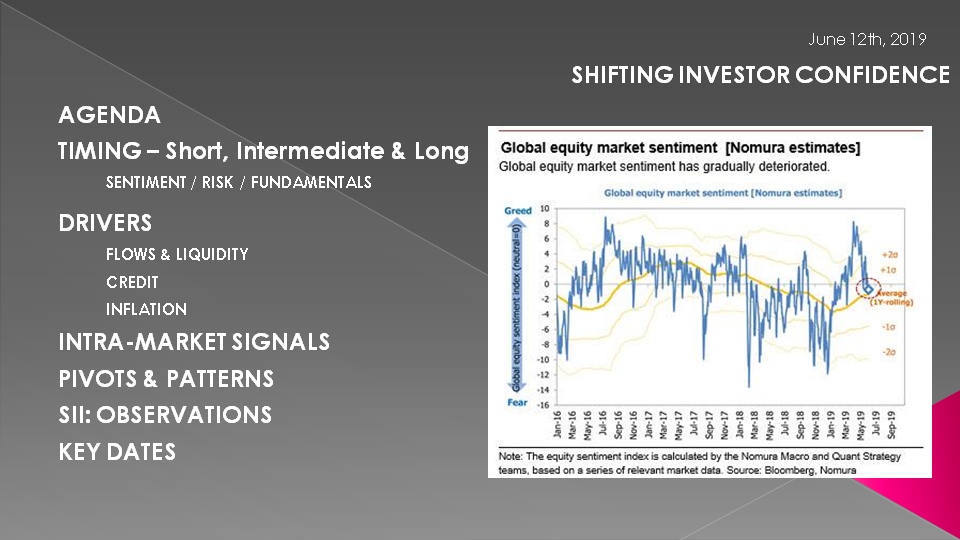
SLIDE - AGENDA
As such I would like to cover those items listed here.
SLIDE 5
Last week was the best week since November for US stocks...
Yet, the Global economic surprise data has now been negative since April 2018 - the longest period on record.
Negative Macro surprises are a result of:
- China-US Trade War intensifies and appears China is now preparing to take the long road,
- Trump launching Mexican Tariff Threats,
- Trump launches an India trade war;
- US labor market with May’s Non-Farm Payroll Labor Report is now cracking;
- US GDP slowing;
- German manufacturing collapsing;
- S. Korean export drop needs a bigger chart;
- Global PMIs plunging;
- Bond yields crashing...
However, Bad news is Good news -- once again...
We will explain why and what to expect going forward.
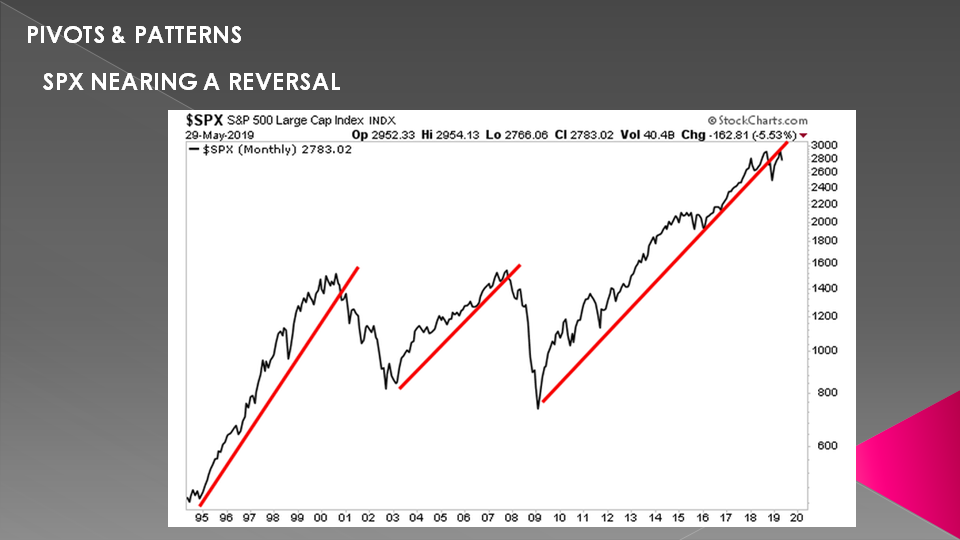
Let’s start with Fundamentals – Risk – Sentiment.
For years on these video’s I have begun these videos by stressing that Fundamentals are about the Long Term, Risk about the Near Term and Sentiment the Short Term.
When they all strongly signal the same thing then major reversals soon occur. Those reversals come in two forms.
For Tops they are a PROCESS. For a bottom they are an EVENT!
SLIDE 6
FUNDAMENTALS
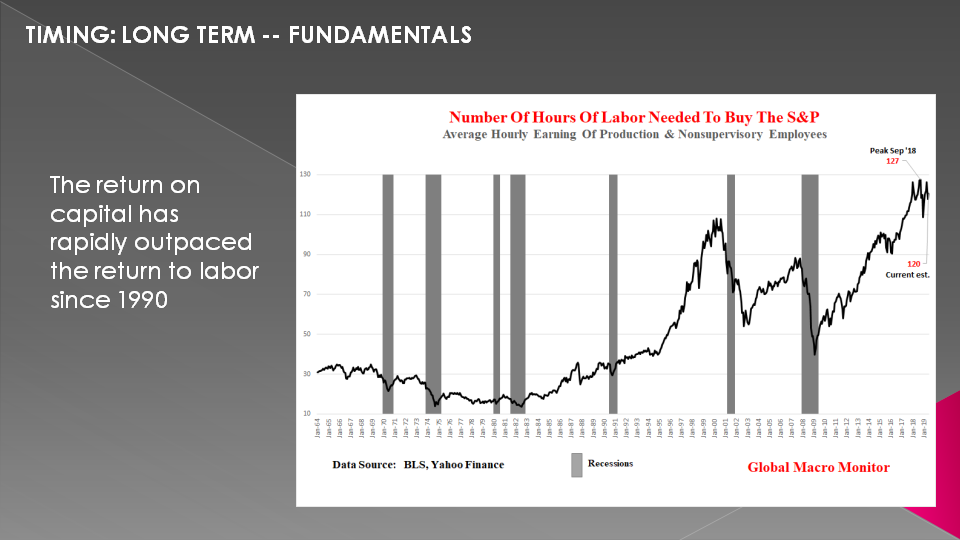
We show here the number of US hours of work needed to purchase the S&P.
The monthly S&P 500 time series is deflated by the average hourly earnings of production and non-supervisory employees. We see the S&P500 is currently at a level of extreme valuation.
Stocks eventually have to track the economy but do often diverge for periods longer than most short-sellers can remain solvent. We respect that and tend not to fight the market until it shows signs of cracking. Easier said than done, however, as the algos have mastered the art of setting bear traps.
Profits don’t grow to the sky and are subject to economic constraints. Squeezing labor costs to further increase margins creates not only political conflict but tips the economy into a nasty feedback loop of weak demand, lower capital spending, and more cowbell buybacks.
The end result is punk economic and top-line growth further forcing firms to increase margins by additional cost-cutting.
SLIDE 7
We have written extensively about the level of Corporate debt globally and the growing size of Zombie Corporations.

SLIDE 8
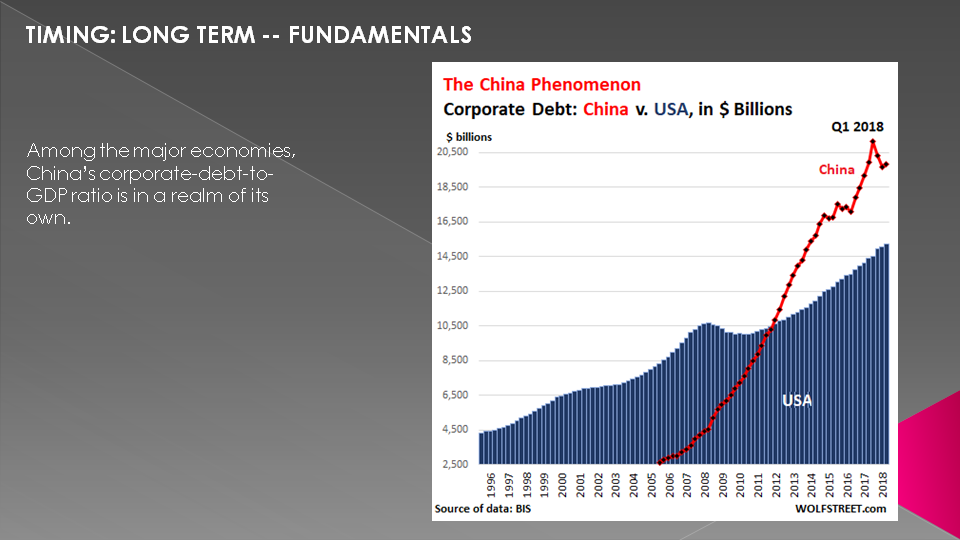
As big as US Corporate debt has become, primarily as a result of US stock buybacks – it pales in comparison to other countries.
China, a smaller economy than the US economy, has by far more non-financial corporate debt. In US dollar terms, corporate debt in China hit a record of $21.1 trillion in Q1 2018, by far the most of any country. But since then, Chinese companies have been deleveraging under the orders from the central government. Deleveraging takes many forms in China, including defaults, state-mandated loan-to-equity swaps by Chinese state-owned banks, and bailouts by the central government, which includes the PBOC.
In Q4, 2018, China’s non-financial corporate debt (red line) was $19.8 trillion, with efforts to deleverage in Q4 having taken a backseat to efforts to boost the economy:
SLIDE 9
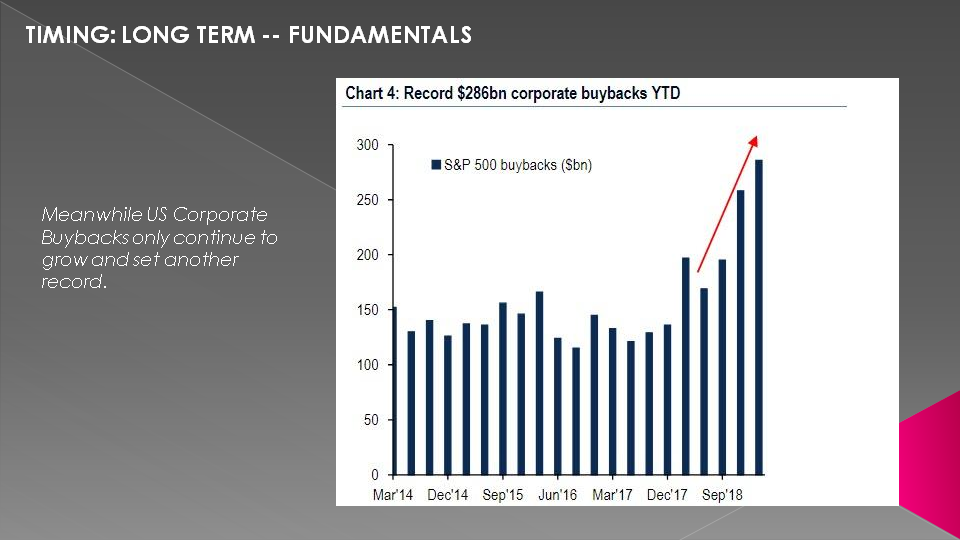
Meanwhile US Corporate Buybacks only continue to grow and set yet more records.
SLIDE 10
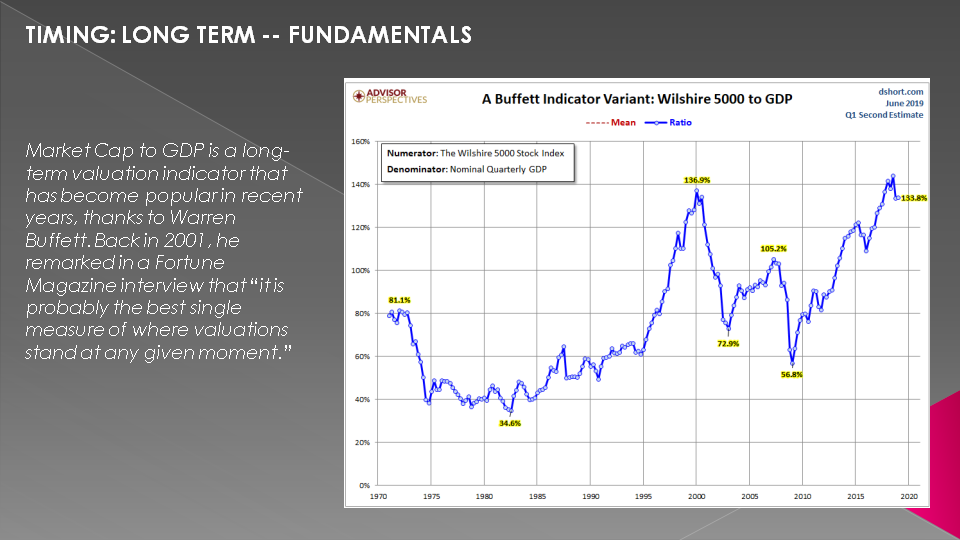
We like the “Buffet Indicator”. That is Market Capitalization-to-GDP.
Market Cap to GDP is a long-term valuation indicator that has become popular in recent years, thanks to Warren Buffett. Back in 2001, he remarked in a Fortune Magazine interview that “it is probably the best single measure of where valuations stand at any given moment.” – Doug Short
This macro metric additionally illustrates stock valuations are at historical extremes.
SLIDE 11
RISK
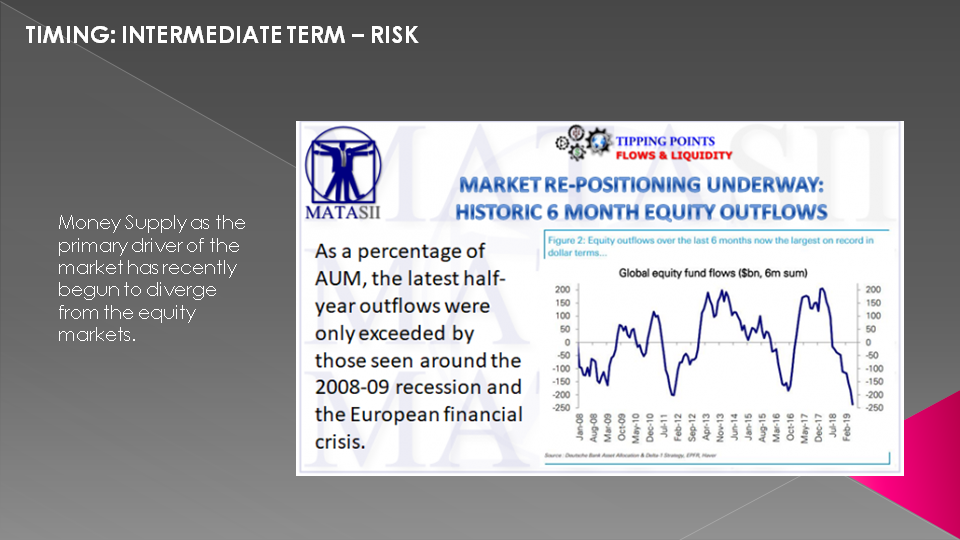
Turning to Risk we see historic monthly equity outflows as markets have been re-balancing to the Treasury Market as percentage of Assets Under Management. The latest half-year outflows were only exceeded by those seen around the 2008-2009 recession and the European Financial Crisis.
SLIDE 12
At MATASII we watch closely the activities of the CTAs or Commodity Trading Advisors. The CTAs track the ISM Manufacturing Index and in fact weak US Economic momentum which we currently have typically supports systemic trend-followers or “chase-selling”. Because CTAs move such large amounts of highly leverage money, they move the markets in the short to intermediate time frame.

SLIDE 13
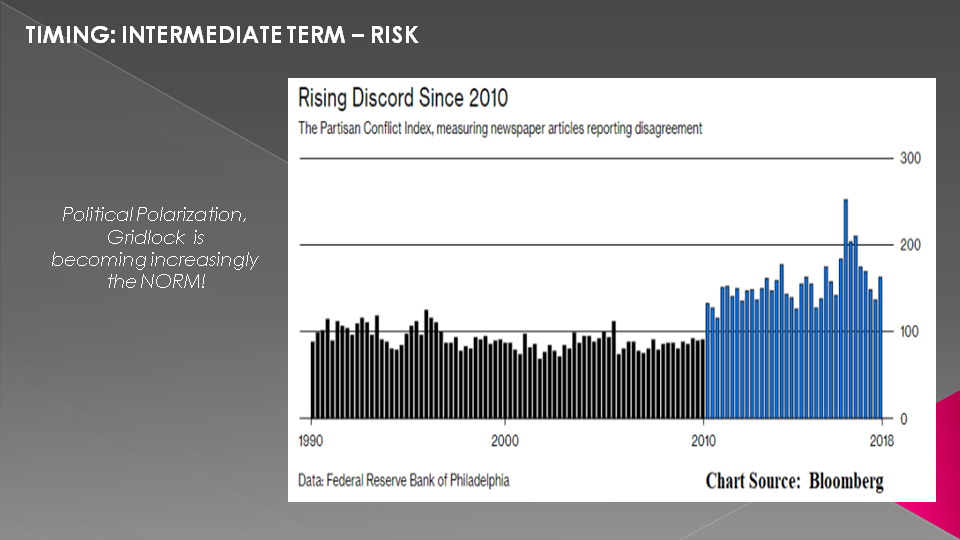
We have been highlighting in the UnderTheLens monthly Macro videos the fact that Political Polarization & Gridlock is becoming increasingly the norm! This is like sailing in a storm with the helm locked. Geo-Political risks of miscues is rising at unprecedented rates and could trigger a major financial crisis at any moment with global economies presently so fragile!
The MATASII Tipping Points and UnderTheLens Macro video contents are becoming increasingly concerning and reflect global risks at extreme levels, historically often seen prior to military conflicts.
SLIDE 14
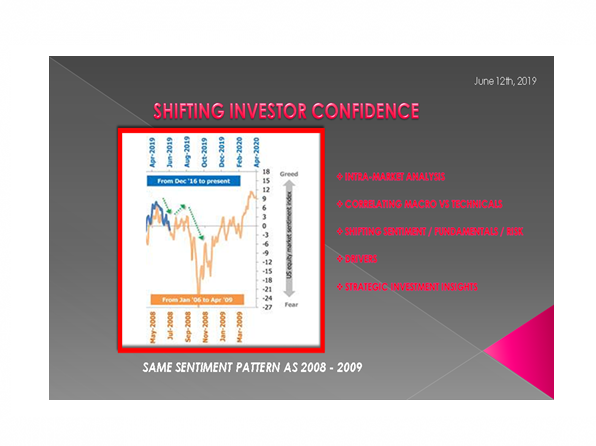
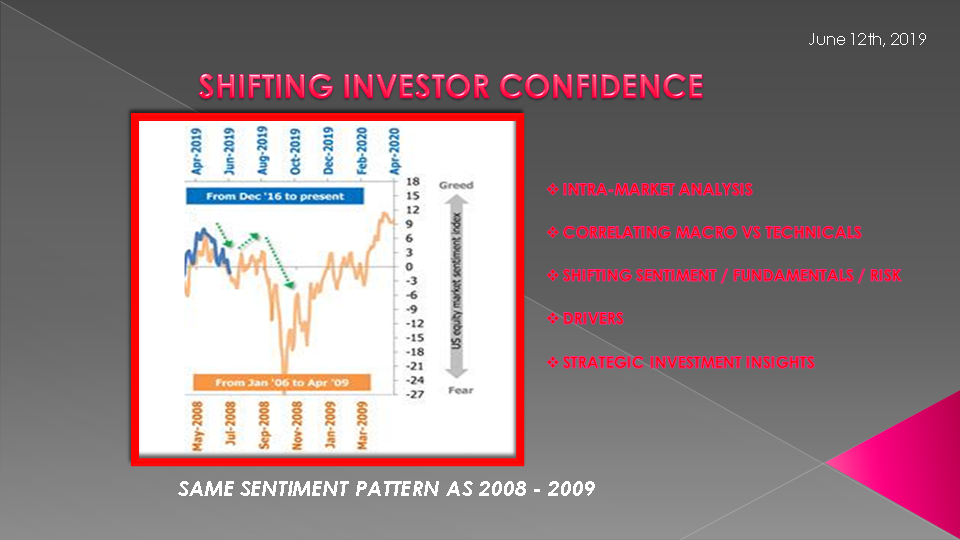
SENTIMENT & CONSUMER CONFIDENCE.
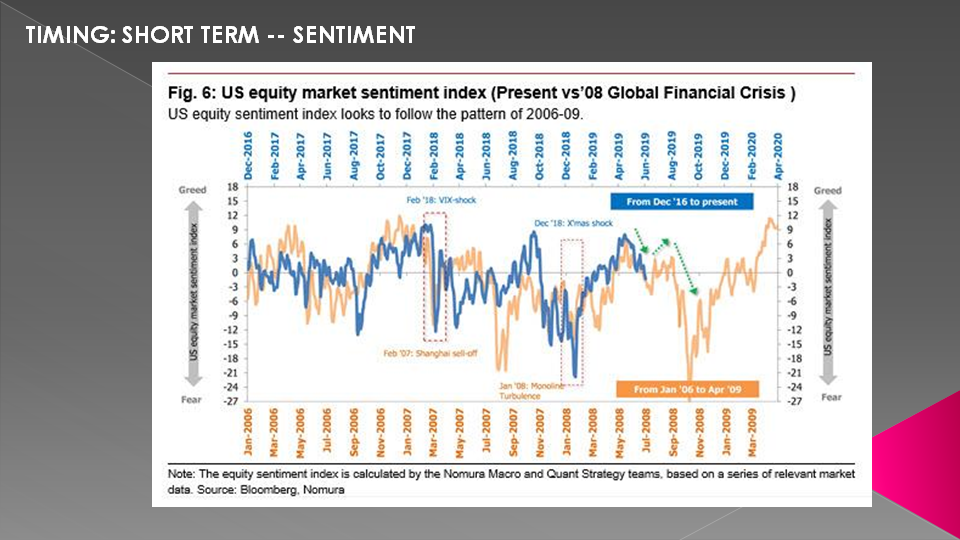
This is the area to really focus on and is why in our monthly LONGWave’s we normally show so many charts. This month I will limit them to only four since we have shown in previous videos that we see strong signs that Consumer & Investor Confidence and Sentiment has topped and is reversing downward.
This recent chart from Nomura compares present US Equity market sentiment to that seen prior to the run up to the 2008 Global Financial Crisis. The US Equity Index looks to follow the pattern from 2006-2009.
If this continues it suggests we may see an overall rally (like 2008) into the fall before collapsing.
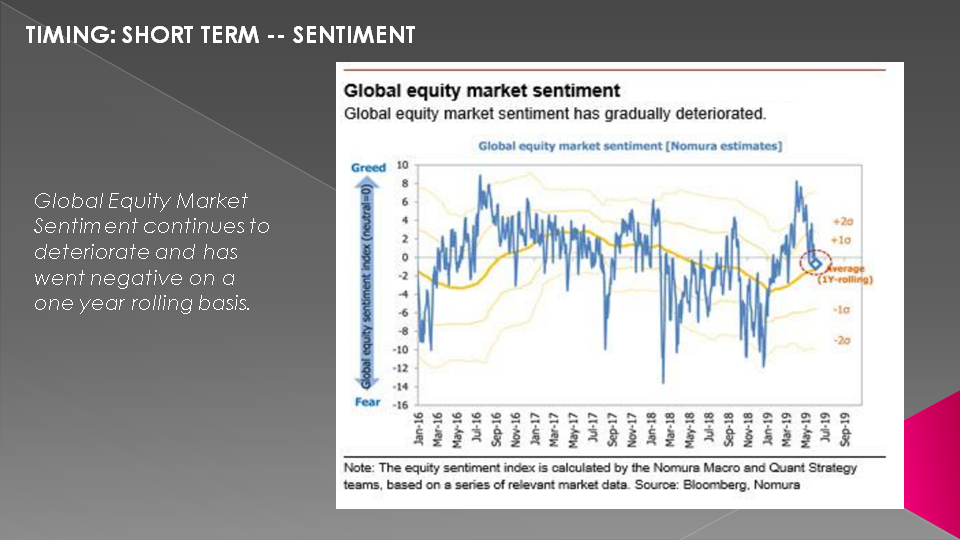
SLIDE 15
Global Equity Market Sentiment continues to deteriorate and has went negative on a one year rolling basis.
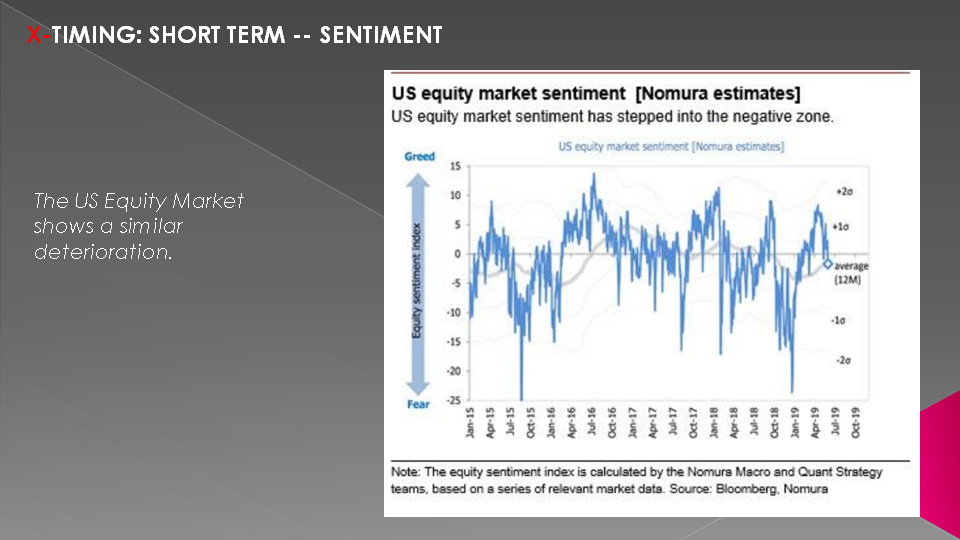
SLIDE 16
The US Equity Market shows a similar deterioration.
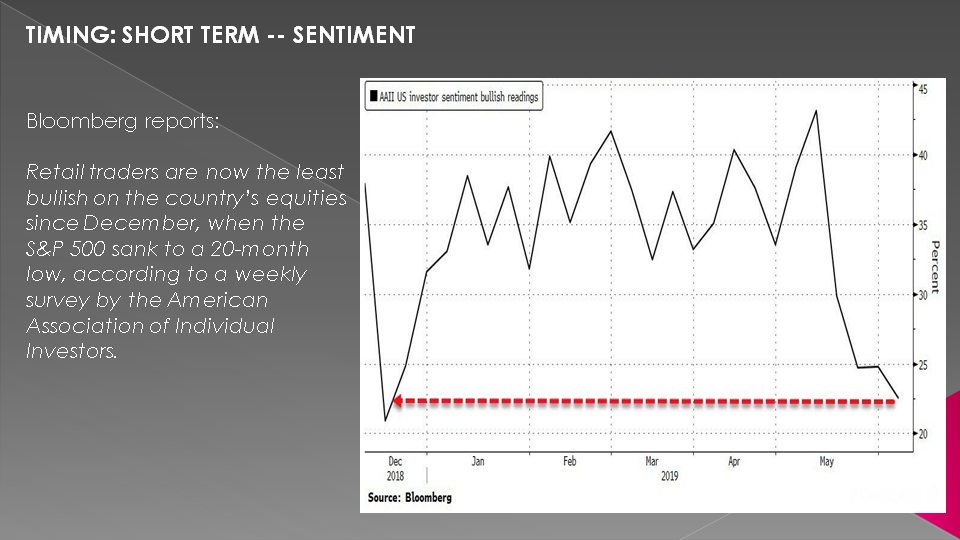
SLIDE 17
As Bloomberg reports, the S&P 500 has sunk to a 20-month low according to a weekly survey by the American Association of Individual Investors.
So we have Fundamentals – Risk and Sentiment all at extremes.
Since tops are a process lets see if we have that underway?
But before we do lets just consider a few key market drivers first.
SLIDE 18
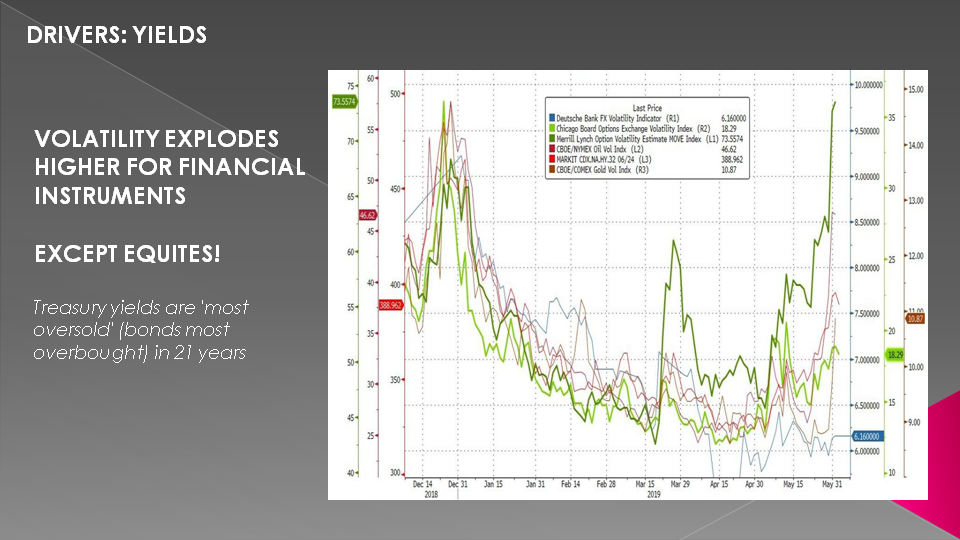
YIELDS – HAVE BEEN PLUMMETING
Treasury yields are now the 'most oversold' (bonds most overbought) in 21 years.
As shown here, not only the Bond Volatility “Move” index, but volatility everywhere has exploded higher for all financial instruments except for equities.
SLIDE 19
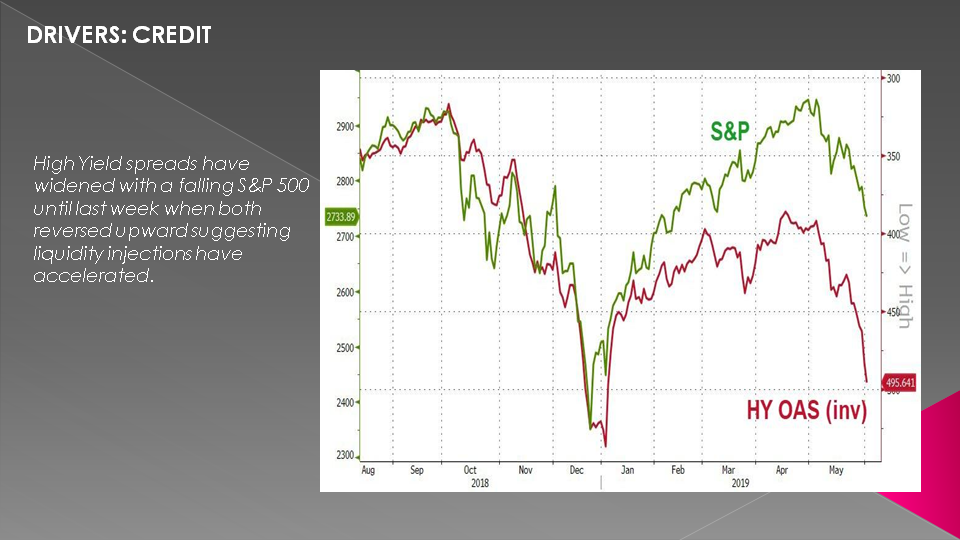
CREDIT: SPREADS HAVE WIDENED
High Yield spreads have widened with a falling S&P 500 until last week when both reversed upward suggesting liquidity injections have accelerated.
SLIDE 20
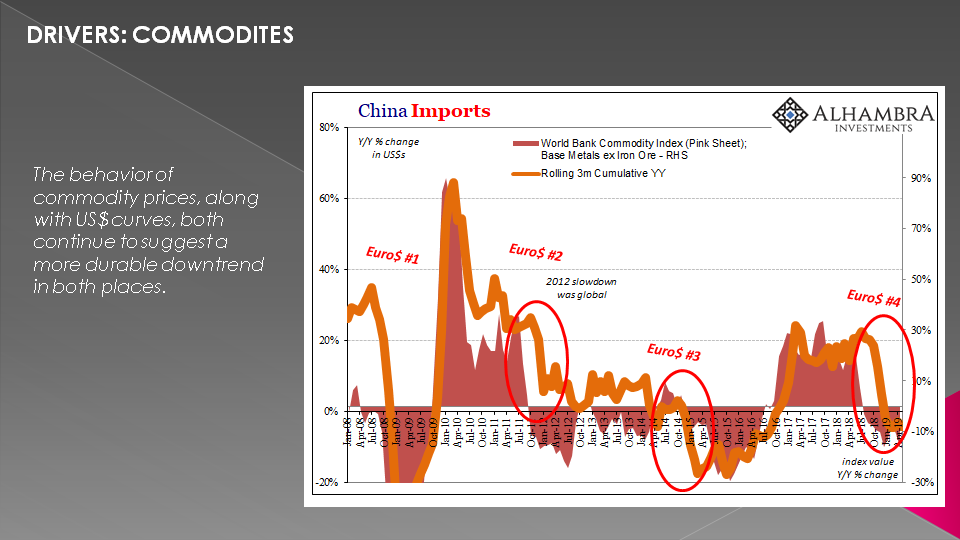
COMMODITIES: Expectations continue to be taken Down.
The behavior of commodity prices, along with US$ curves, both continue to suggest a more durable downtrend in both places.
Not transitory, this globally synchronized downturn which has stalled economic growth everywhere still very likely in its beginning stages. If the US labor market isn’t actually strong and Chinese monetary authorities aren’t actually stimulating, it’s hard to argue with commodities.
SLIDE 21
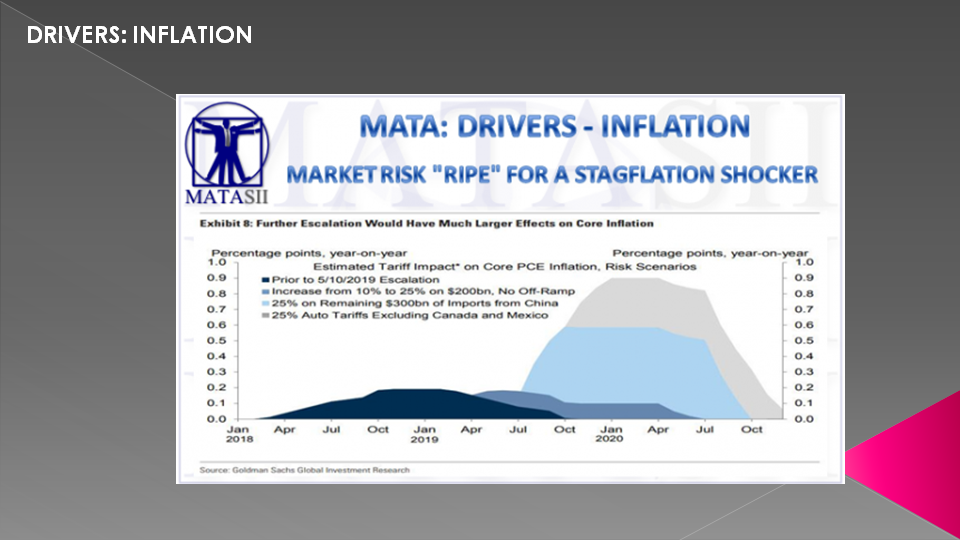
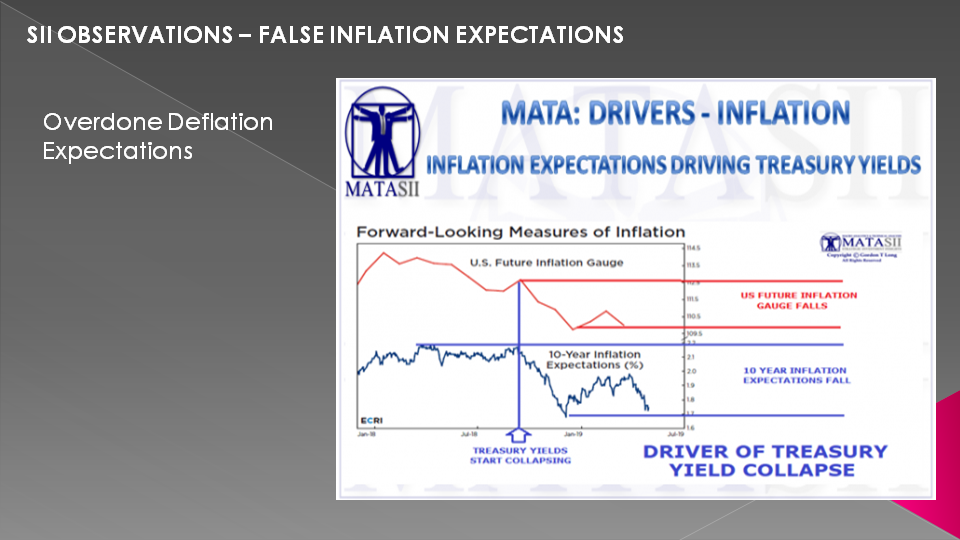
INFLATION: EXPECTATIONS CONTINUE TO BE TAKEN DOWN
All indications to MATASII are for the real possibility of a Stagflation "Shocker”.
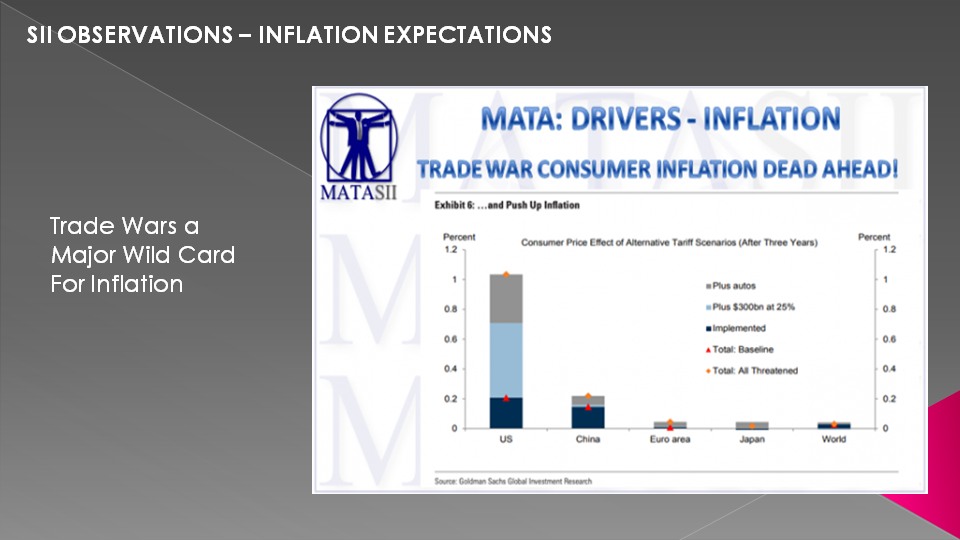
Inflation as we have written about and released Macro Analytics videos on is currently about Service not Goods. Service is Domestic and not normally imported. Goods are global and in the US are dominantly imported.
Service Inflation continues to increase. Soon goods will increase due to primarily trade tariffs and a weakening US dollar (De-Dollarization)
SLIDE 22
DRIVERS: US Dollar Weakness
International Carry Trade Investors typically hedge their holdings of foreign bonds using derivatives as a currency hedge. This allows them to borrow a foreign currency in exchange for their own and lock in a future interest rate. This practice has recently been jettisoned in an attempt to capture higher returns.
This current shift in trend leaves global investors exposed to a falling dollar shock.

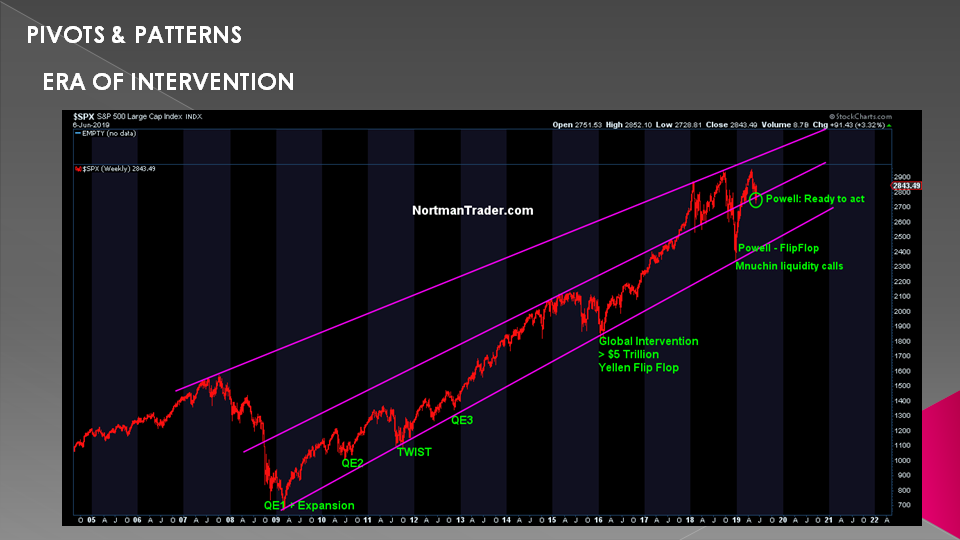
SLIDE 23
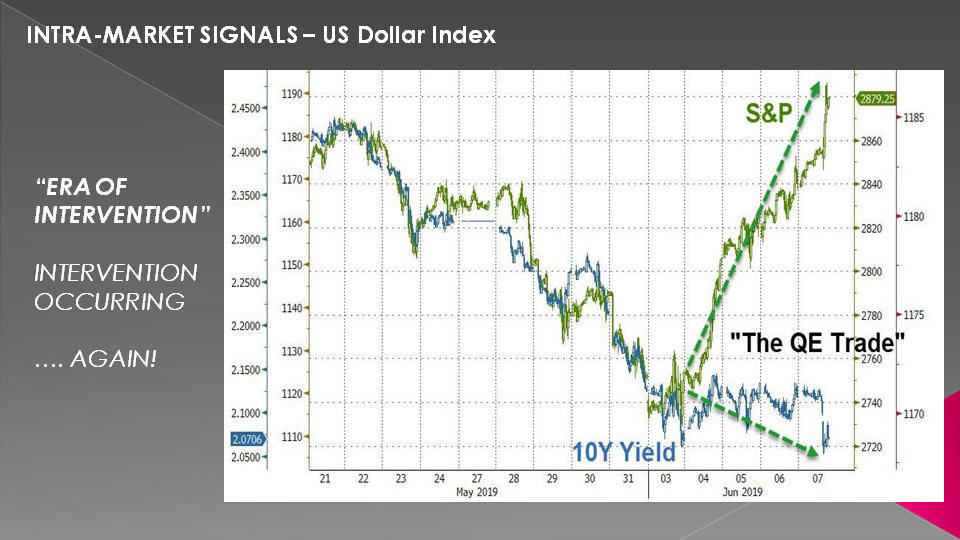
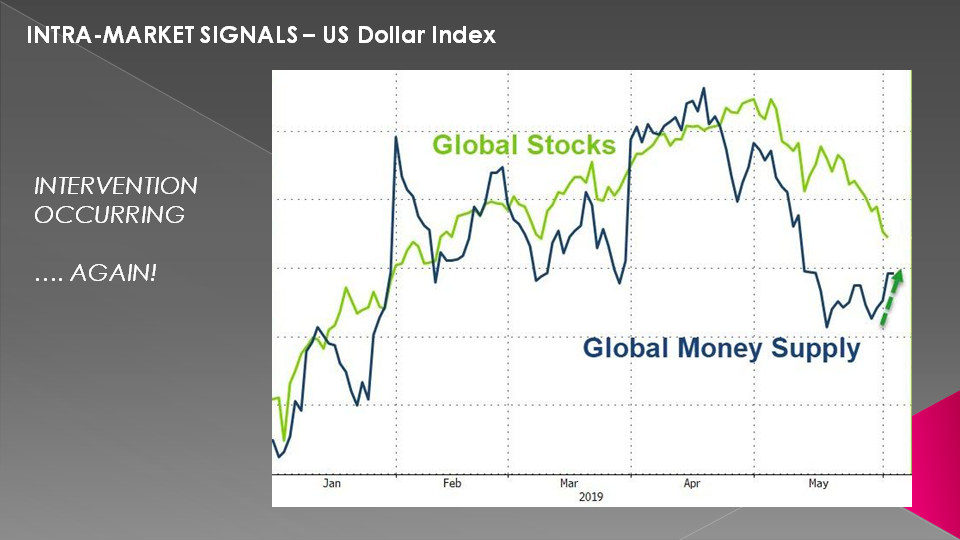
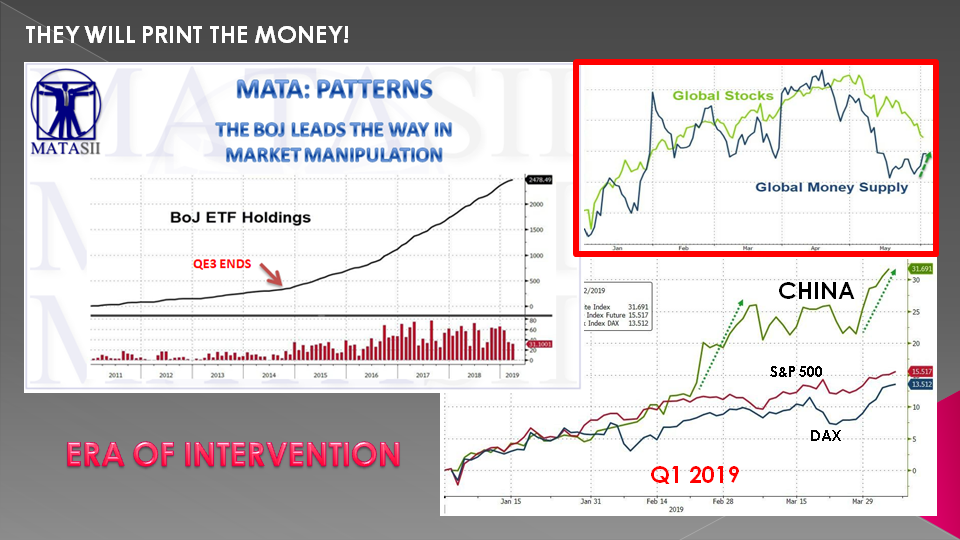
ERA OF INTERVENTION
What is happening now is we have central bank intervention – again.
We strongly believe have entered an era of continuous and sustained market intervention by global central banks. Because of this;
- Lost is the pricing of risk,
- Lost is market price determination and
- Lost is any semblance of sound money.
This is now Advanced Macro-Prudential policy or what was commonly referred to as Financial Repression and will soon be Financial Repression on steroids!
QE, QQE and further untested and unsound monetary & fiscal policies are ahead including MMT and bogus concepts such as "QE for the People"
SLIDE 24
The most recent intervention occurred with the May market lows.
SLIDE 25
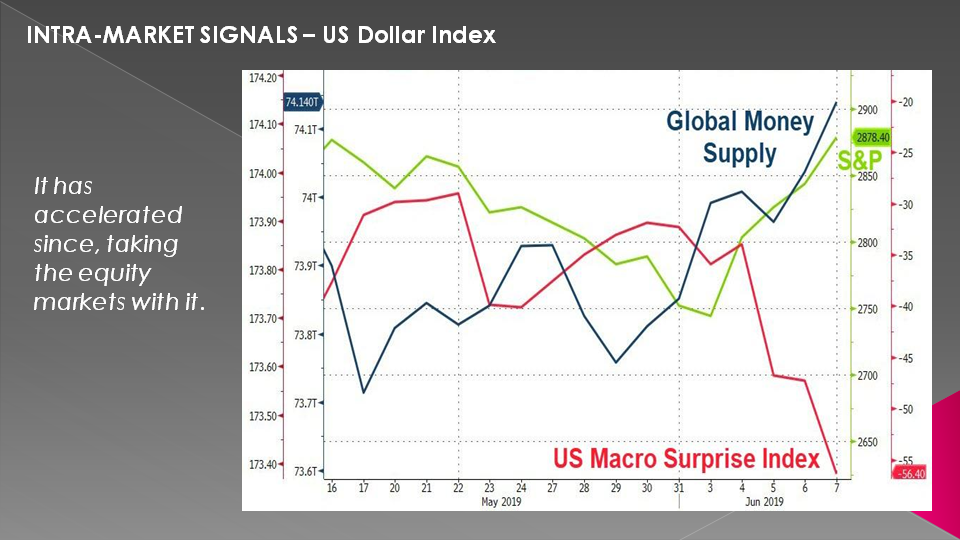
It has accelerated since, taking the equity markets with it.
What drove last week's almost unprecedented surge in stocks? Intervention and 13 Fed Speakers all singing dovishly from the same plunge-protecting hymn-sheet.
Once again, Bad news is good news...
SLIDE 26
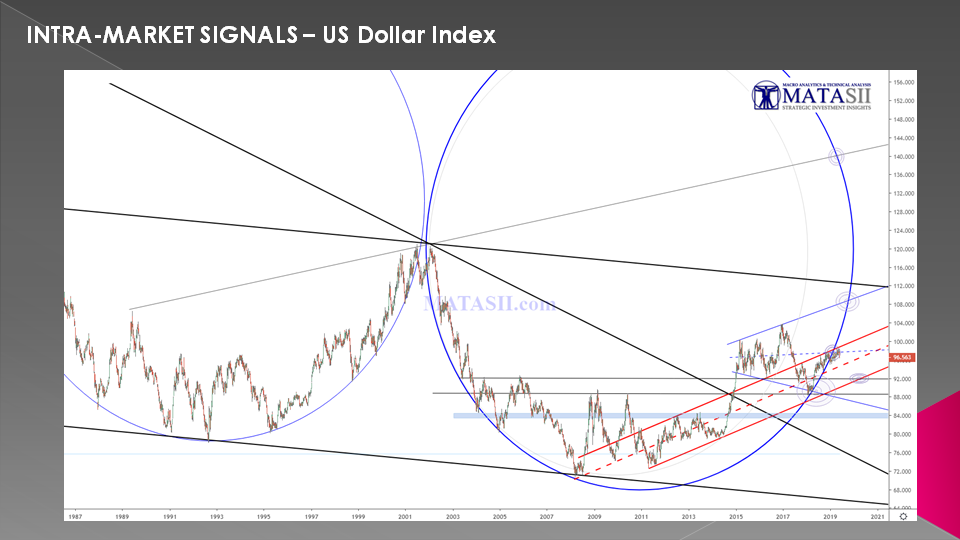
We have been posting this US Dollar DXY chart for a couple of years now. It has been very accurate in warning of US Dollar moves.
Recently, the issue has been whether the DXY continues to follow the ellipse ring higher or separates from it. A separation is most often a warning of the beginning of a falling trend. The DXY has now separated from the ellipse.
The likelihood is for the DXY to fall towards the center-line or bottom of the red channel.
SLIDE 27
The dollar has been experiencing a "flight-to-safety" in the first half of 2019. This may be coming to an end as investors realize that secular and structural forces are beginning to converge on the economy and market, such as the ugly geo- and domestic politics, too much public and corporate debt, and shrinking global trade -- just to name a few.
These problems need to be addressed through structural reform, compromise, and cooperation and cannot be fixed with simple cyclical monetary policies, such as interest rate cuts and more quantitative easing (QE).
The dollar may be the early warning signal for the beginning of this realization.
SLIDE 28
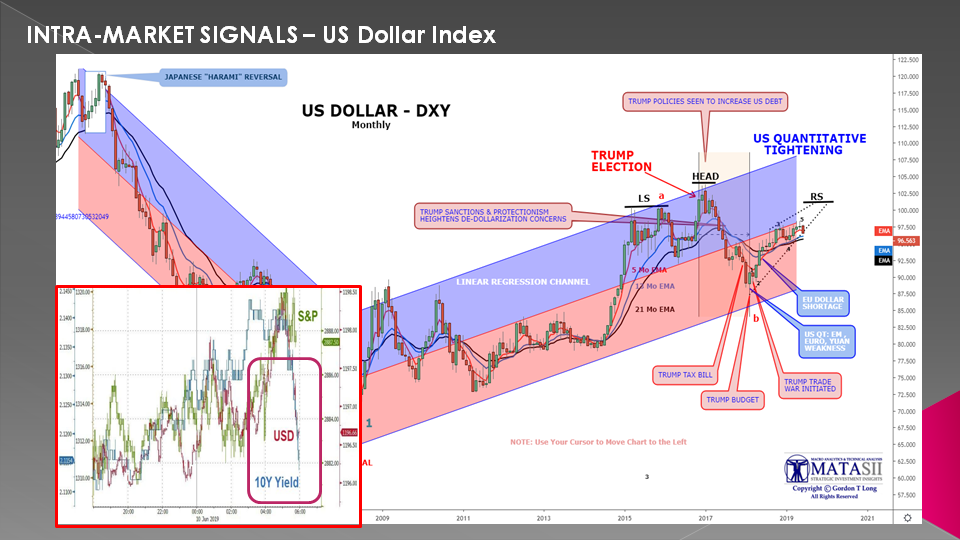
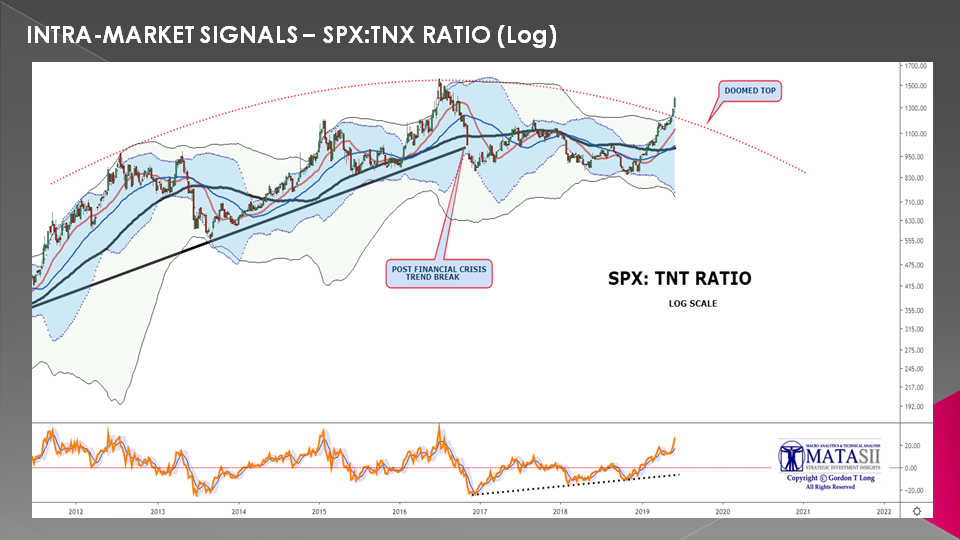
There is obviously more than just that going on as the following S&P 500 versus 10Y US Treasury Note Yields ratio drawn on a log scale shows.
Falling treasury yields associated with expectations for weak inflation and global central bank easing along with a rebounding S&P 500 have pushed our ratio through our "Doomed Top". This is highly unusual and suggests major distortions are occurring along with heavy market interventions and of course accelerating "De-Dollarization".
Our expectations are for a US Treasury yield counter rally which will put in a "right shoulder" before US Treasury yields head lower. This will be the results of:
1- POLITICAL CONFLICT
2- TRADE WAR INFLATION PRESSURES
3- HEAVY UST SUPPLY
4- WEAK FOREIGN BUYING
For more details see our recent post: 10Y US TREASURY NOTE (TNX) HITS MATASII TARGET
SLIDE 29
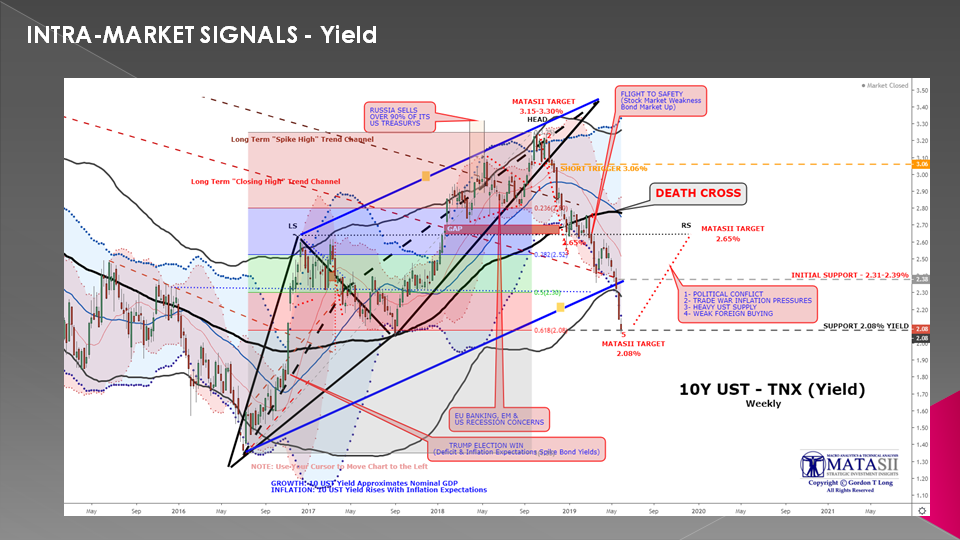
We have hit the MATASII yield target of 2.08% for the 10Y US Treasury Note. This is exactly a 61.8% Fibonacci Retracement.
Note that the recent TNX plunge was technically precipitated by the cross of the 80 WMA (black line) of the 40 WMA (blue line).
WHERE TO FROM HERE?
From a fundamentals perspective the drop is about the plunge in Inflation expectations...
... which is triggered by the drop globally of the 5Y-5Y and 10Y-10Y forward swap rates.
Calls for the Fed to ease policy heated up on Friday after the official non-farm payrolls report showed the U.S. economy had added 75,000 jobs in May, falling short of analysts’ estimate for 180,000. Market Watch reports:
Banks are rushing to cut their year-end forecasts for the benchmark Treasury yield, but Commerzbank might just have topped them all. Here is what they say:
The contention is that once the Federal Reserve embarks on rate cuts, it would move more aggressively than investors expect. Once slowing economic growth and tariff fears force the central bank’s hand, the 10-year Treasury rate would fall toward a record low of 1.25% by year-end, wrote Christopher Rieger, head of rates at the bank. Yields fall as bond prices rise.
“Our Fed view with three 25 [basis point] rate cuts by March 2020 is close to what the market is pricing. Once the Fed begins easing, however, the market will not stop there. Following the comments at this week’s Fed conference, it should account for a scenario of more aggressive pre-emptive steps, which looks set to take U.S. Treasury yields to record lows,” Rieger said.
The us Treasury market is following the global move based on rapidly falling trade statistics and the shift of central bankers to an "Easing Bias".
MATASII'S POSITION
MATASII continues to believe we will now begin to see a counter rally which will put in a "right shoulder" before US Treasury yields head lower as the above contends.
SLIDE 30
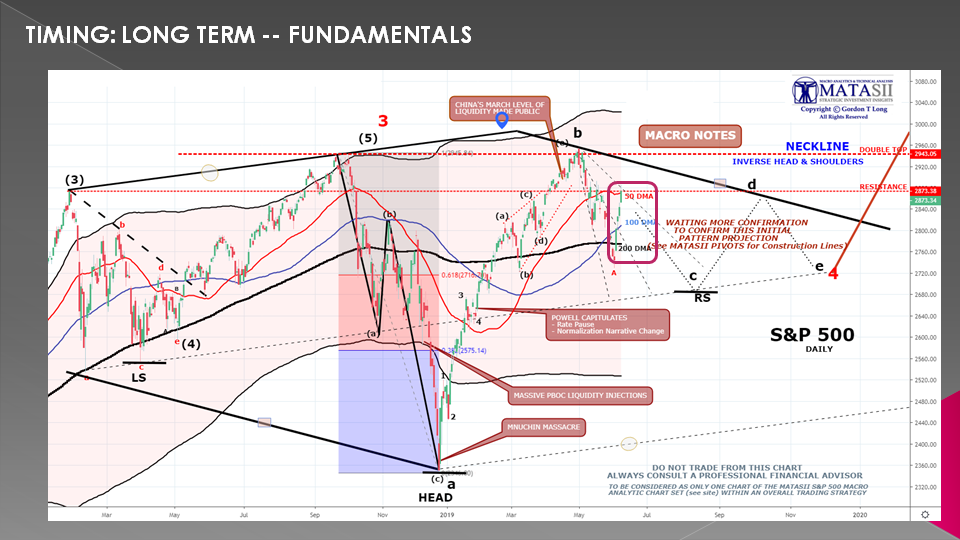
The S&P 500 has now broken back above its 50 DMA.
As you can see we feel this is part of a consolidation pattern with a lower low still ahead.
You will notice we are labeling an inverse Head and Shoulder.
We think there is a real possibility of this with new highs in Q4 above 3040 and possibly as high as 3200.
This would complete the topping process.

SLIDE 31
The DJIA has the same potential.

SLIDE 32
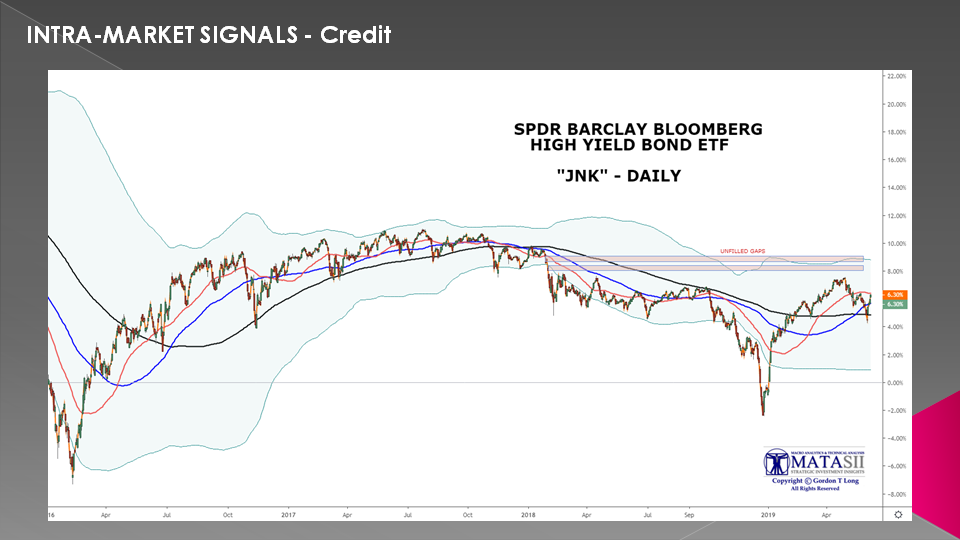
The current strength in High Yield and the availability of credit since the lows give us a degree of confidence in this call.
The 50 DMA is now above the 100 which is above the 200 DMA. This is quite remarkable considering the lows we saw in December 2018.
SLIDE 33
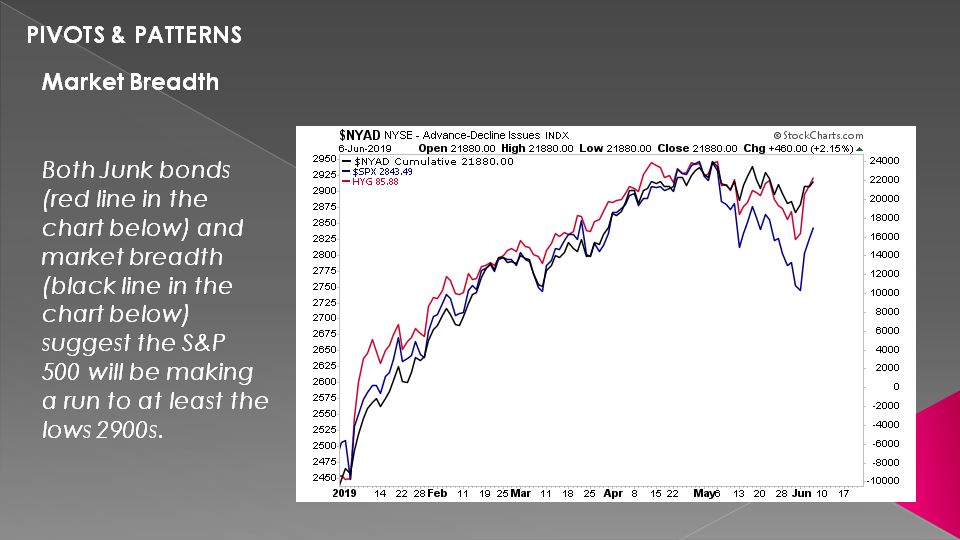
Both Junk bonds (red line in the chart below) and market breadth (black line in the chart below) suggest the S&P 500 will be making a run to at least the lows 2900s.
The big emotional trading drivers for the stock market are hopes of a trade deal between China and the US at the G-20 meeting in Osaka Japan… and hopes that the Federal Reserve will cut interest rates this month.
SLIDE 34
The Fed cannot cut rates with the S&P 500 within 5% of its all-time highs.
Yes, the Fed is now in the stock market promotion business… but cutting rates with stocks above 2,900? That seems a stretch.
Which means... A Crash is coming... But not quite yet.
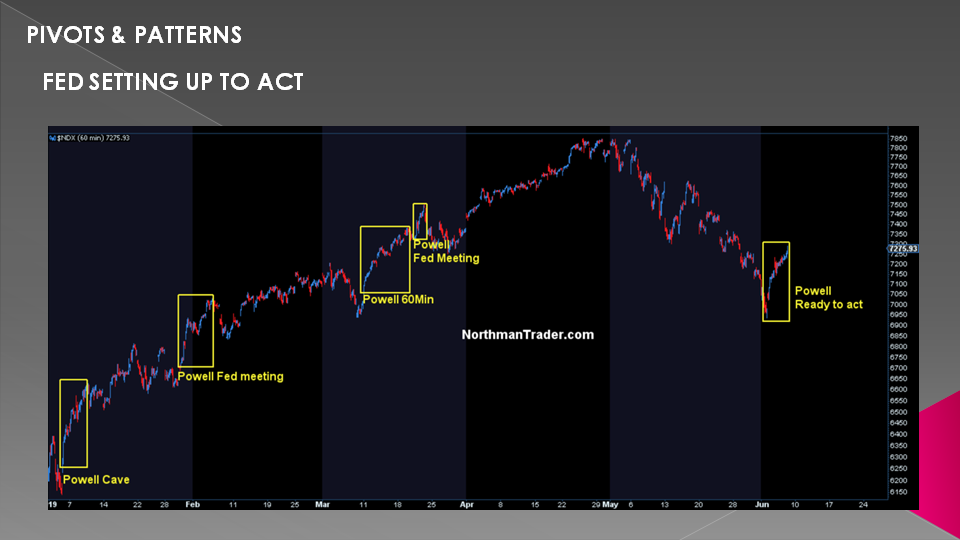
SLIDE 35
Likely starting in late fall, early 2020 as we head for the US Elections.
SLIDE 36
Bringing Fed Open Market Operations (FOMO) back will be with the expectation that this will usher in a new era of record highs and central bankers are once again stepping in at the right moment trying to prevent another key break in stock prices
One is virtually enticed to chase assets again for that big grand finale perhaps.
Not because of earnings, not because of revenues or growth. Because they have to as yields are once again collapsing and central bankers are again promising free money.
As I’ve outlined for quite some time, Stock markets can’t sustain gains or record prices without intervention, without a helping hand, without dovish and intervening central banks. This has been true for 10 years and it continues to be true in 2019 cause that’s where all the big gains are:
This is not capitalism, nor does this ongoing farce constitute free market price discovery. It’s politburo based central planning, desperately trying to keep the balls in the air.
Since when is this the primary purpose of the Fed? What happened to inflation and price stability? Already they are tossing their stated inflation goals and are talking about letting inflation run hotter if they can juice it up. There’s no integrity, only moving targets and carrots driven by equity prices.
SLIDE 37
The pretense is gone, it’s all about keeping the illusion alive that the Fed knows what it’s doing, that it’s always there to save markets from any trouble.
But its track record is obvious: It has failed to meet its inflation targets (ill guided as they may be) for 10 years. It has failed to normalize despite years of promises to do so, and will never be able to normalize. Between 2008-2019 the Fed was non-accommodative for 3 months. It blew up in their faces in December. They’ll never be non-accommodative again. They can’t.
This week investors are happy to chase the coming free money train again. They may well be rewarded for the same gig that has worked for 10 years with the consequences already apparent: Ever more record government, corporate and consumer debt and yes, ever more extreme wealth inequality. Bravo.
Alternatively investors may want to exercise caution in chasing policy failure, but rather keep an eye on technicals that may well point to a different result:
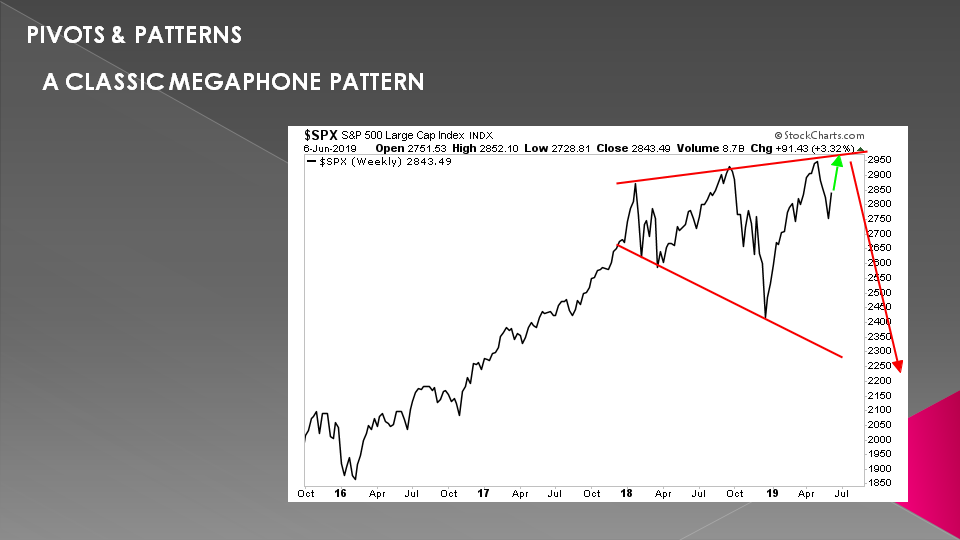
SLIDE 38
The megaphone is quite pronounced.
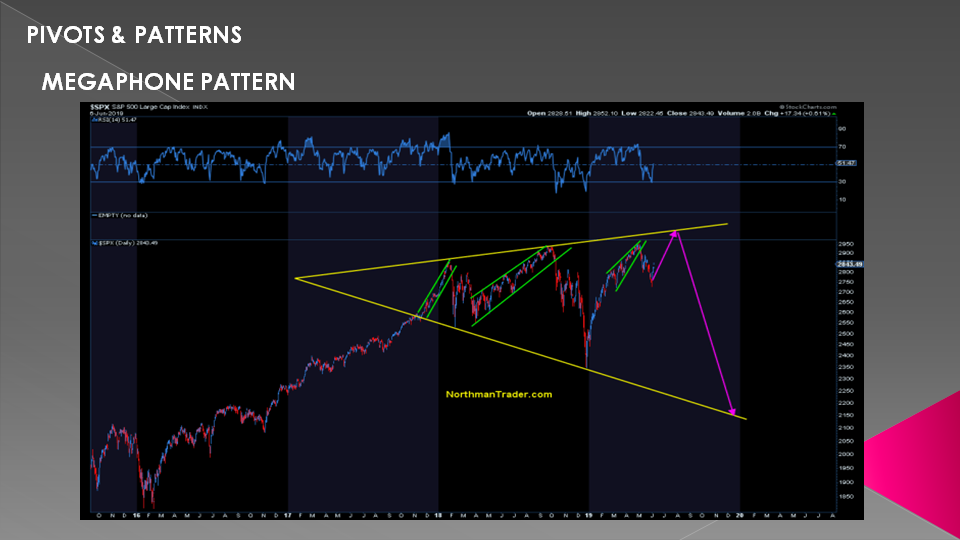
SLIDE 39
But it doesn’t come without short term risk!

SLIDE 40
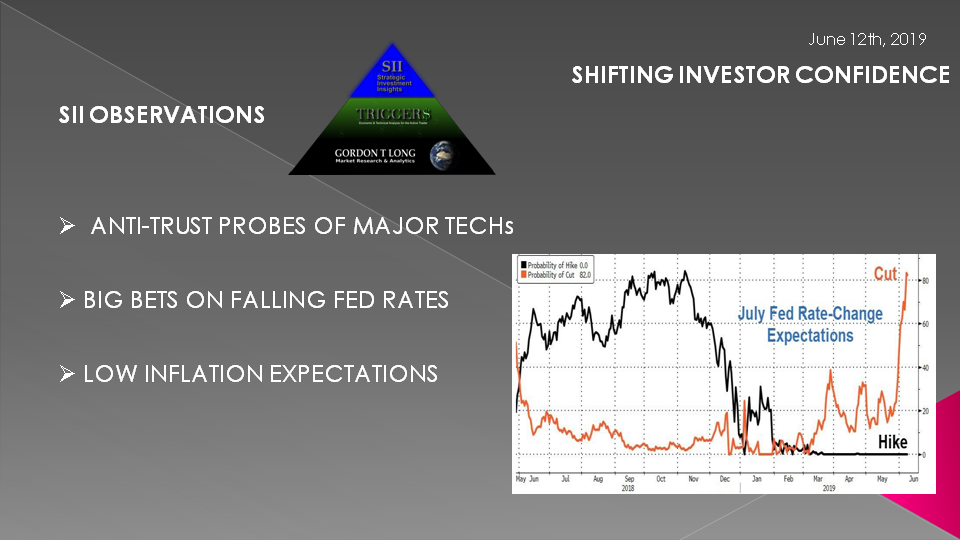
The risk are:
1.ANTI-TRUST PROBES OF MAJOR TECHs
2.BIG BETS ON FALLING RATES
3.INFLATION EXPECTATIONS
SLIDE 41
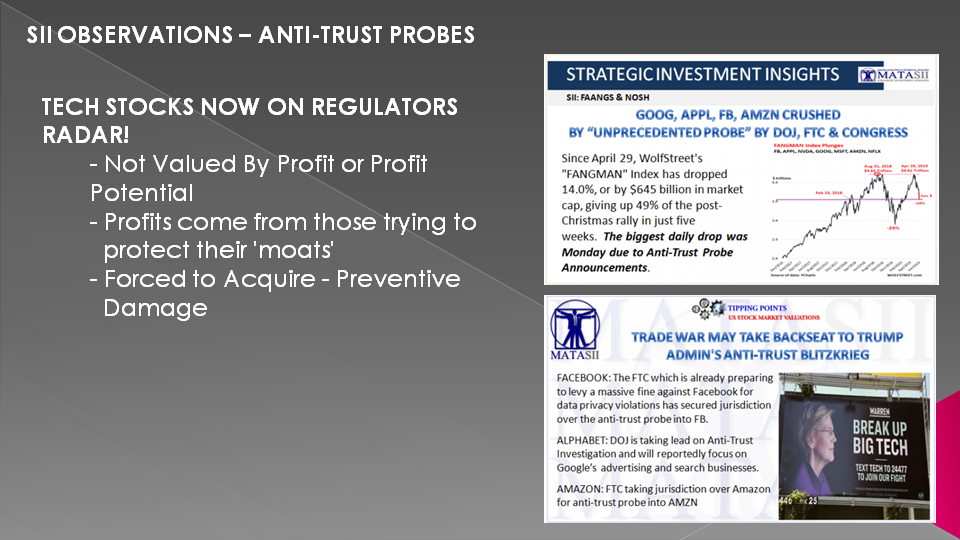
We need to worry about:
1- Tech stocks now being on the regulators and congress' radar!
- Anti-Trust Legislation will be disruptive,
- Tech’s not being Valued By Profit or Profit Potential (Dotcom era),
- Profits come from those trying to protect their 'moats'
- Forced to Acquire to for Preventive Damage reasons
SLIDE 42
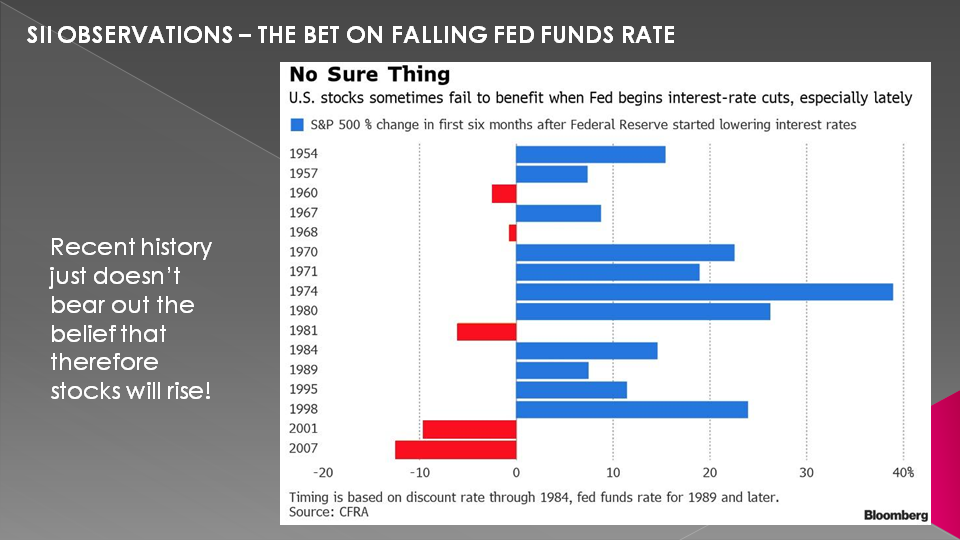
2-A misplaced bet on falling fed funds rate keeping the equity markets from falling,

SLIDE 43
Anticipation that U.S. stocks will rise once the Federal Reserve begins reducing interest rates is at odds with recent history.
Data compiled by CFRA Inc. show the S&P 500 Index fell 12.4% in the first six months after cuts started in 2007. The drop broke a post-World War II record of 9.5% set in 2001, when the central bank’s previous series of reductions got under way.
Declines in the S&P 500 also followed moves toward lower rates that began in 1960, 1968 and 1981. Another setback may happen this time “if the Fed decides to cut rates prematurely,” - at least according to Sam Stovall, CFRA’s chief investment strategist in a report he wrote Monday.
SLIDE 44
3- False Inflation Expectations,
SLIDE 45
Which could change suddenly and dramatically
SLIDE 46
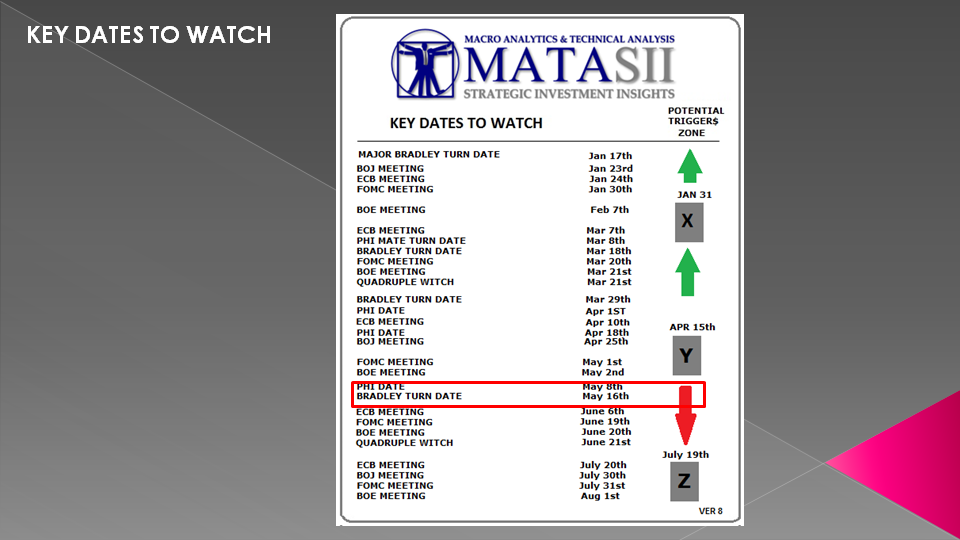
We highlighted these two dates in previous months. They turned out to have signaled the recent highs in the market before the approximately 225 S&P 500 drop in May.
SLIDE 47
In summary we are clearly in an era of on-gong intervention
The central banks are going to do what ever it can to stop a recession
SLIDE 48
Of course they will fail!
But as the Global Systemically Important Banks approach their previous lows expect the intervention to be massive, coordinated and more than just more QE.
QE won’t work this time – but we will save the discussion for another time.

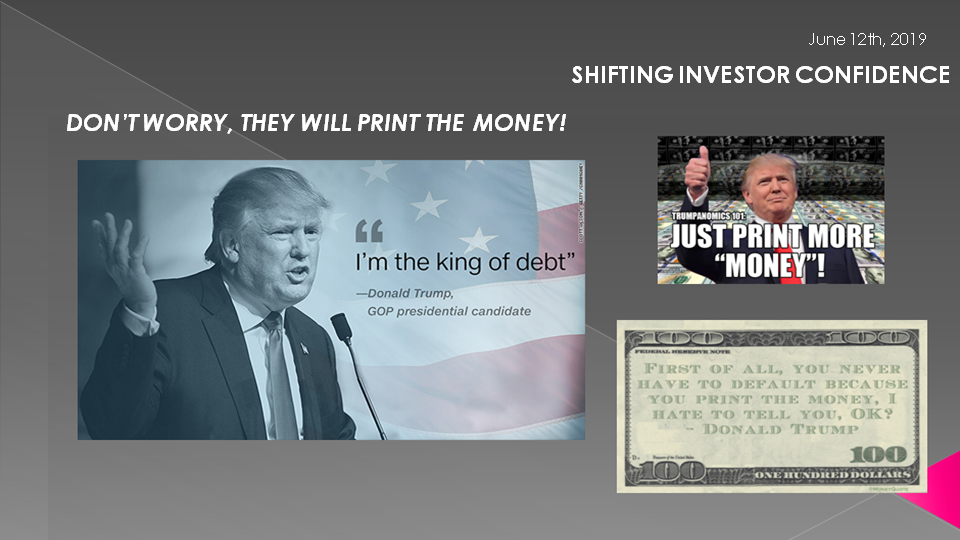
SLIDE 49 - TRUMP
As I always remind in these videos, remember politicians and Central Banks will print the money to solve any and all problems until such time as no one will take the money or it is of no value.
That day is still in the future so take advantage of the opportunities as they currently exist.
Investing is always easier when you know with relative certainty how the powers to be will react. Your chances of success go up dramatically.
The powers to be are now effectively trapped by policies of unsound money and fiat currencies.
SLIDE 50 - DISCLAIMER
I would like take a moment as a reminder:
DO NO NOT TRADE FROM ANY OF THESE SLIDES - they are for educational and discussions purposes ONLY.
Thank you for listening and until next month may 2019 be an outstanding investment year for you and your family.