IN DEPTH: TRANSCRIPTION – REPRICING OF RISK BEGINS
COVER
AGENDA
SLIDE 5
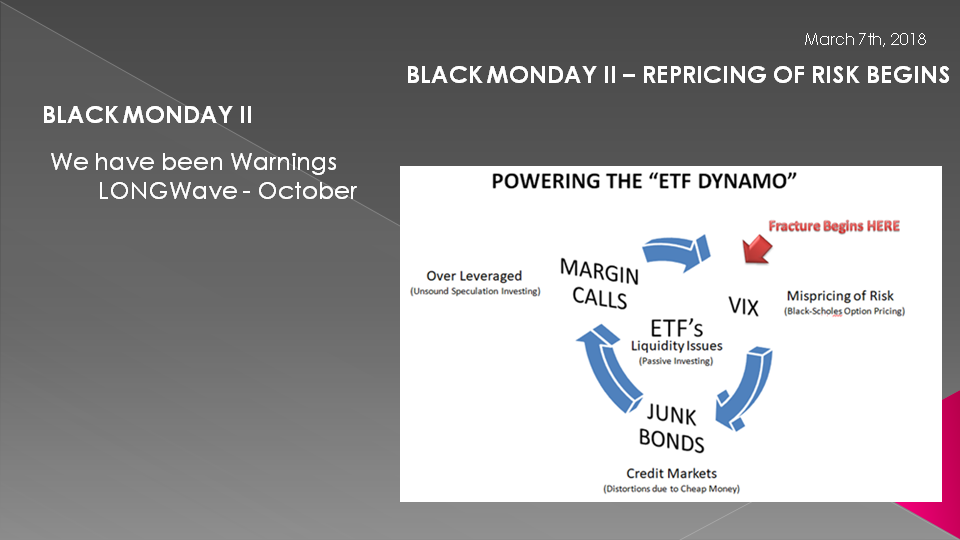
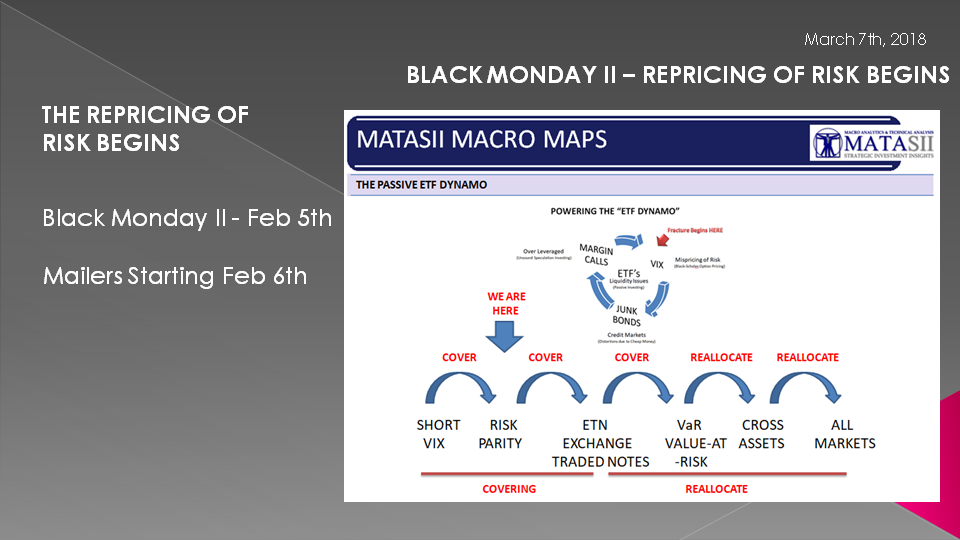
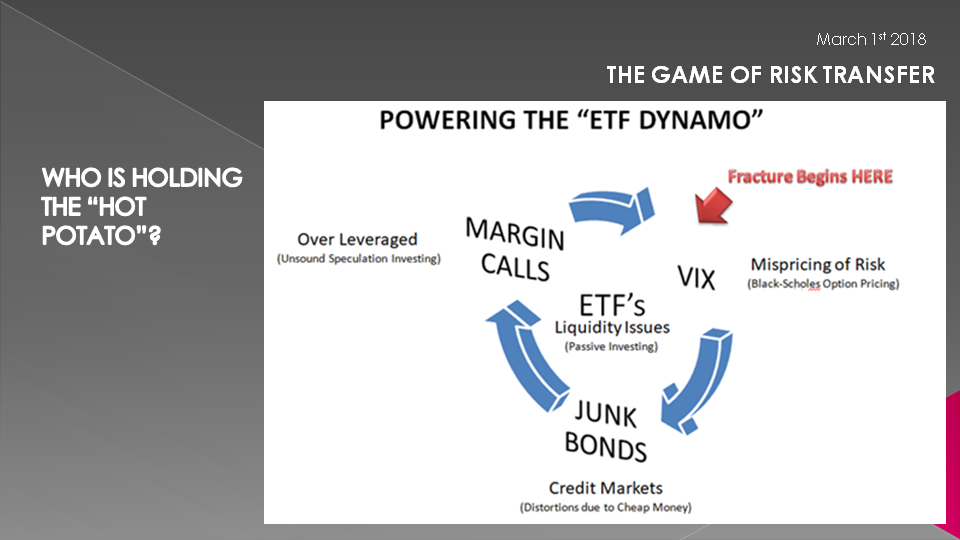
We started warning of the huge problems we saw with volatility as measured by the VIX as part of our October LONGWave video entitled "Powering the 'ETF Dynamo'".
To us, the once "cottage industry" of shorting the VIX was becoming so pronounced and pervasive that we felt any short squeeze would be extremely disruptive to the stock market and possibly trigger contagion effects.
Our analysis indicated it had the strong potential to lead to problems in the Credit Markets and most visibly in the the Junk Bond Markets, who in turn could disrupt the over-leveraged financial markets. This cascading impact wouldn't happen overnight but would likely be a steady progressive breakdown (like a dam with enlarging cracks appearing) before rupturing into something globally systemic in scope.
We feel this is exactly what is underway now, even though the markets on the surface may have calmed down since Feb 5th.
SLIDE 6
On February 6 (the day after what we labeled "Black Monday II") we initiated an almost daily MATASII mailer on what we perceived was unfolding and how it would likely progress going forward.
The stages had a lot of new acronyms that we discovered few had heard of or were familiar with. We have discovered that in every crisis event which we have witnessed since 1987, a new list acronyms emerge which are at the root of the new financial crisis. In every instance the public had never heard of these acronyms since they had been kept from the public eye as "too technical" for the "unsophisticated". Meanwhile they had grown quietly, like a malignant, undetected deadly cancer. It always turned out however that those who paid the biggest price were in fact the "unsophisticated" or more specifically the "unsuspecting'!
SLIDE 7
MONETARY MALPRACTICE
I drew this illustration, not long after the last Financial Crisis, as we were witnessing the emerging approach the Federal Reserve was taking to its' resolution of the 2008 Crisis. The last update of the diagram was in 2012 (note the 2012 copyright at the bottom) as "Quantitative Easing I" was initially rolled out.
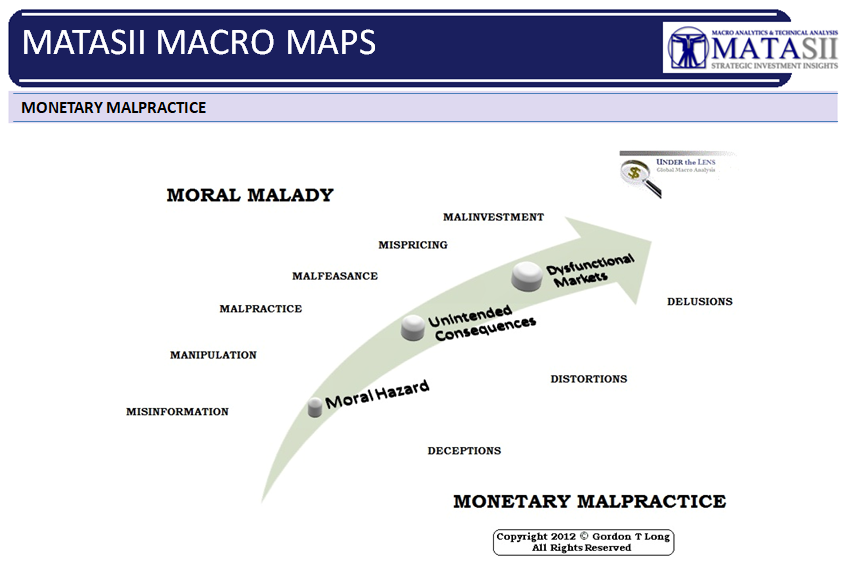
The graphic has stood us in good stead in recognizing what was to be expected going forward. The Federal Reserve had effectively "papered over" the problem during the crisis by initial policies "of kicking the can down the road". As a consequence this subsequently lead to other policies which we concluded could not be described in any other terms but to "Monetary Malpractice".
As a direct consequence of the Moral Hazard and Unintended Consequences of these policies, the increasingly dysfunctional markets delivered new phenomenons which we then fully expected to emerge as a consequence. We weren't sure what imaginative new financial engineered approaches the Wall Street money maven would concoct - only that we could be assured that it would happen behind the curtain.
SLIDE 8
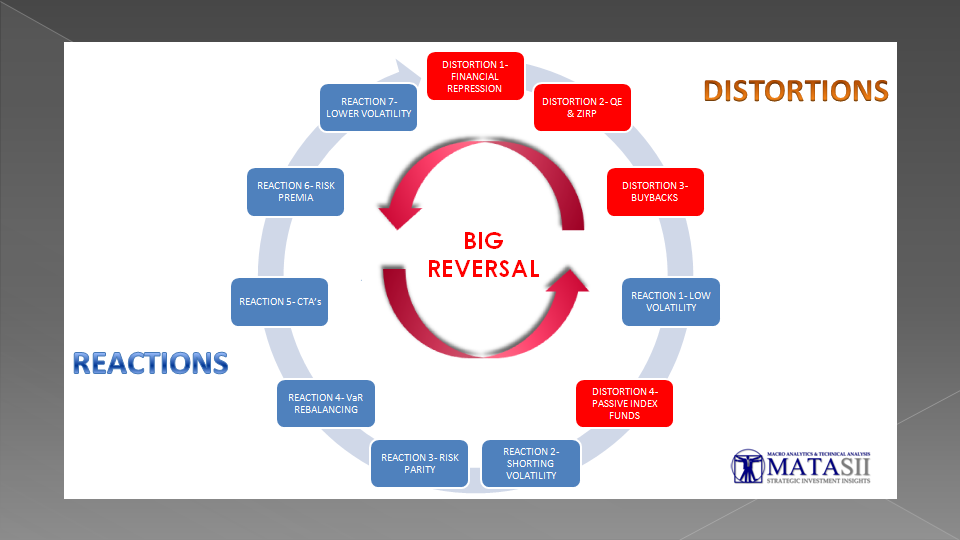
A SELF-REFLEXIVE FEEDBACK LOOP
What has emerged is a dangerous "self-reflexive feedback loop" which exists between:
- Central Bank stimulus,
- Sustained Ultra-low interest rates,
- False Data Signalling,
- Asset Volatility and
- Financial Engineering which is both pricing and allocating risk based on that volatility.
This is leading to what more and more analysts are recognizing as a "self-reflexive feedback loop" where lower vol. feeds into lower vol. (abbreviation: Volatility) and has resulted in vol across asset classes being at multi-generational lows. The "Short vol" trade has become a dominate strategy for a very large segment of market participants. "Short vol." is now effectively an investment asset class estimated to be over $2 Trillion globally encompassing various Financial Engineered equity product strategies.
Unfortunately this loop, as so many loops do, often reverse violently. A number of unexpected market shock (such as higher inflation) can abruptly trigger this. The higher vol. that would occur would then in turn reinforce higher vol.. This mew asset class is now a massive, misunderstood risk in today’s market environment which is not being correctly priced in.
SLIDE 9
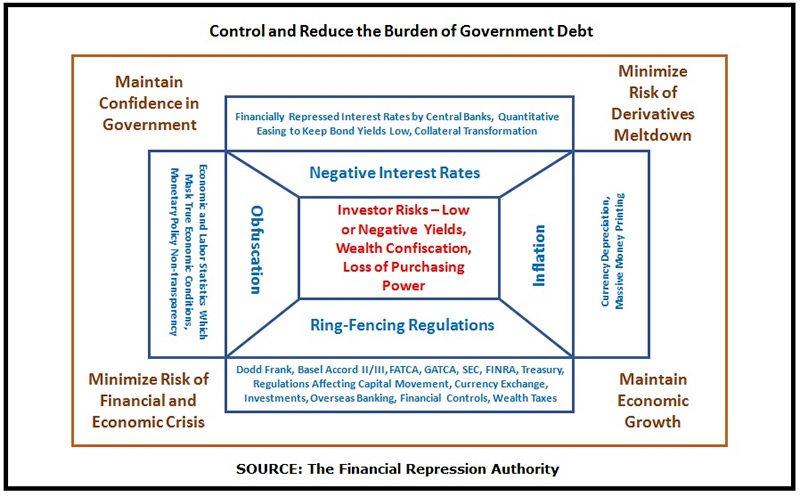
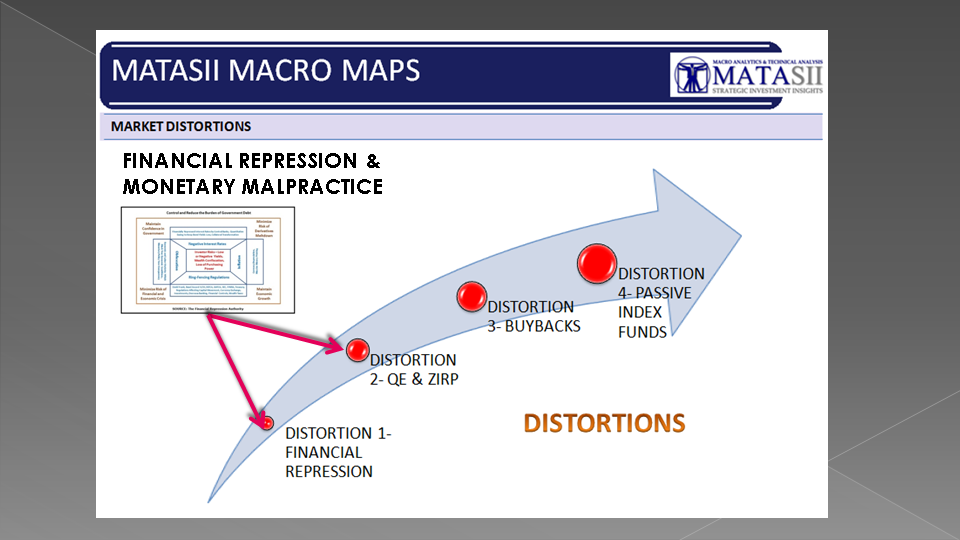
FINANCIAL REPRESSION
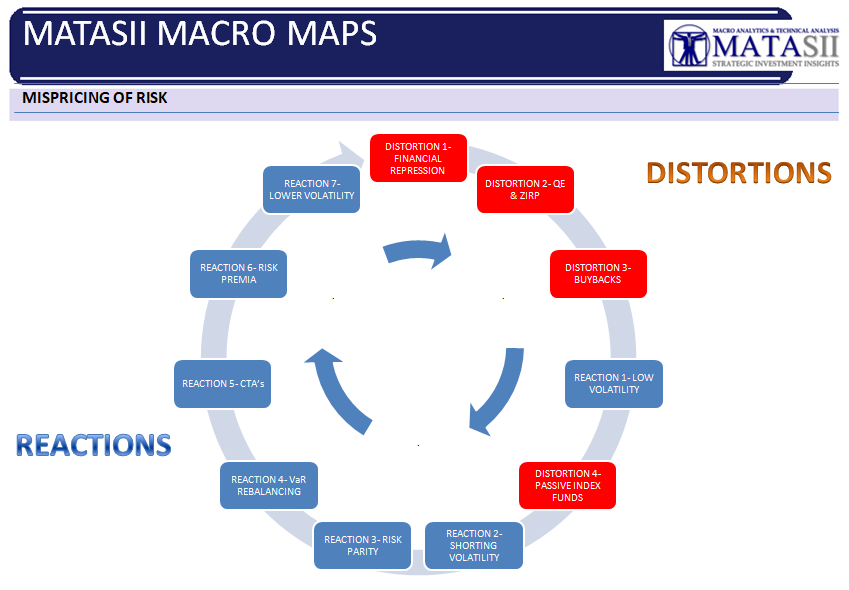
The Distortions all began with central bank stimulus which itself is only one element of the Macro-Prudential Strategy of Financial Repression aggressively pursued since the mid 1990's, whereby the public more recently has been forced to accept increasing levels of financial risk as the natural rate for bond yields is artificially suppressed by policies of Quantitative Easing, ZIRP & Operation Twist.
The Moral Hazard which has emerged is the mistaken belief that the Central Bankers will always be there to support markets. Investment Strategies peddled to Insurance Companies, Pensions Plans, Endowments and Family Offices have been built on this foundation.
SLIDE 10
Suppressing volatility, which we will explain how it occurs in moment , does not mean risk has vanished; rather, it means that risk is increasing as accurate information on systemic risk is being suppressed. The global financial system as a consequence is becoming increasingly fragile and thus more prone to collapse, and an artificially low measure of volatility assisted by the Federal Reserve doesn't change this reality.
In fact Fed Chairman Jerome Powell surprised many during recently released 2012 FOMC Minutes as well as his February Humphrey-Hawkins testimony when he referred to the Fed reducing its "short vol" positions. What is the Federal Reserve doing holding "short vol" positions than other it being just another Financial Repression policy to manipulate markets.
Though Central Bankers policy has been the creator of the distortions which has fostered this self-reflexive cycle don't doubt for a moment that it will sacrifice the equity markets and reverse its position in a "heartbeat" if the Debt Markets are in trouble. This is a mounting concern today as the Debt Super Cycle completes its final stage, with interest rates having reached their lowest levels in recorded human civilization and $10 Trillion in bonds trading at negative yields.
SLIDE 11
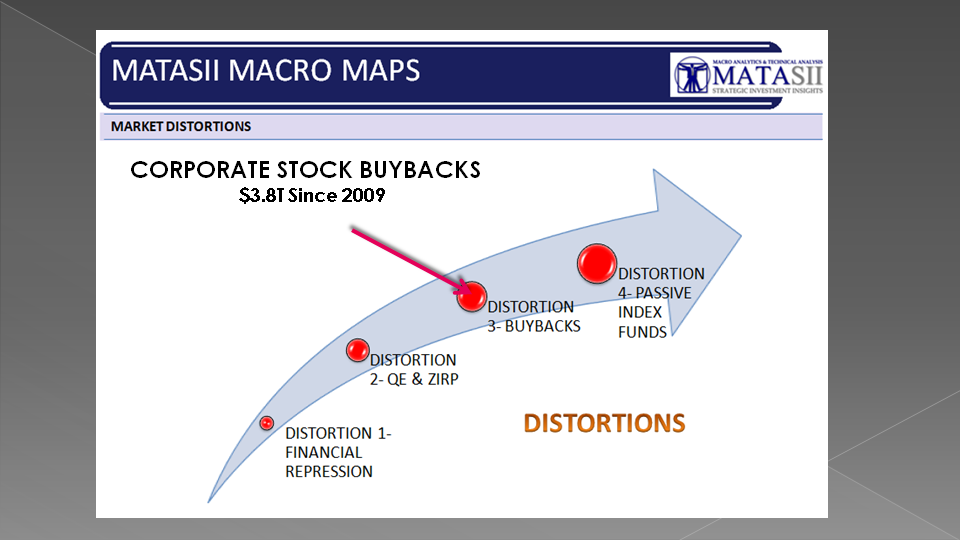
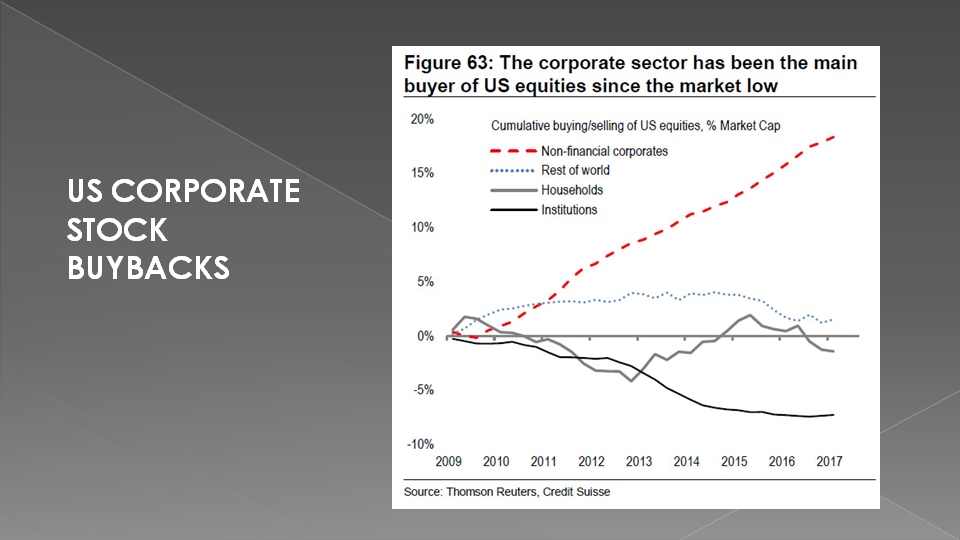
CORPORATE BUYBACKS
- The Central Bank Policies of QE brought Demand Forward but maybe more damaging, unleashed the Global Supply Chain to unprecedented levels of over-capacity and fostered reduced Pricing Power,
- Additionally, excess liquidity and easy abundant credit has lead to excess Investment Capital resulting in over-priced asset acquisitions.
As a result, Corporations have found that it’s not very efficient to reinvest in human capital, or CAPEX (Capital Investment Expensive). Instead they are literally "eating themselves" as they buy back their shares. Corporations for the past 6-7 years have been levering their balance sheets by taking on cheap debt to buy back shares and pay out shareholder dividends. It is conservatively estimated that 1/3 of gains, or about 30% of the share price gains, since 2009 have come from the share buyback phenomenon. We would already be in an earnings recession if it was not for share buybacks and this mistaken "indicator signal" of PE growth based on earnings per share outstanding.
The fatal system flaw this Distortion has created is a price-insensitive buyer that is always there to buy back the market. This "floor" has removed perceived risk and destroyed realized volatility. In effect the stock market is cannibalizing itself quite literally, and this is having a pronounced effect on lowering vol.
But one of the things we’ve been seeing is that every single time volatility jumps it mean reverts immediately. We’ve had some of the most mean-reverted markets in history. That’s actually quite unusual because volatility tends to cluster. This has been driven by some of the effects of share buybacks.
SLIDE 12
So, beyond the blatant overvaluation of the market, and the fact that price multiples are driven by buybacks – Price-earnings ratio is still something that people put out there and say, oh, the stocks are not that expensive on a price-earnings ratio or P/E growth ratio!
If you look at:
- Market capitalization to GDP ratio,
- Enterprise value
- EBITA ratio
- Price-to-Sales ratio
and other ratios, a lot are affected by the buyback phenomenon or funnel through like enterprise value & EBITA ratios. We are seeing across all these multiples some of the highest overvaluations since 1928, 2007, and the late ‘90s.
So, really, the buyback phenomenon leads to a situation of a greater fool where the market keeps going up and up and up, quashing volatility.
If we end up seeing a collapse in buybacks – either due to rising interest rates, which would make it unprofitable for companies to continue to do this phenomenon – if we see a situation where there is some shock to the system and/or credit ratings of companies begin to come into peril as a result of rising interest rates and are not willing to continue to issue shares to buy back their debt – then the buyback dynamic may perilously stall.
SLIDE 13
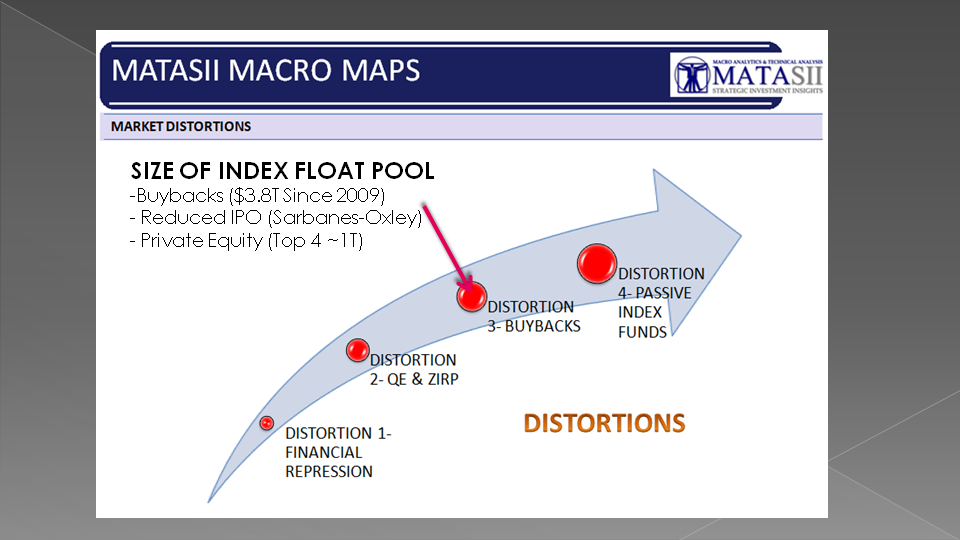
THE SIZE OF THE FLOAT POOL
But there is more going on than the mere size and reasons for corporate stock buybacks. It is actually in my mind about the diminishing size of the Tradable Float Pool of major index stocks.
For example over the last few years there have been diminishing numbers of secondary offering by corporations in the major indexes, as well as an almost complete disappearance of IPO's adding to the overall available stock pool. IPO's in the US since the hideous Sarbanes-Oxley legislation appear to have become a quant perturbation of the Dotcom era.
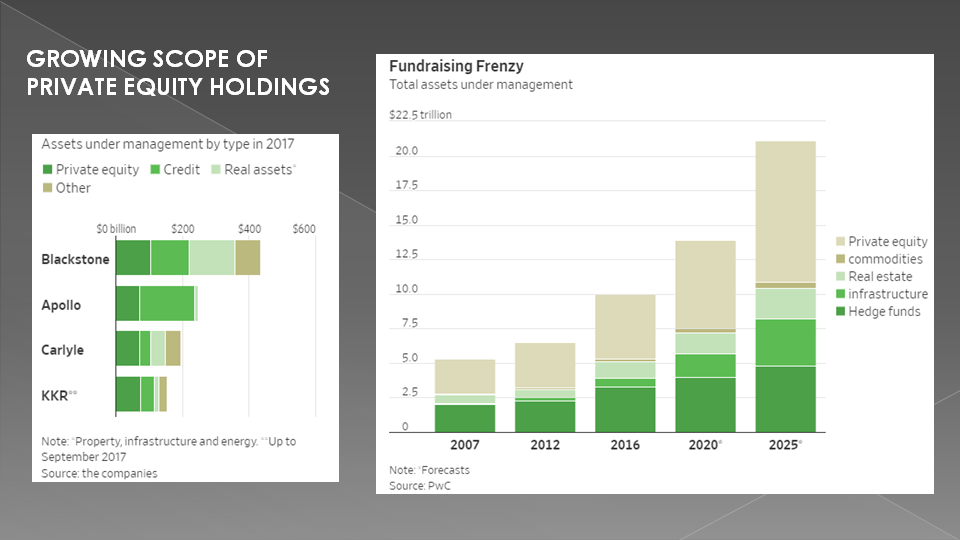
Even more staggering is the size and scope of Private Equity stock ownership making the purchased stock unavailable for public trading and further adding to the Distortions driving the emergence of Reactive Strategies.
SLIDE 14
Few appreciate that the Top 4 US domiciled Private Equity Firms are now managing close to $1T in assets and the industry overall will approach $6.4T within two years.
I am told by reliable sources that Private Equity now controls the stock of over half of all companies listed in the S&P 500 Index.
We will come back to to the subject of Share Buybacks in a moment when we discuss the "Implicit Short Volatility Trade".
First however lets consider the scope of the "Explicit Short Vol Trade" itself.
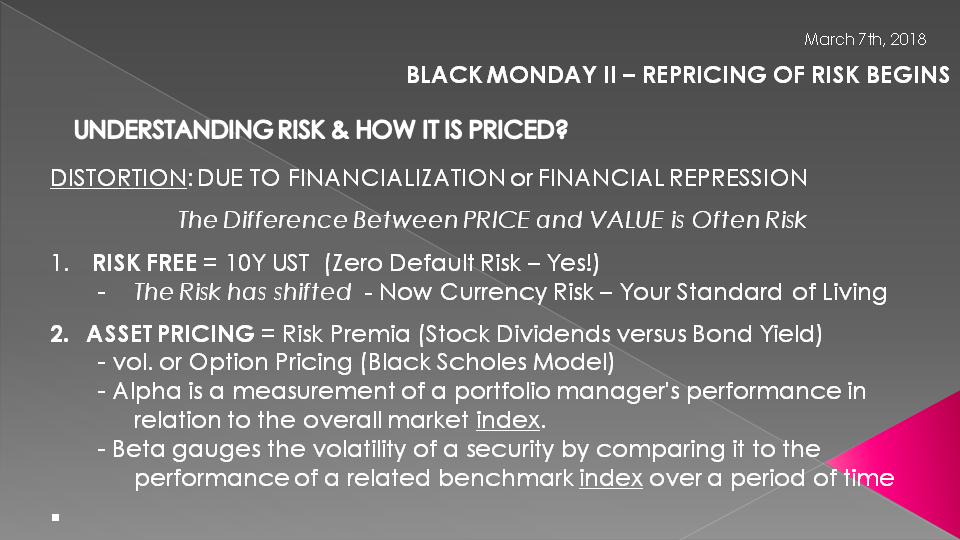
SLIDE 15 UNDERSTANDING RISK & HOW IT IS PRICED
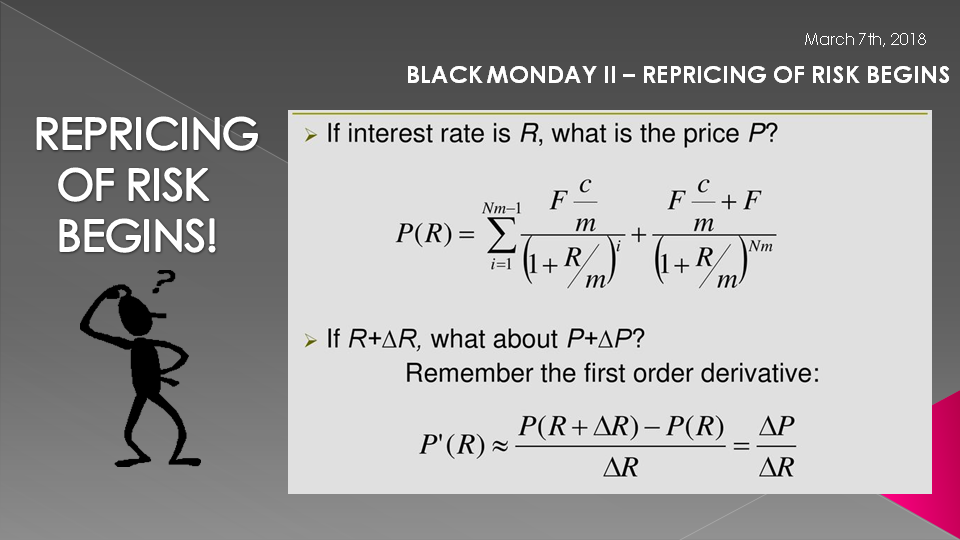
I personally don’t believe the public understands the risk in today’s markets because for starters they don’t understand the financial mechanics of RISK and certainly risk as an integral part of the financial markets and how it is priced in.
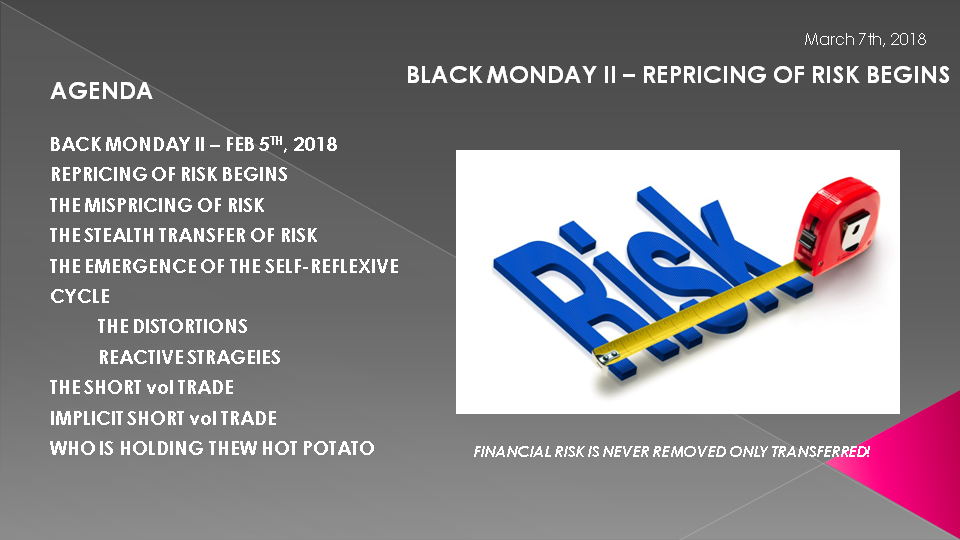
As most are aware, there is a big difference between Price and Value – often (and more so today than ever) that difference is the "element" of misunderstood RISK.
Risk can and is often cleverly hidden. However never forget – financial risk can not be destroyed – it can be only transferred.
Traditionally, around the globe, risk is priced against what has long been considered the benchmark for a risk-free investment - the 10 Year US Treasury Note. The held belief is that the US Treasury would never default on its debt obligations and as the world's Reserve Currency could always print whatever it needed to meet its debt payment obligations. This widely held belief stems from the per 1971 era of a gold backed US dollar. In today's Fiat based currency regimes, the risk in the risk free 10Y UST is Currency Devaluation Risk!
But the risk is much greater than currency risk. Central bank policies of Quantitative Easing are actually about creating that currency which is used to buy USTs in the open market. Such policies drive down yield from the natural rate (or should we say un-manipulated rate) to a lower rate depending on the artificial buying pressure created by the central banks. These rate, until very recently were at historic low levels. The difference between the natural rate and trading rate is risk. Risk that the central banks might stop buying and bond yield would return to its natural rate.
This is precisely what the Federal Bank are now doing with Taper and Normalization policies. As bond yields are now rising their price is falling. Holders of UST are taking a major financial pounding as the bond bubble begins to deflate. Never for a moment forget that Bond values underpin a huge amount of collateralized loans underpinning global financial leverage.
Additionally and separately, asset prices are traditionally connected to bonds through the relative value of stock dividends and bond yields. Money flows where it is treated best once the premia for relative risk is factored in. That risk premia is based on volatility where volatility in turn is used to price options value which in turn is used to hedge. Beginning to see the potential flaws?
SLIDE 16 UNDERSTANDING RISK & HOW IT IS PRICED - DISTORTIONS
Everything is connected but unfortunately manipulated by the distortion in and mispricing of risk, along with a startling lack of price discovery.

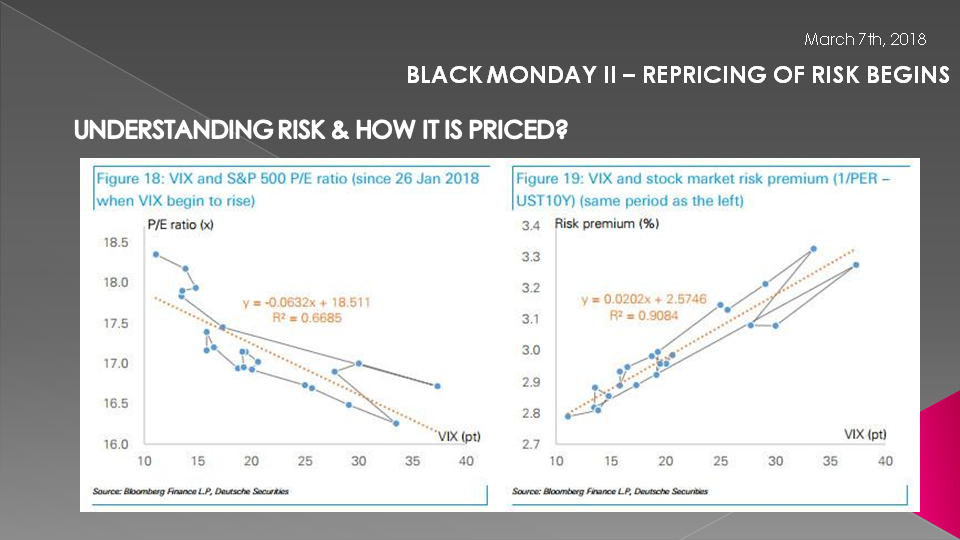
SLIDE 17 CHART #18-19
Today the price of stocks is less and less a matter of their fundamentals but rather their volatility. Example after example shows the extreme correlations that are occurring.
SLIDE 18 CHART 5 & 17
Whether stocks or bonds. Volatility has become the cornerstone of asset pricing.

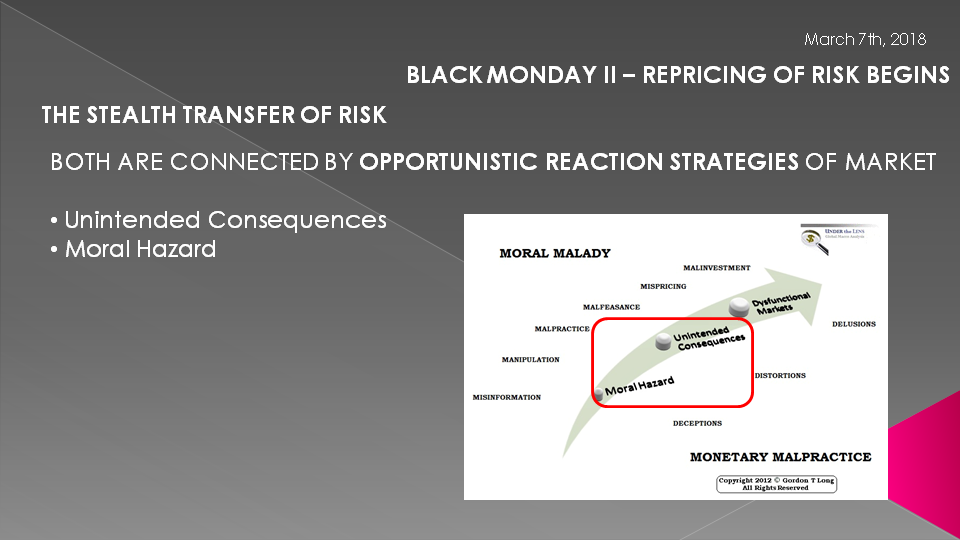
SLIDE 19 STEAL TRANSFER
Both are connected by rapidly evolving "opportunity reaction strategies" of the market. All these relatively recent strategies spring from the Unintended Consequences and Moral Hazard of Central Bank Policy.
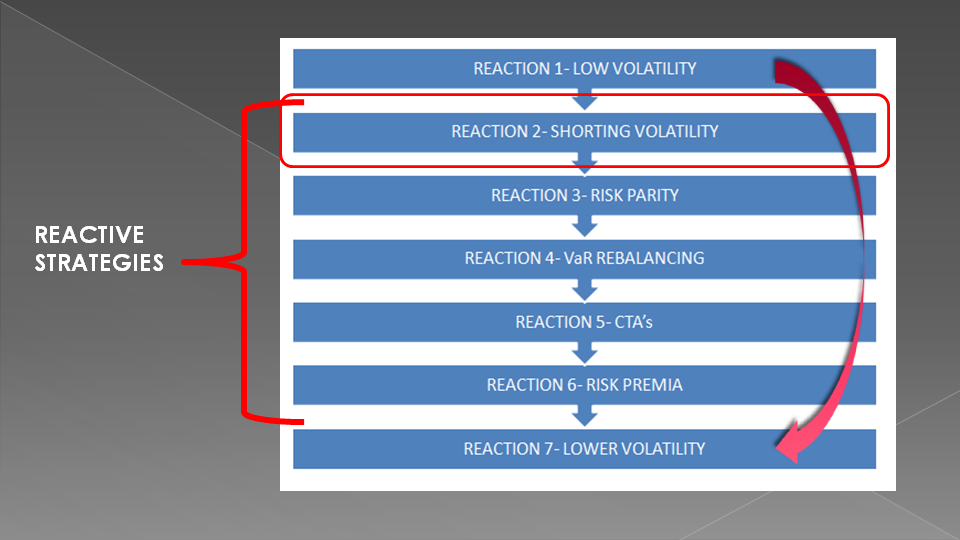
SLIDE 20 REACTIVE STRATEGIES
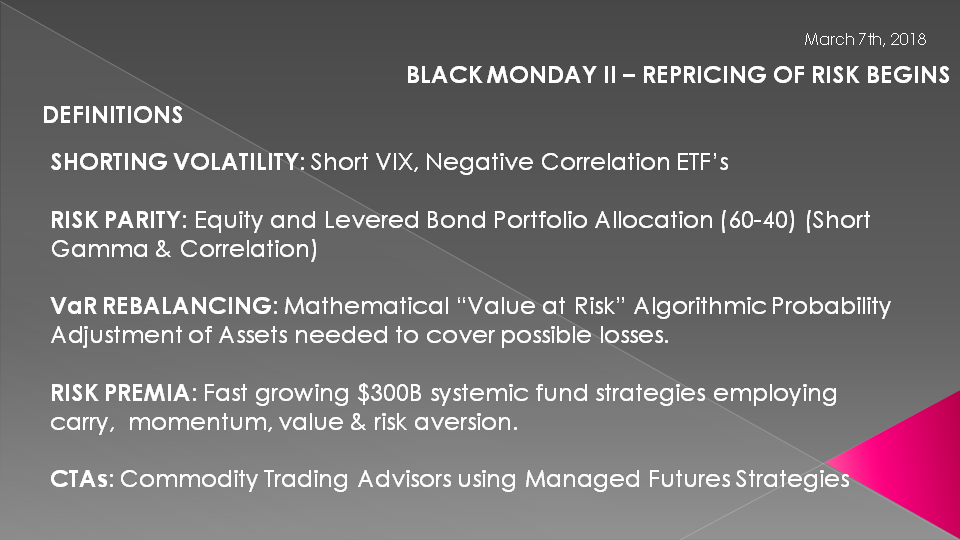
SHORT VOL TRADE
This has led to the out-performance of:
- Short volatility trades.
- Passive funds and indexation.
- Various strategies that use financial engineering in some way to bet on market stability (introducing a kind of a short Gamma effect into the market). These could be strategies ranging from everything from risk parity to vol-rebalancing funds.
This is all great as long as volatility is low or dropping, as long as markets are stable. But, in the event that we have a reversal in this, there’s two trillion dollars of equity exposure that self-reflexive-driving lower vol can reverse in a quite violent way.
If you look at short volatility and you think about what volatility really is – it’s a bet on stability. And when you’re betting on stability, that’s a myriad of different bets. Part of that is the expectation that markets remain low volatility or low realized volatility. Part of that is short Gamma – so there is this implicit short Gamma exposure.
Part of that is a bet that:
- Correlations remain stable,
- Or that different market relationships remain anti-correlated with one another,
- Or that implied correlations are dropping,
- Or interest rates remain low or go lower.
So if we look at each of these different factors, these are the risk exposures that you will have when you own a portfolio of short options. And, if you own a portfolio of short options you are
short:
- Vega,
- Gamma,
- Correlation,
- Interest rates.
What we’ve seen now with this short-vol trade, explicitly and implicitly, is that various financial engineering strategies out there that have become dominant in the marketplace – we’re talking about the largest hedge funds in the world employ these strategies – that are just replicating the exposures of a short-options portfolio. And of course the VIX trade gets a lot of attention, but it’s the smallest portion of the short-vol trade. This is what is called explicitly shorting volatility. This is where you’re literally going out and you’re shorting an option. Or you’re shorting a volatility future. But in the VIX space, that’s only about $5 billion worth of short exposure. You have about $8 billion of vol-selling funds, according to Bloomberg. And then about $45 billion (estimated) in pension over-writing strategies, these short-port or short-call strategies the pensions are doing.
So, in total, there’s about $60 billion of explicit short volatility. Which is big. But that’s not the most concerning aspect.
SLIDE 21
THE BIGGER IMPLICIT SHORT VOLATILITY TRADE
The bigger aspect is this $1.4 trillion in implicit short volatility strategies. These are replicating the exposures of a portfolio of short options, even though they may not be directly selling derivatives or directly selling optionality.
These Reactive strategies have been profiting from and supporting Low Volatility at the top – moving too even lower volatility at the bottom.
The game of shorting volatility is so large that insurance and pension plans have been spiking their returns by employing various strategies shown here.
I read awhile ago about a guy quitting Wal-Mart to short the VIX and had made $4M from next to nothing in seed. When interviewed he knew nothing about volatility except the strategy just kept working!!

SLIDE 22
For example, we have about $600 billion worth of risk parities out there. Equity exposure to risk parity. Risk parity is a strategy that’s short Gamma and short correlations. We have about $400
billion of vol-control funds out there. That’s a short Gamma strategy. About $250 billion of risk-premium strategies. And then there’s the equity exposure of CTAs.
So, these are strategies that have elements of short-volatility trade embedded in their equity exposure.
SLIDE 23
This chart breaks these strategies into two groups along with Share Buybacks as a separate third reactive strategy. You can see here how large some of them are.
The top of the pyramid are Explicit Short vol Strategies
The Middle tier are Implicit Short vol Strategies
The Third Tier being Share Buybacks which are effectively putting a floor under the market and by doing this are effectively reducing vol.
What is happening is that each layer is feeding off the preceding lower tier
Corporate Buybacks
At the bottom of the short-volatility trade is the $3.8 trillion worth of share buybacks that have occurred since 2009. One might look at share buybacks and say, wait a minute, that is not a financial engineering strategy. That’s not a short-volatility strategy. But let’s think about what share buybacks do.
If you’re a corporate CEO, you don’t have the ability to generate growth. You can’t generate sales. And you want to get your bonus. So if you can’t generate earnings, if you can’t help your top of the line, what you can do is reduce the number of shares. And this will artificially increase the EPS so you can hit your bonus target.
You go out and you issue debt and you buy back your shares. You’re leveraging the company up – which means that you’re exposed to interest rates, you’re exposed to market stability. And then you’re buying back your shares, resulting in a price-insensitive buyer that is always underneath the market, resulting in this price-insensitive buyer always buying on market dips.
So, the result of this is that you’re artificially reducing realized volatility. The strategy is always to buy on dips. That is part of the replication strategy of the short-variance swap. Literally it’s part of the replication of shorting vol.
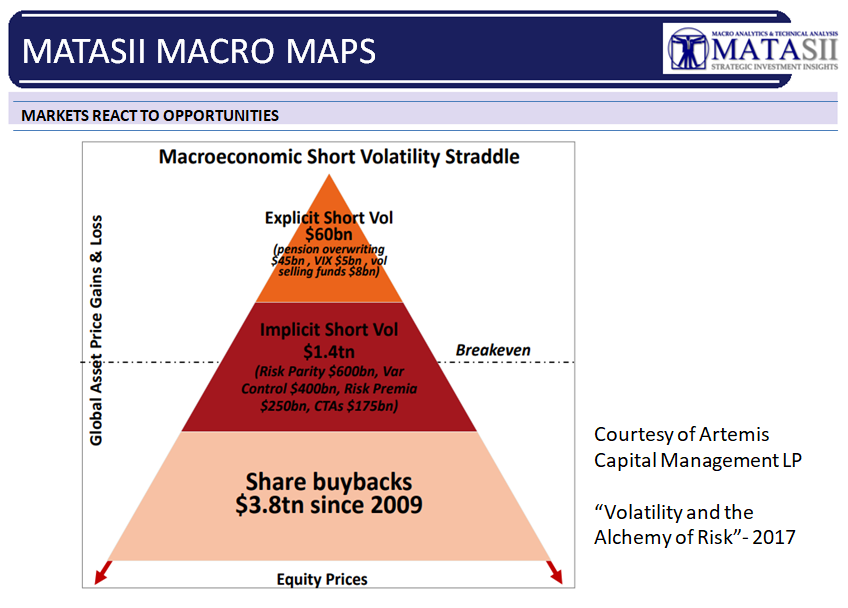
When you add all of this exposure together, we have this self-reflexive short straddle of financially-engineered strategies in the market. And this really comes out to about $2 trillion worth of implicit and explicit short-volatility strategies. And then you can tack on the share buybacks. To some effect that is resulting in this.
Leading into 1987. Portfolio insurance comprised about 2% of the market, leading to the Black Monday. And that was a reflexive strategy. Today anywhere between 6%–10% of the market is comprised of these self-reflexive implicit and explicit short vol strategies. And this should be concerning.
SLIDE 24
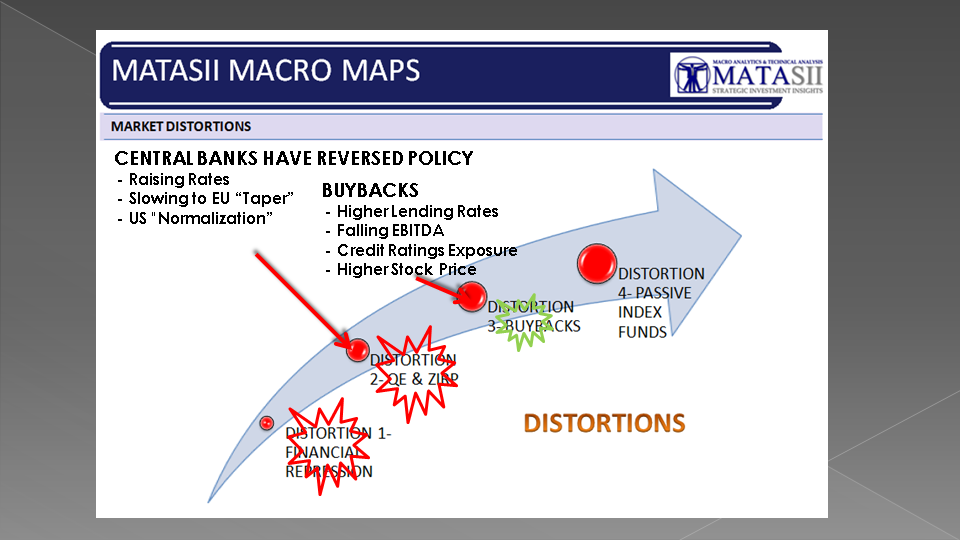
I said this cycle will reverse with potentially massive ramifications.
1- Central Banks have Reversed Policy
2- Buybacks are running out of leverage!
I think the Distortion associated with Passive Index Funds is going to be the big bang!
As you recall Alpha and Beta gains are all relative to Indexes. These ETF are all buying and feeding various indexes. When they hit the sell button watch liquidity disappear in the night. My experience with market crashes going back to the 1987 crash is that in all major market crashes the biggest problem is the sudden, rapid and unexpected disappearance of liquidity. This liquidity is going to be about no buyers!
SLIDE 25
The Big Reversal is when the big pain comes. I expect it isn't too far in the future and likely to occur with the next US Recession. A Recession that is considered long in the future but isn't warranted by the facts. Least of all we are already into one of the longest cycles ever showing signs of fatigue and peaking.
SLIDE 26
So who is holding the Hot Potato in all this?
As we stated earlier, suppressing volatility does not mean risk has vanished; rather, it means that risk is increasing as accurate information on systemic risk is being suppressed. The global financial system is becoming increasingly fragile and thus more prone to collapse, and an artificially low measure of volatility doesn't change this reality. There will be few places to hide in an over levered financial system when this reversal occurs.
Sometimes it is better to simply not to particiapte and just sit on the sidelines. I always reminded that:
- Investing is about having a high probability of success with excellent risk-reward factors
- Speculating is about poor probability of success and a bad risk-reward ratio but the speculator relying on something he knows and he believes others don't know OR simply has a hunch.
- Gambling is about the odds BEING completely against you and HAVING unacceptable risk-reward, but the gambler simply feelslucky!
Do you feel lucky?
Maybe you should ask yourself whether you are investing today or only speculating or possibly just out and out gambling? If you don't know the true risk it certainly can't be called investing!
SLIDE 27