ITS GETTING UGLY BELOW THE SURFACE!
..."Let's Talk US Retail & Auto Sales"
- ON THE SURFACE: RECORD MARKET HIGHS
- TECHNOLOGY
- FANG & NOSH
- S&P 500 / RUSSELL / NASDAQ
- BUYBACK THE SOLE DRIVER
- UNDER THE COVERS - A CRITICAL INDUSTRY
- JUST TWO CRITICAL SECTORS
- CYCLICAL: AUTO
- SECULAR: RETAIL
- DISCRETIONARY SPENDING
- VICES
- RESTAURANTS
- MOTORCYCLES
- CONCLUSIONS
SLIDE #5
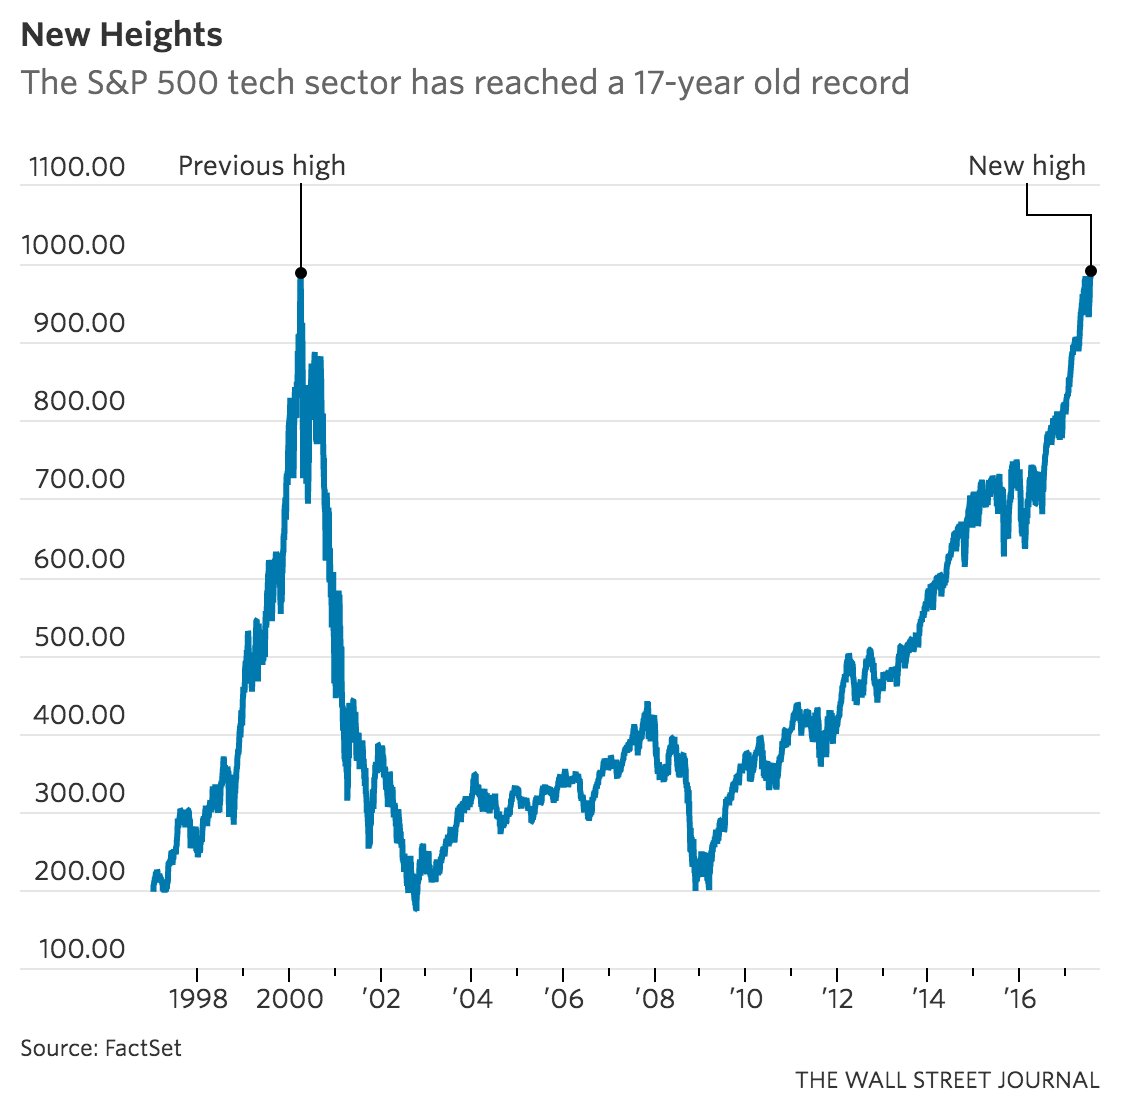
ON THE SURFACE: RECORD MARKET HIGHS
All equity indices are above, at or near all time highs. What is of particular interest to us is that the S&P 500′s information technology sector has broken all-time high set back in March '00 at peak of dot-com bubble
SLIDE #6
The reason we watch it is to best correlate the major technology leaders (or what we have previously referred to as the "Generals") with Central Bank liquidity increases. Presently near $300B/Mo.

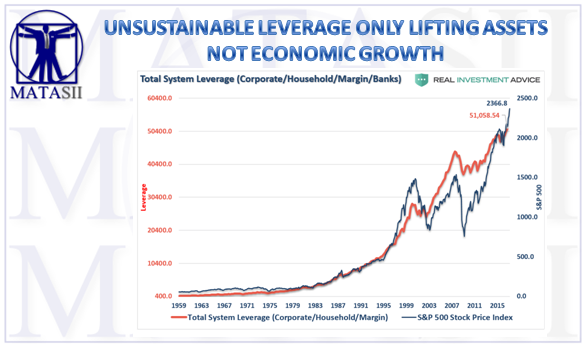
SLIDE #7
Unsustainable leverage from central bank liquidity injections is lifting assets - not economic growth.
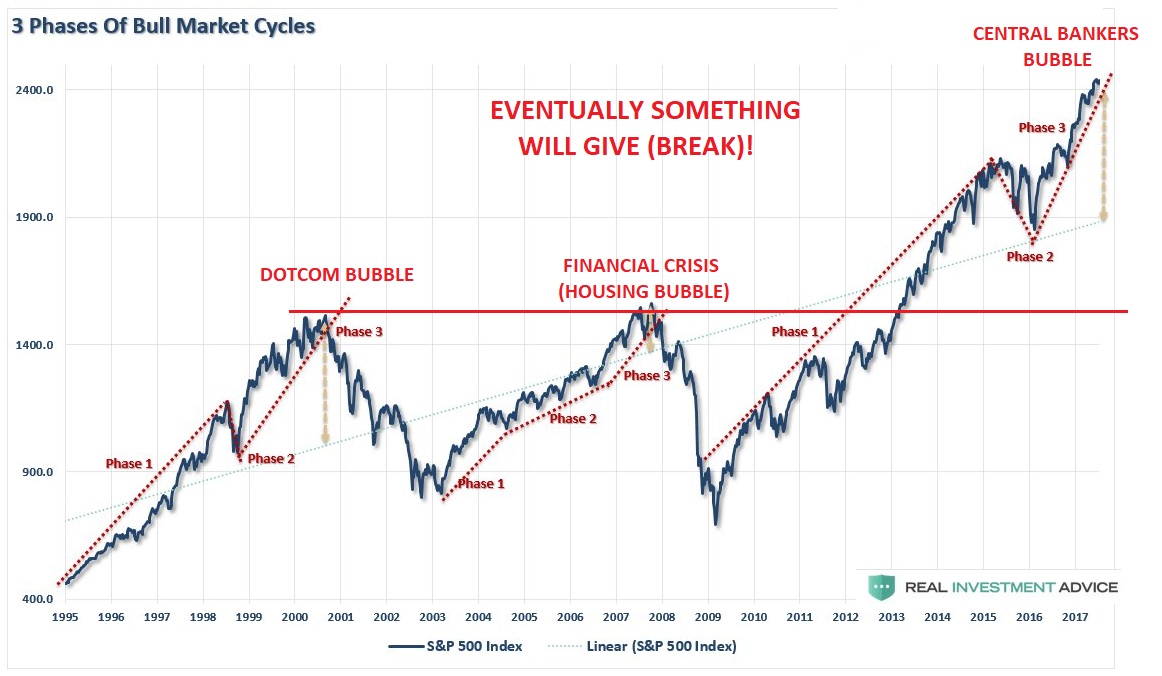
SLIDE #8
The central banks have been very clear on their intent to begin Quantitative Tightening and timelines are beginning to crystallize.
Eventually something will break and as we will discuss in the following slides, "below the surface" the signs of this already beginning to emerge.
The time to prepare is now!
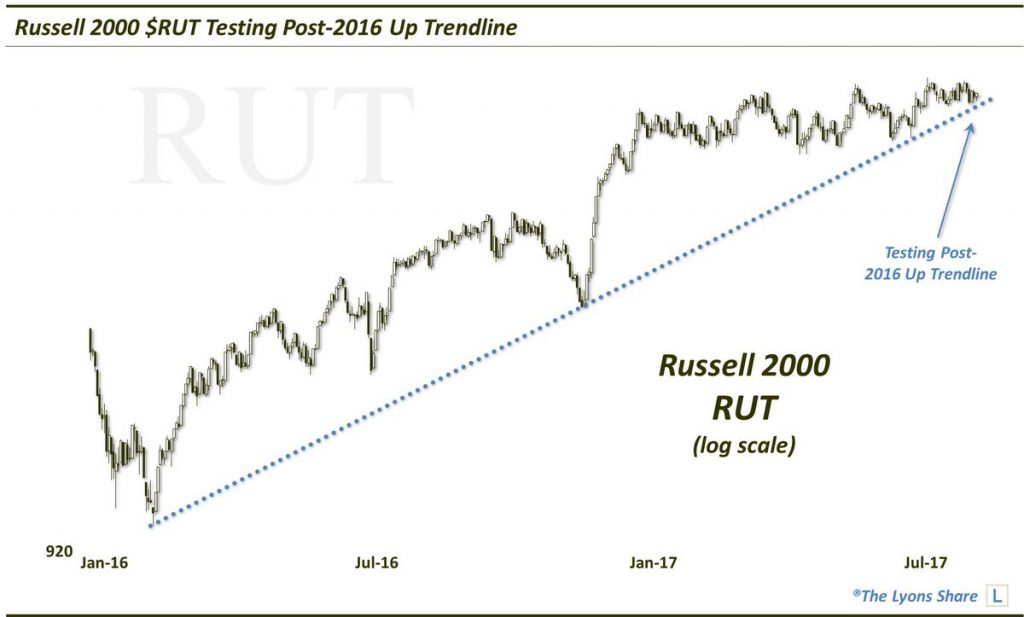
SLIDE #9
The broader market as represented by the likes of the Russell 2000 are showing signs of wanting to test support levels.
SLIDE #10
BUYBACKS THE SOLE DRIVER
The unquestionable user of the leverage mentioned a few slides ago are corporations for the use of buying back their shares. They have borrowed through debt and bond issues close to $1.5 Trillion. This is unprecedented in market history and the distortions it has created is a presentation unto itself.
As you can see from this chart this has been the driver of US Equity prices.

SLIDE #11
However, as we have pointed out in previous presentations, this is beginning to change - as is central bank policy direction. A very bad combination of shifts! The makings of a perfect storm!

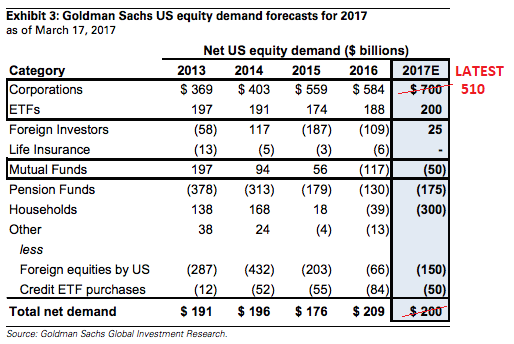
SLIDE #12
This Q1 analysis from Goldman Sachs more clearly shows the exposure the markets have to a buyback slowdown - already underway.
Notice that the latest reduced announced buyback estimates leaves Total Net Demand for US Equities perilously close to negative!
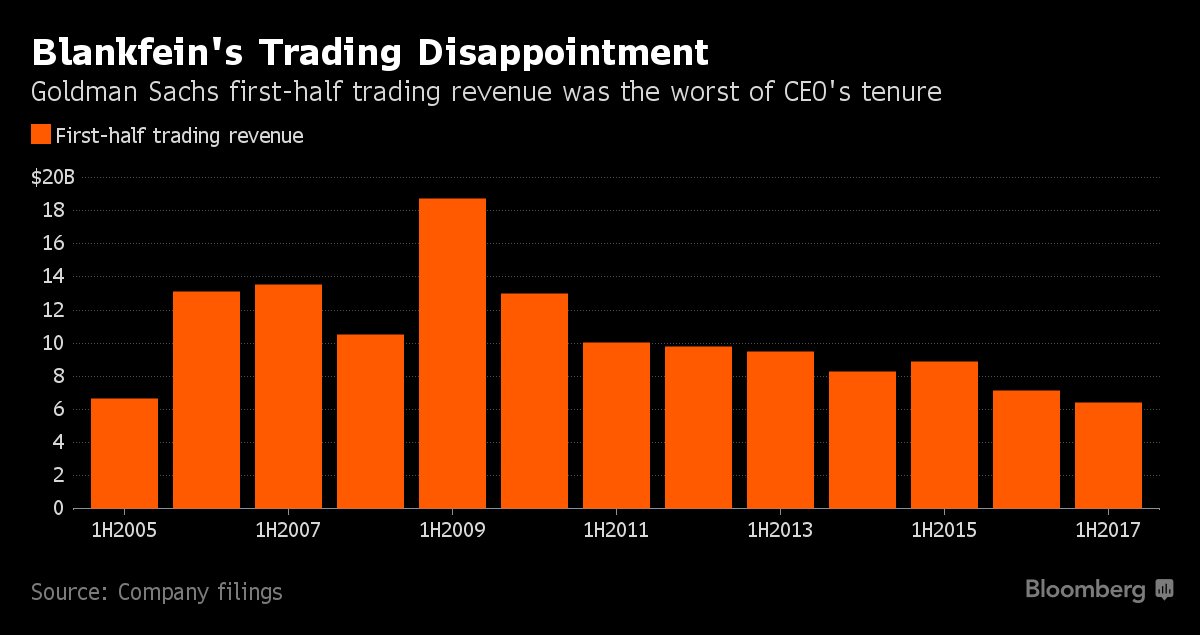
SLIDE #13
I have pointed out on numerous occasions the lack of participation by the public and institutions in the market euphoria over the last few years.
Even the leading traders have been witnessing a continued and unprecedented slowdown in trading volumes.
SLIDE #14
I would be amiss if I didn't point out one other critical flow in the current market Euphoria, and I am not talking abut the fact the central banks have reversed their policy stance which has been the whole basis for the market rise since QE1 & ZIRP were initiated.
I am talking about Passive investing. I have talked about this on a number of occasions and will leave it to you to go back over previous reports where we discussed ETF (potential Weapons of Mass Financial Destruction when owners hit the "sell" button))
SLIDE #15
UNDER THE COVERS - A CRITICAL INDUSTRY
Lets consider the US Retail industry which encompasses two of our SII's (Strategic Investment Insights), Retail Store and Auto Sales.
This long term view of Retail & Services Sales show a steady Y-o-Y slowing in the rate of growth which has accelerated since the post financial crisis initial reaction to QE & ZIRP by consumers began to where off. That is after the artificial demand pull forward had occurred.
The current level is problematic because it doesn't allow for the absorption of real inflation and price pressures.
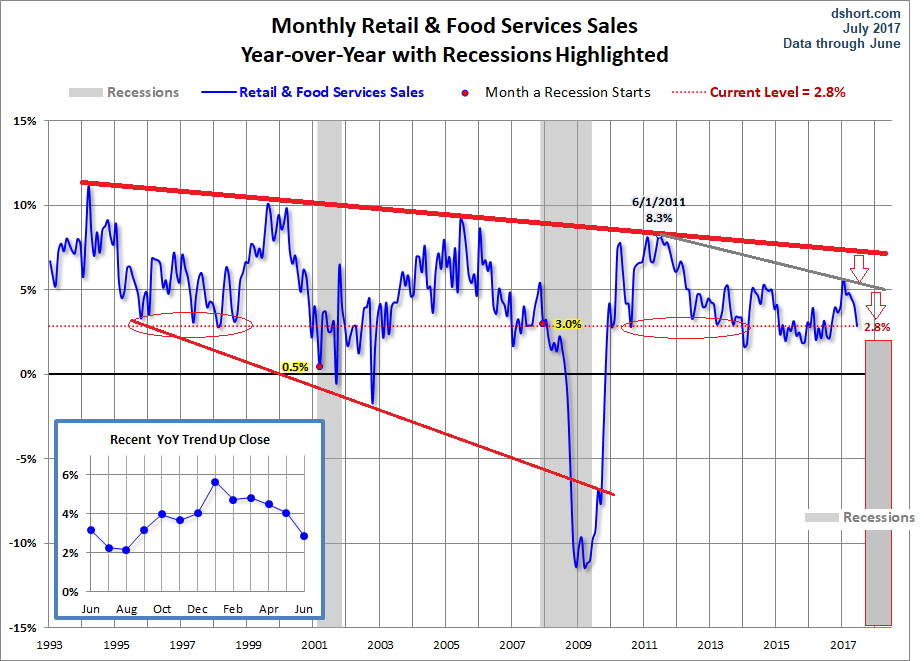
SLIDE #16
This shorter term view shows we are actually in contraction territory with M-o-M sales having peaked in the fall of 2016.

SLIDE #17
Part of the problem is price discounting between brick & mortar competitors and online offerings are driving prices even lower. If we continue towards the lower trend line (which we suspect is in the cards), then profits are in serious jeopardy and stock prices are headed lower - especially those chains with Mall Centric business models.
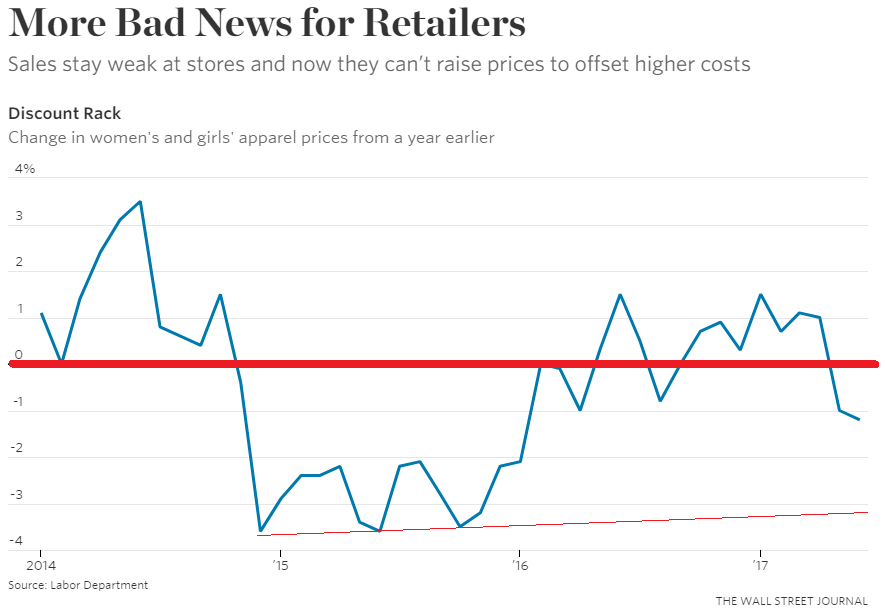
SLIDE #18
JUST TWO CRITICAL SECTORS
- SECULAR: RETAIL
We strongly believe that US Retailers in total are now in a secular decline. This is for three reasons:
- Massive excess retail floor space having been brought to market over the last 15 years,
- A financially depleted and squeezed US Middle class,
- The rapid shift and acceptance of aggressive online retail offerings.
As a result retail bankruptcies are now an almost regular occurrence.
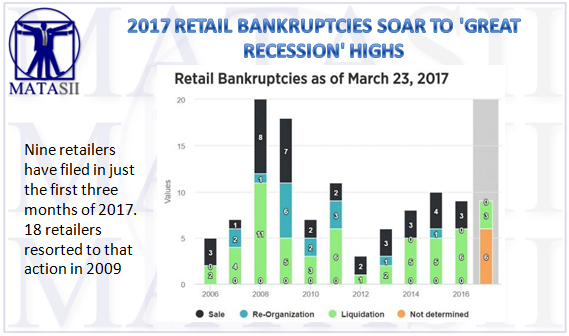
SLIDE #19
Those retailers surviving are rampantly announcing store closing with expectations current for over 10,000 chain store locations to close operations in 2017.
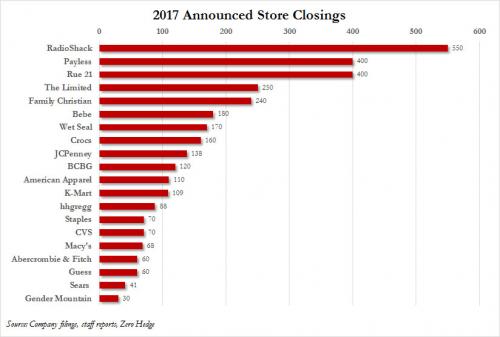
SLIDE #20
The Department Store model and its "anchor store" appeal for driving mall traffic is broken and in rapid decay.
Meanwhile Amazon continues to breakdown barriers to an increasing numbers of retail brand strongholds.
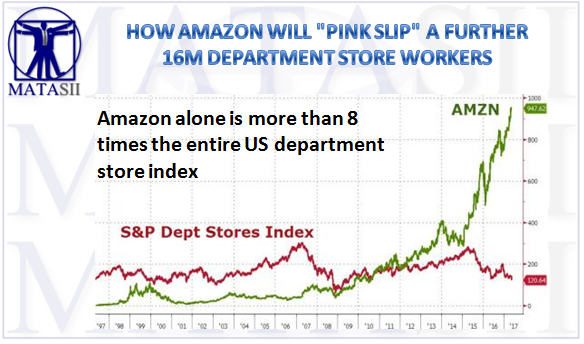
SLIDE #21
- CYCLICAL: AUTO
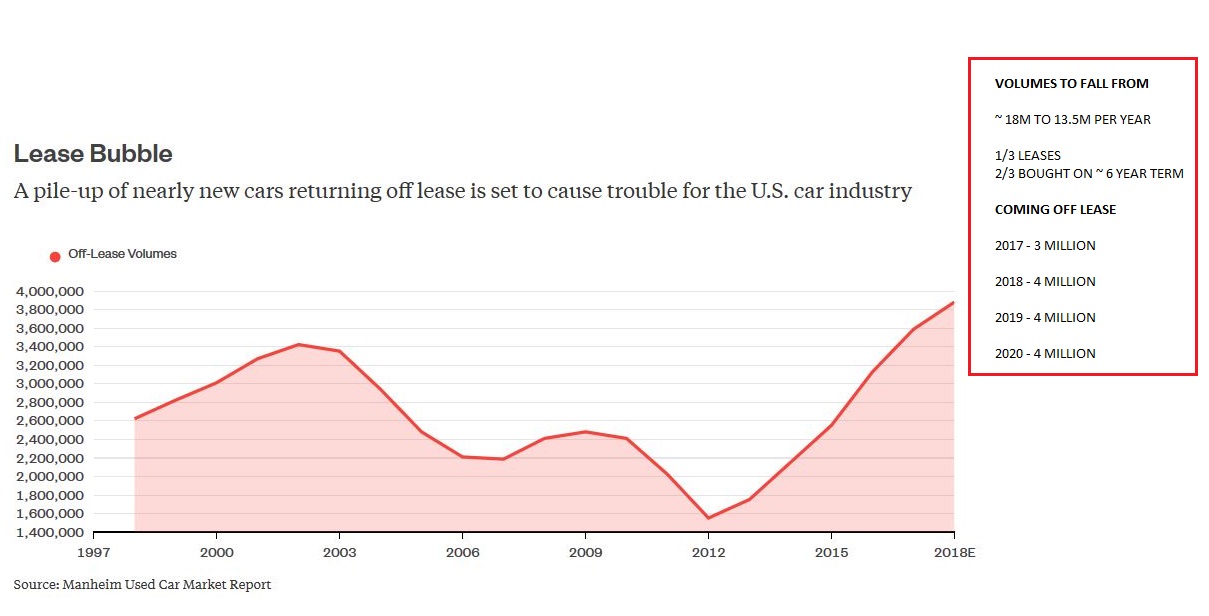
The auto sector on the other hand is experiencing a cyclical peak which may potentially forewarn of an even greater problem ahead for the downside of their cycle. The push to increased leasing to make higher prices possible for purchasers, has left a looming off-lease inventory returns Tital Wave that may potentially bring the industry to its knees once again, as occurred during the financial crisis.
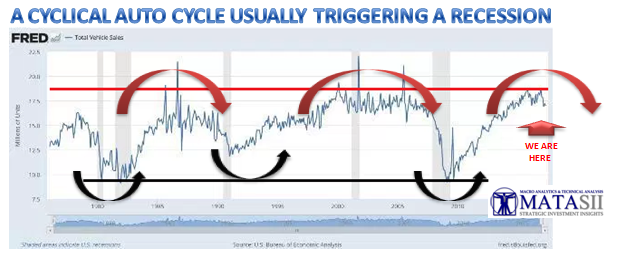
SLIDE #22
Annual light vehicles sales currently approaching 18M units is now expected to fall to 15.2M and some calling for it to be as low as 13.5M. This will be crushing to say the least!

SLIDE #23
Off Lease returned vehicles are now expected to be 3M this year and 4M in each of the next three years.
With falling new vehicle sales and new cars not leased but having been bought on nearly 72 month finance terms - where will the new buyers come to buy this glut??
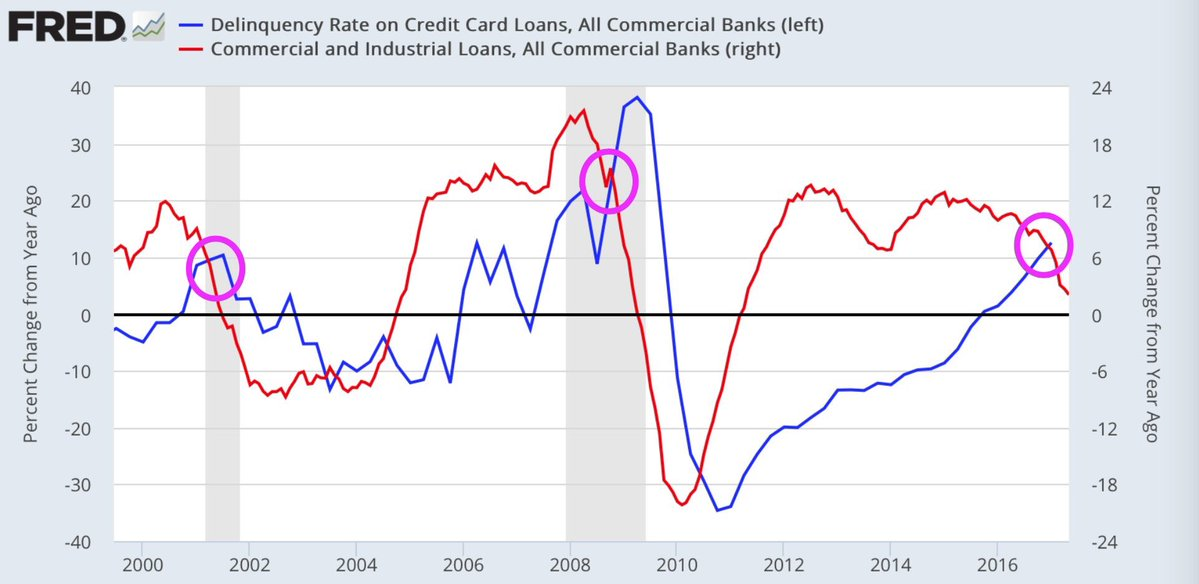
Repossessions, delinquency and defaults are all rising from 'deep sub-prime, sub-prime' to higher credit levels.
With anyone who could 'fog a mirror' now in a new car there is a monumental problem potentially at hand. Expect government bailouts to soon appear on the horizon to incent buyers in some fashion.
SLIDE #24
DISCRETIONARY SPENDING
I discussed my preferred discretionary spending gauges in a previous presentation, but let me briefly highlight some points here.
1-THE VICES
Vices normally leads overall retail sales. It is reflecting a very rapid decline and signaling we can expect overall retail sales to follow.

SLIDE #25
Gambling continues to slow and is now actually contracting as reflected by the average rates of gambling growth decline for Detroit, Maryland, Connecticut, Atlantic City, & Pennsylvania.

While comps play a role in exaggerating some of the contraction, the trend is clear: less gambling. And that means less hot money floating around households to play with.
SLIDE #26
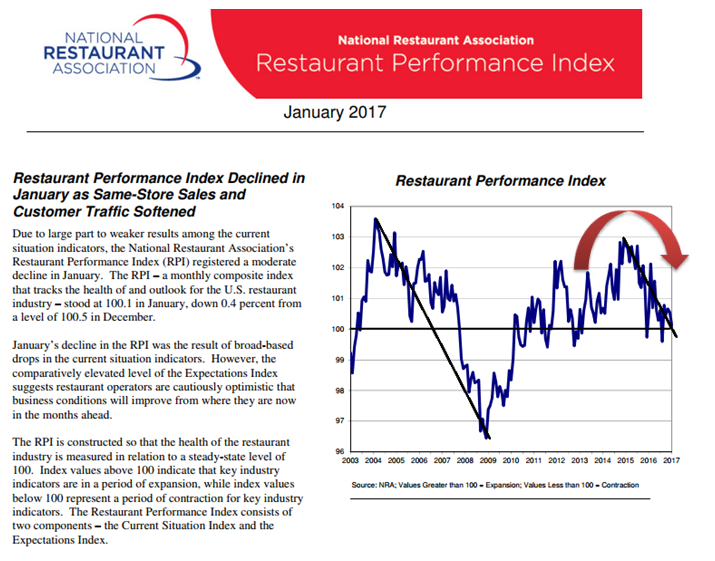
2-RESTAURANTS
The last time this happened it was a pre-warning to the Financial Crisis. Usually however it is normally a sign of an approaching reversal in the Business Cycle and a coming Recession?
SLIDE #27
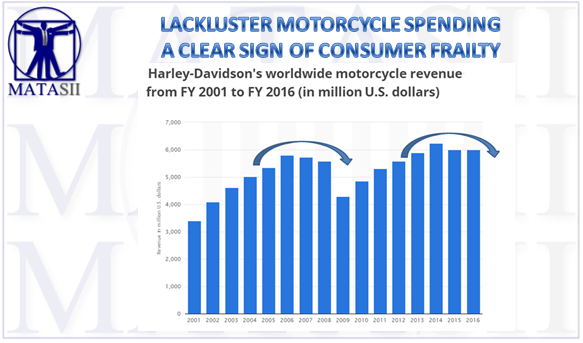
3-MOTORCYCLES
Economists like to look at sales of discretionary goods to determine whether or not the consumer is experiencing any potential weakness. Motorcycles tend to be a closely-watched discretionary barometer. For the last three quarters, Harley-Davidson (HOG) management as reported by Bloomberg has said that:
..... the industry is struggling amid soft used-bike prices, economic uncertainty and weakness in oil-dependent areas.

SLIDE #28
This looks like a top, especially when you consider the attendance at the spring rallies at Americade in upstate New York and Laconia in New Hampshire. Attendance was way down - again.
A relative who has attended these rallies for 20 years told me he was staying in hotels downtown when in prior years he had to find accommodations 20-30 miles away. In fact he stopped in to see me for only the second time in 20 years because he said I would likely offer more entertainment value than the failing rallies - that should tell you all you need to know about how bad it must have been!
SLIDE #29
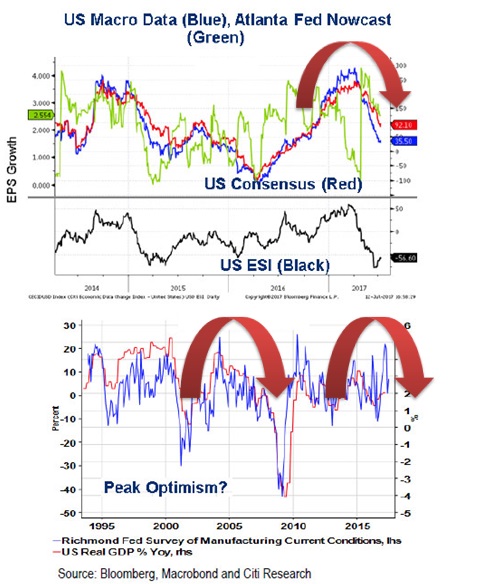
CONCLUSIONS
The US Macro data and the Atlanta Fed's Nowcast predictions for US GDP correlate well in showing the US economy is stalled and rolling over.
We normally have a recession every 5=-7 years. We are now 8 years without one. 10 years is the longest we have witnessed in modern times.
I personally do not believe the central bankers have the power to reverse the business cycle!
SLIDE #30
The global economy is in trouble which is going to make matters in the US worse and visa-versa. The Global Credit Impulse continues to rapidly fall.
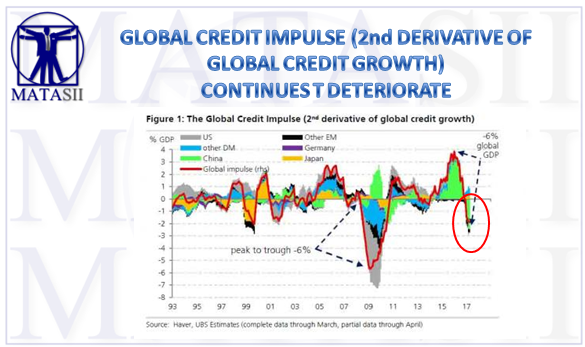
SLIDE #31
EVERY-TIME THIS HAS OCCURRED -- BAD THINGS HAVE SUBSEQUENTLY HAPPEN!