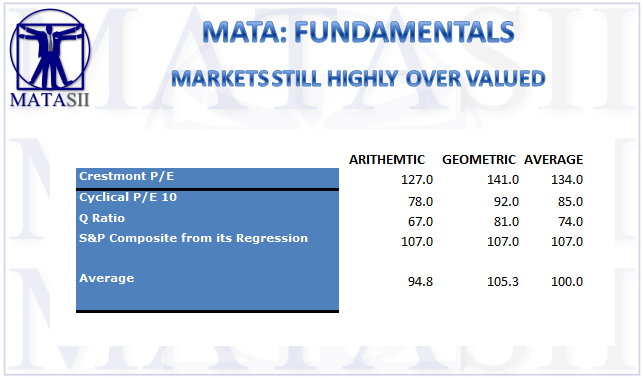
MARKETS STILL HIGHLY OVER VALUED
A PUBLIC SOURCED ARTICLE FOR MATASII (SUBSCRIBERS-RESEARCH & PUBLIC ACCESS ) READERS REFERENCE
MATA: FUNDAMENTALS
SOURCE: 03-06-19 - Bloomberg, John Authers - "There’s No Sugarcoating Corporate Debt"
MATASII SYNTHESIS:
There’s No Sugarcoating Corporate Debt
Here is a summary of the four market valuation indicators we update on a monthly basis.
- The Crestmont Research P/E Ratio (more)
- The cyclical P/E ratio using the trailing 10-year earnings as the divisor (more)
- The Q Ratio, which is the total price of the market divided by its replacement cost (more)
- The relationship of the S&P Composite price to a regression trendline (more)
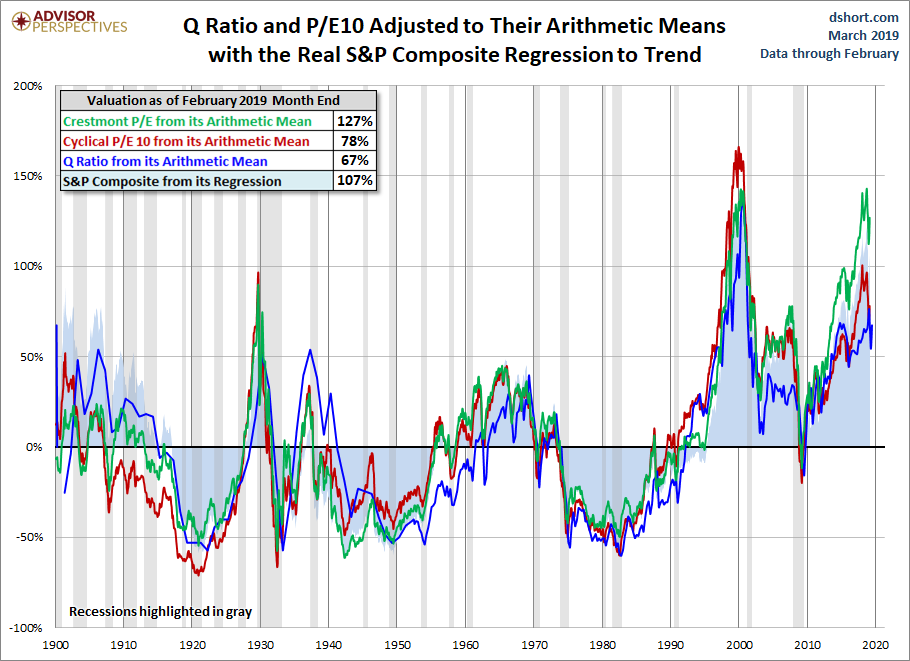
To facilitate comparisons, we've adjusted the two P/E ratios and Q Ratio to their arithmetic means and the inflation-adjusted S&P Composite to its exponential regression. Thus the percentages on the vertical axis show the over/undervaluation as a percent above mean value, which we're using as a surrogate for fair value. Based on the latest S&P 500 monthly data, the market is overvalued somewhere in the range of 67% to 127%, depending on the indicator, up from 58% to 115% the previous month.
We've plotted the S&P regression data as an area chart type rather than a line to make the comparisons a bit easier to read. It also reinforces the difference between the line charts — which are simple ratios — and the regression series, which measures the distance from an exponential regression on a log chart.
The chart below differs from the one above in that the two valuation ratios (P/E and Q) are adjusted to their geometric mean rather than their arithmetic mean (which is what most people think of as the "average"). The geometric mean increases our attention to outliers. In our view, the first chart does a satisfactory job of illustrating these four approaches to market valuation, but we've included the geometric variant as an interesting alternative view for the two P/Es and Q. In this chart, the range of overvaluation would be in the range of 81% to 141%, up from last month's 71% to 129%.

The Average of the Four Valuation Indicators
The next chart gives a simplified summary of valuations by plotting the average of the four arithmetic series (the first chart above) along with the standard deviations above and below the mean.
At the end of last month, the average of the four is 95% — up from 86% the previous month.
Here is the same chart, this time with the geometric mean and deviations. The latest value of 105% is up from last month's 96%.
As we've frequently pointed out, these indicators aren't useful as short-term signals of market direction. Periods of over- and under-valuation can last for many years. But they can play a role in framing longer-term expectations of investment returns. At present, market overvaluation continues to suggest a cautious long-term outlook and guarded expectations. However, at today's low annualized inflation rate and the extremely poor return on fixed income investments (Treasuries, CDs, etc.) the appeal of equities, despite overvaluation risk, is not surprising. For more on that topic, see our periodic update:
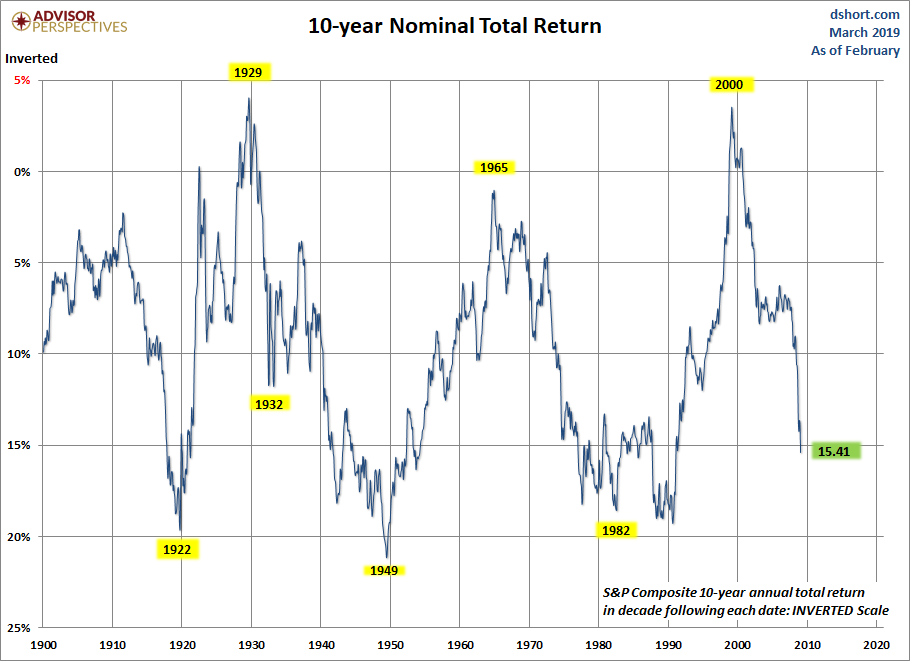
Market Valuation and Actual Subsequent 10-Year Total Returns
Many of our readers have requested we reproduce a chart by John Hussman that inverts the S&P 10-year total returns. Hussman says “the most reliable correlation between valuations and subsequent returns is on a 12-year horizon, which is the point where the autocorrelation profile of valuations typically hits zero.” The correlation of valuations Hussman uses for comparison are at about 90%.
You will notice that nominal returns are used – this is a direct result of a sort of Fisher-effect in which inflation ends up being washed out of the calculation. The nominal growth rate of the economy is highly correlated with the level of interest rates, but also negatively correlated with market valuations, all over the same time period.
Here are the Geometric Average of the Four again and the recreated Hussman charts together. Please again note that the Hussman returns chart is inverted.
Points of ‘secular’ undervaluation such as 1922, 1932, 1949, 1974 and 1982 typically occurred about 50% below historical mean valuations, and were associated with subsequent 10-year nominal total returns approaching 20% annually. By contrast, valuations similar to 1929, 1965 and 2000 were followed by weak or negative total returns over the following decade. That’s the range where we find ourselves today. Of course, we also won’t be surprised if the S&P 500 ends up posting weak or negative total returns in the 2007-2017 decade, which would require nothing but a run-of-the-mill bear market over the next couple of years. - John Hussman


FAIR USE NOTICE This site contains copyrighted material the use of which has not always been specifically authorized by the copyright owner. We are making such material available in our efforts to advance understanding of environmental, political, human rights, economic, democracy, scientific, and social justice issues, etc. We believe this constitutes a 'fair use' of any such copyrighted material as provided for in section 107 of the US Copyright Law. In accordance with Title 17 U.S.C. Section 107, the material on this site is distributed without profit to those who have expressed a prior interest in receiving the included information for research and educational purposes. If you wish to use copyrighted material from this site for purposes of your own that go beyond 'fair use', you must obtain permission from the copyright owner.
NOTICE Information on these pages contains forward-looking statements that involve risks and uncertainties. Markets and instruments profiled on this page are for informational purposes only and should not in any way come across as a recommendation to buy or sell in these assets. You should do your own thorough research before making any investment decisions. MATASII.com does not in any way guarantee that this information is free from mistakes, errors, or material misstatements. It also does not guarantee that this information is of a timely nature. Investing in Open Markets involves a great deal of risk, including the loss of all or a portion of your investment, as well as emotional distress. All risks, losses and costs associated with investing, including total loss of principal, are your responsibility.