Gordon T Long

Gordon T Long

Global Macro Research | Macro-Technical Analysis 

MATA: FUNDAMENTALS

EARNINGS


MATASII’S Q2 EARNINGS GUIDANCE TRANSLATOR

In this newsletter we will examine the underlying reasons for the current spread between market capitalization pricing (PE Contraction) and Earnings per Share (EPS).
 
We will also give you some benchmarks to allow you to position your portfolio for a period of high inflation:
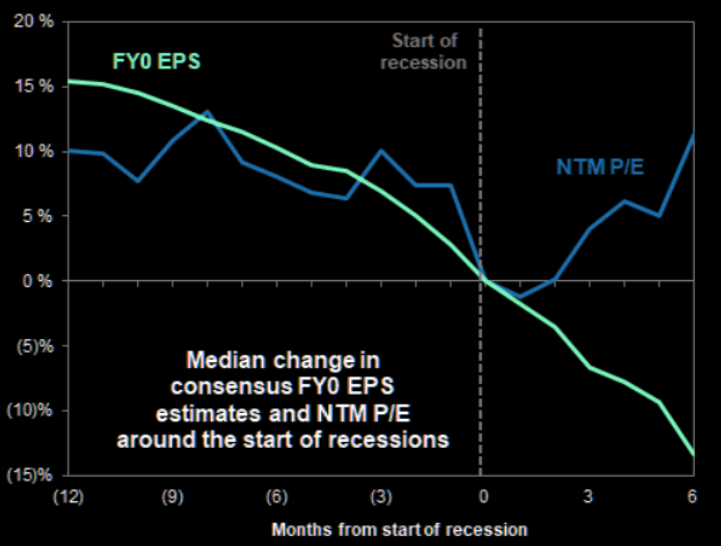
  • How to watch for timing between FY Earnings and NTM (Next Twelve Month) PE,
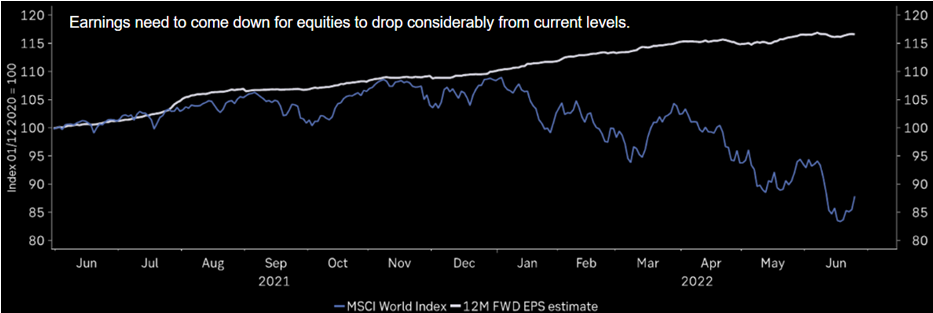
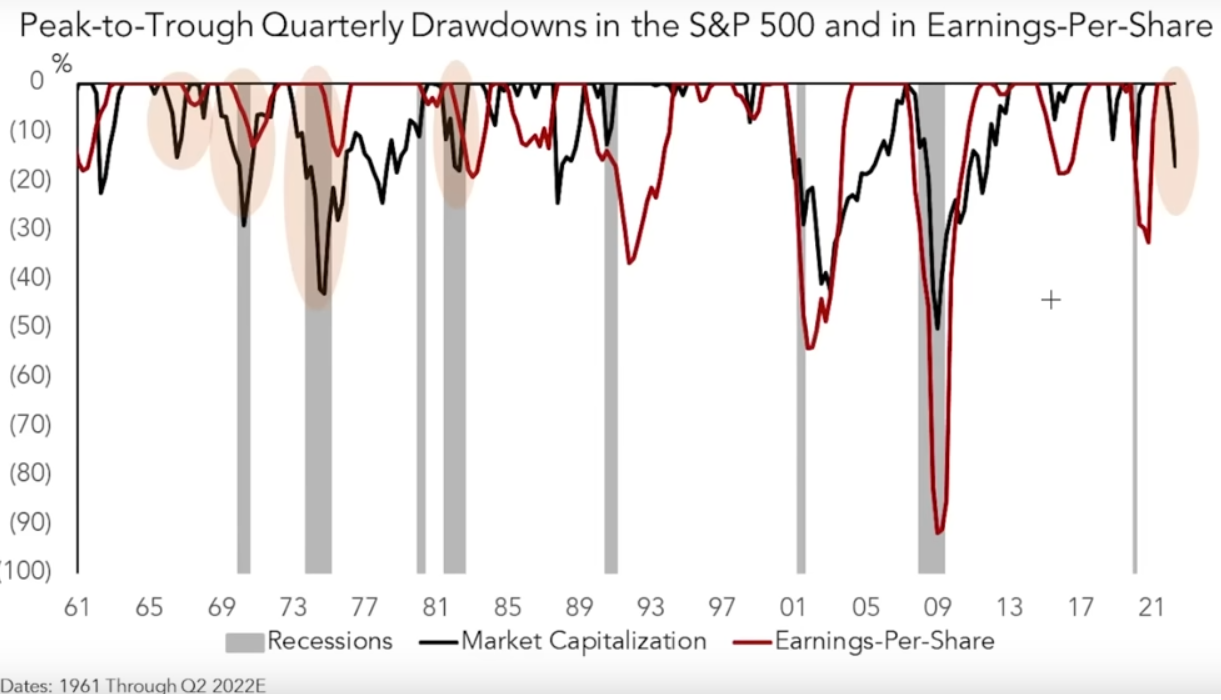
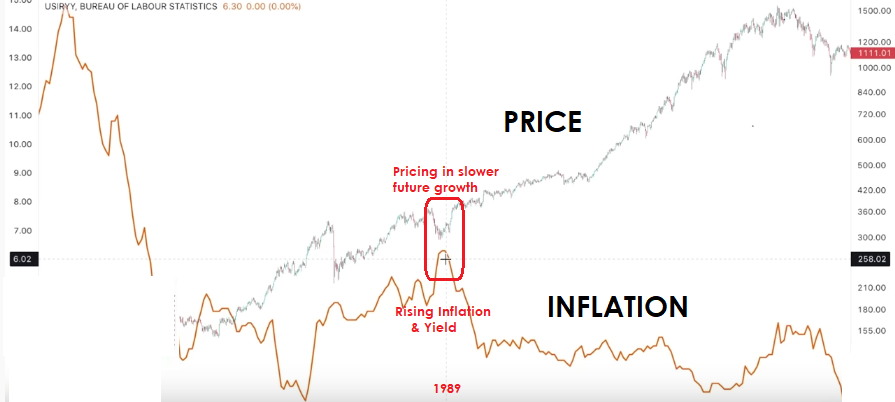
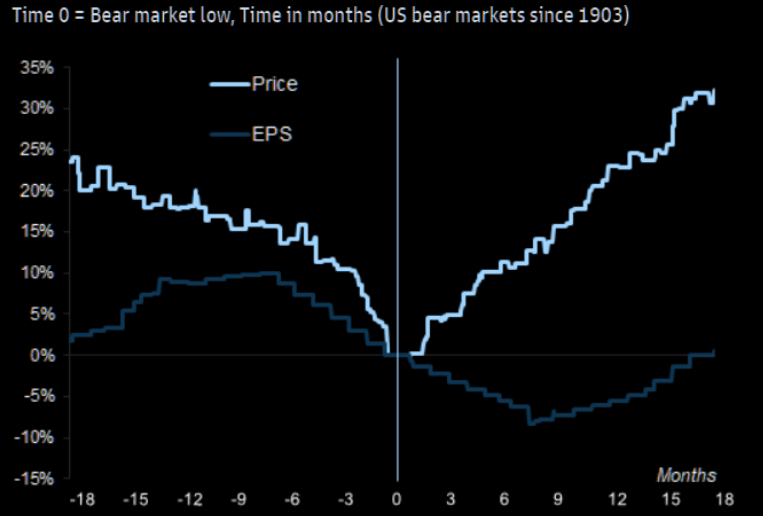
  • How to watch for price divergence between Price and EPS where Price goes up as EPS continues down,
  • How critical it is to use an Inflation era Price & EPS divergence model, not the model used since the Dot-Com Bubble and advent of the Low Rate Era.
=========
 
WHAT YOU NEED TO KNOW
 
  • PHASE I – COVID-19 FALLOUT:
    • The current market drop is a correction of the Covid-19 rally created by excessive expansion of central bank balance sheets.
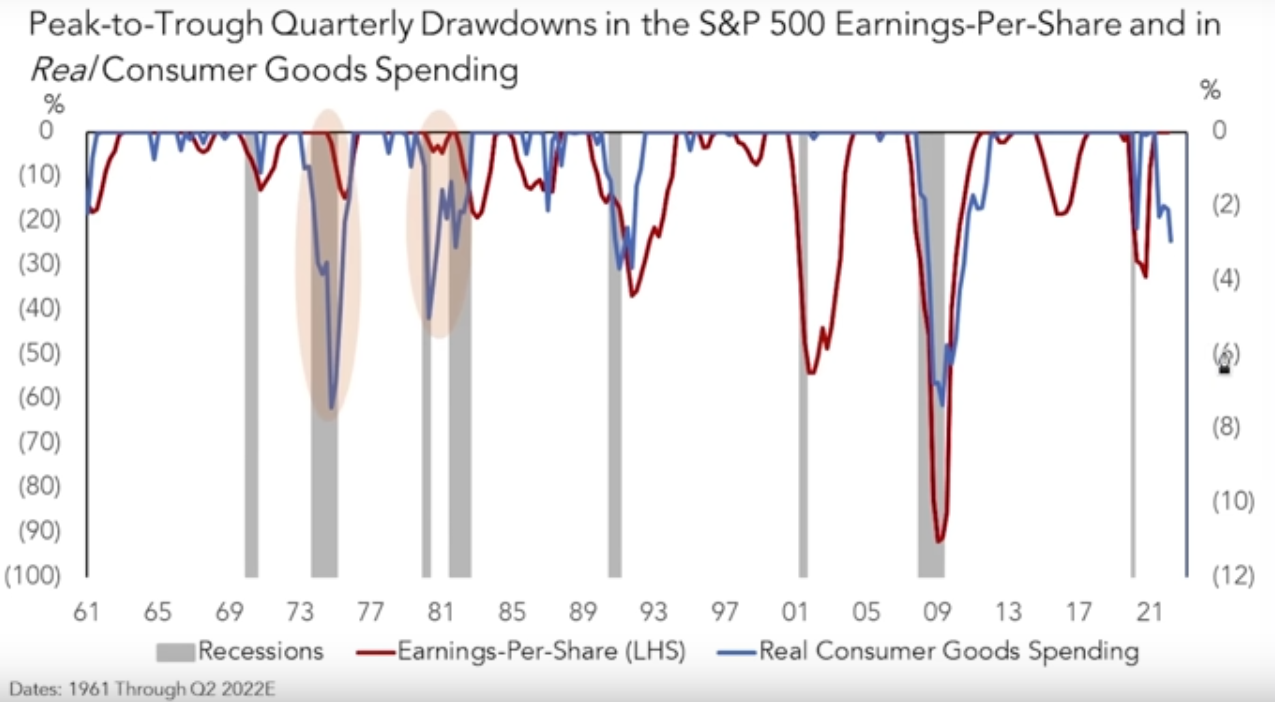
  • PHASE II – CONSUMER RECESSION:
    • The Current Market Correction will end when the market has fully priced in a Consumer Spending Recession.
  • PHASE III – CENTRAL BANKS REVERSE POLICY:
    • Fed policy can be expected to reverse from QT and Rate hikes to QE with Rate Cuts sometime in early Q4 2022.
    • Prices will rally prior to Fed taking actions.
  • UNDERSTANDING EARNINGS GUIDANCE IN AN INFLATIONARY ENVIRONMENT:
    • In a high inflation period (inflation over 5%) we can expect that when earnings (EPS) finally start to fall Price should start to rise.
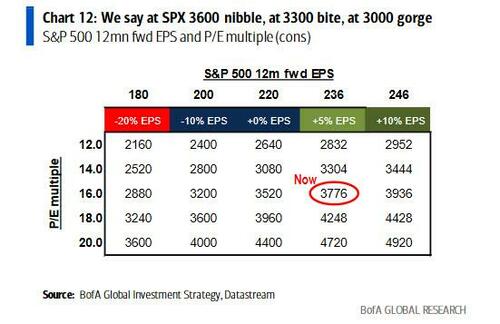
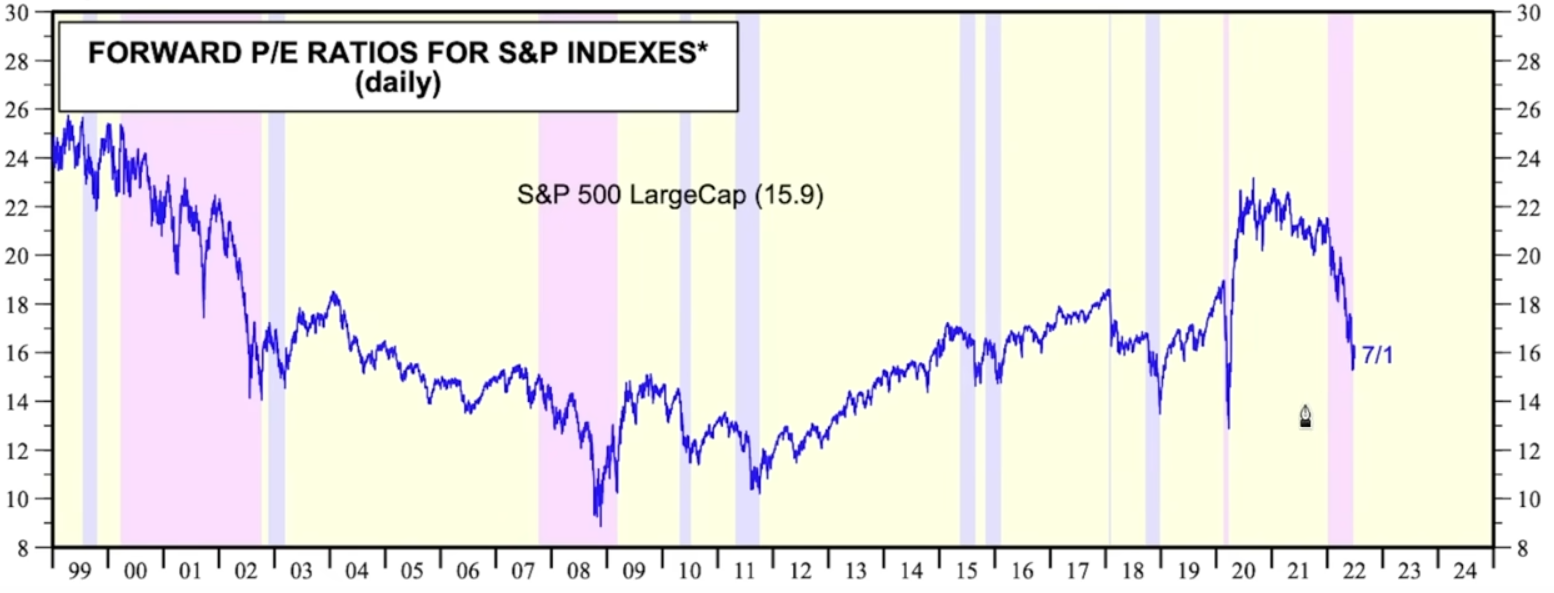
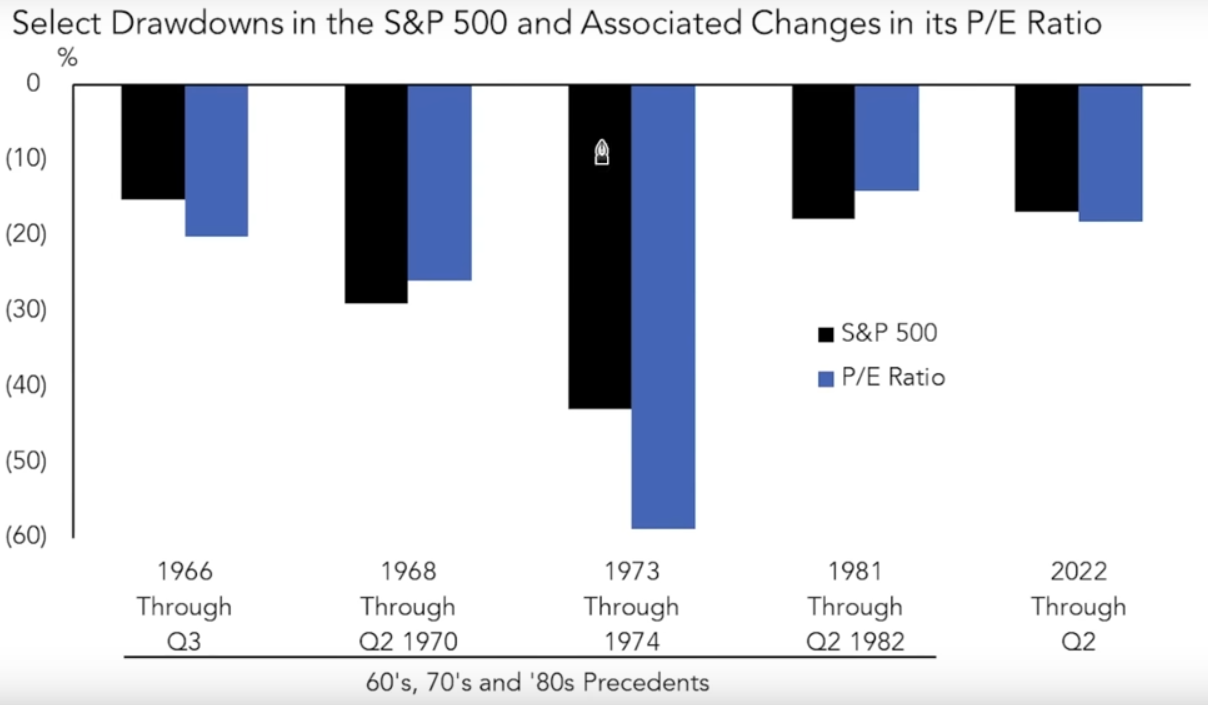
  • UNDERSTANDING PE’s & EPS TIMINGS:
    • Historical PE and EPS Timing methods must be modified to reflect the current high inflation period we are experiencing.

=========

MATASII’S MACRO OUTLOOK
 
PHASE 1: COVID-19 FALLOUT
 
The massive ~29T in central bank balance sheet increases and government fiscal spending due to Covid-19 is currently being withdrawn from the markets in the form of price draw-downs (Chart Right – Top).
 
This is nearly complete as illustrated by the Y-o-Y change in Money Supply, M2 and the TMS/Rothbard-Salerno Measure (Chart Right – Bottom).
 
Current Market Financial Conditions are extremely tight and comparable to the GFC of 2008 (Chart directly below).
 
PHASE II – CONSUMER RECESSION
 
Our analysis suggests the current price correction can be expected to continue until approximately the 3270 price level in the S&P 500 is reached. This will be more than just a Covid-19 liquidity withdrawal, but also the pricing in of a pending US Consumer led recession.
 
It appears that the Bank of America/ML has announced a major reversal in its outlook which now very closely resembles the long held MATASII outlook of a market low in this cycle of ~3270 in the S&P 500.
 
PHASE III: CENTRAL BANKS’ REVERSE POLICY
 
A pre Mid-TERM ELECTION REVERSAL
 
    • Fed Stops Rate Hikes,
    • Fed Signals Rate Cuts & Termination of QT,
    • Market Prices in QE Beginning is Spring (~ 6-8 Months).
I won’t get into the details of this leg of a major counter rally (shown in price channel trend chart above) in this newsletter, as we are focused on identifying what will signal this forced action to be taken by the Fed other than a major global credit event! We see that to be about understanding how earnings and market capitalization pricing can be expected to react in the high inflation era we are currently operating in.
 
 
UNDERSTANDING EARNINGS GUIDANCE IN AN INFLATIONARY ENVIRONMENT
 
HOW TO INTERPRET EARNINGS GUIDANCE
 
FORWARD PE RATIO
 
The first leg of the downward correction in the equity markets has been the result of a compression in PE ratios down globally in the MSCI World Index by over 28% (as show below) and to below 16 in the S&P 500. This represents what investors are willing to pay for current earnings.
 
The question that needs to be asked is whether an actual drop in corporate earnings is going to be the driver of the next big leg down in the equity markets and specifically in the S&P 500? The chart below shows a longer time frame for PE ratios for the S&P500 Large Caps overlaid with recessions.Clearly Recessions drop both PE ratios and earnings. We spent a of time in this month’s video considering the impact of a potential recession and concluded that PE Ratios are currently still only pricing in a moderate shorter term (12-15 month) US recession.
 
PRICE v EPS DRAW-DOWNS DURING HIGH INFLATION v LOW INFLATION
 
The chart below is intended to show how market price draw-downs in PE ratios during eras of high inflation versus low inflation compares to adjustments in corporate earning per share (EPS).
 
  • In times of low inflation (right side of the chart), when Market Capitalization (in black) as in the first half of 2022, went down by ~20% due to primarily valuation contraction as:
    • Inflation rose,
    • Yield rose and
    • Yet equity prices rose?
  • Meanwhile EPS (shown by the red line) has yet to come down.
  • This is different to what happened during the Dotcom bubble implosion in 2000-2001 and during the GFC in 2007-2008, when earnings went down inline with falling market capitalization.
    • Economic Growth in these cases was priced to downside.
    • There was no valuation contraction before earnings actually started coming down.
    • Earnings (EPS) shortfalls actually led the equity markets lower.
  • This was substantially different to what we are seeing currently.
  • To understand we need to go back to the high inflation episodes that occurred in the 1970 (on the left hand side of the chart):
    • We see a much more similar dynamic to what we are seeing today.
    • The 1973 episode, for example, saw prices coming down in anticipation of earnings coming down.
    • However, when earning (EPS) did finally start to come down the market pricing rebounded having found a bottom!
    • We see a similar dynamic in 1966 and 1989.
    • Markets were driven a lot more by inflation than earnings. PE’s were pricing in the coming EPS drop. When the drop in EPS came the markets were already pricing in the expected Fed pivot.
    • Clearly in high inflation episodes the markets begin to price in advance very significantly, because this is a predictable dynamic. This is due to a lot of tightening delivering an economic slowdown. Investors are able to price in the slowdown in advance. This is something that can be calculated.
 
  • In the 1989 episode shown above we can more clearly see (below) that when rates and yields were rising the market was pricing in slower economic growth.
  • When Inflation and Yields Peaked, Prices Reversed.
 
CHANGES IN PE RATIOS
 
So what were the S&P 500 draw-downs versus the PE Ratio draw-downs during these high inflation periods?
 
  • Generally they correlate with the big exception being the high inflation period of 1973.
  • However, we see in 1966 and today (2022) the PE Ratios were slightly larger than the S&P 500 draw-down, (where the market bottomed in price prior to the earnings beginning to contract).
 
WHAT HAPPENS WHEN INFLATION EXCEEDS 5%?
 
What we have noticed is that high inflation eras help to temper falling earnings (EPS).
 
  • Generally earnings is driven by Consumer Spending. In the chart below we compare EPS draw-downs (in red) with REAL Consumer Spending (in blue), When one is falling the other falls with it.
  • The big exception in the 2000 Dotcom bubble was driven by an overbought tech sector versus a slowdown in consumer spending,
  • Everyone is currently expecting a collapse in Consumer spending to trigger another massive leg down in EPS.
  • We see on the left hand side that during high inflation eras a drop in consumer spending has a much smaller impact in falling EPS.
  • In 1973 Consumer spending fell by ~60%, yet EPS on fell by ~15%. Same in 1981, where Consumer spending fell by ~ 40% but EPS by only ~ 20%. The reason for that is because REAL consumer spending is REAL! It is already adjusted for inflation whereas EPS is not. Inflation is a tailwind for earnings. They tend to go up in high inflation cycles.
 
 
UNDERSTANDING HISTORICAL PEs & EPS TIMINGS
 
CHART BELOW: When recession is a fact, PE Multiples trough! PEs typically trough at start of recession while earnings continue to fall.
 
 
CHART BELOW: Price (almost) always front-runs EPS. Price recovers about 6-9 months before EPS starts to rise (and starts to decline rapidly just a few months before equities trough).


CONCLUSION
 
In a high inflation period (inflation over 5%), we can expect that when earnings (EPS) finally start to fall Price will start to rise.
 
We should expect:
  1. A US Consumer Lead Recession,
  2. The rapidly rising US$ will Create a Global Credit Event,
  3. When the Fed signals a shift to Rate Hikes then the US Dollar will weaken,
  4. US$ weakening will Improve US Earnings & Exports, which Improves an EPS Reversal.
 
Yield Curve Inversion Is Currently Signaling:
  1. Fed Policy IS Wrong
  2. A Recession is occurring or close at hand.


EXPECTED LONG-TERM CORRECTION IN HOUSEHOLD NET WORTH TO DISPOSABLE PERSONAL INCOME

FOLLOWING DETAILED ANALYSIS IS SUBSCRIBER CONTENT ONLY

Subscribe to view full post content with supporting live charts
 

FAIR USE NOTICE  This site contains copyrighted material the use of which has not always been specifically authorized by the copyright owner. We are making such material available in our efforts to advance understanding of environmental, political, human rights, economic, democracy, scientific, and social justice issues, etc. We believe this constitutes a ‘fair use’ of any such copyrighted material as provided for in section 107 of the US Copyright Law. In accordance with Title 17 U.S.C. Section 107, the material on this site is distributed without profit to those who have expressed a prior interest in receiving the included information for research and educational purposes.  If you wish to use copyrighted material from this site for purposes of your own that go beyond ‘fair use’, you must obtain permission from the copyright owner.


NOTICE  Information on these pages contains forward-looking statements that involve risks and uncertainties. Markets and instruments profiled on this page are for informational purposes only and should not in any way come across as a recommendation to buy or sell in these assets. You should do your own thorough research before making any investment decisions. MATASII.com does not in any way guarantee that this information is free from mistakes, errors, or material misstatements. It also does not guarantee that this information is of a timely nature. Investing in Open Markets involves a great deal of risk, including the loss of all or a portion of your investment, as well as emotional distress. All risks, losses and costs associated with investing, including total loss of principal, are your responsibility.