SPX FIB PRICE & TIME ANALYSIS
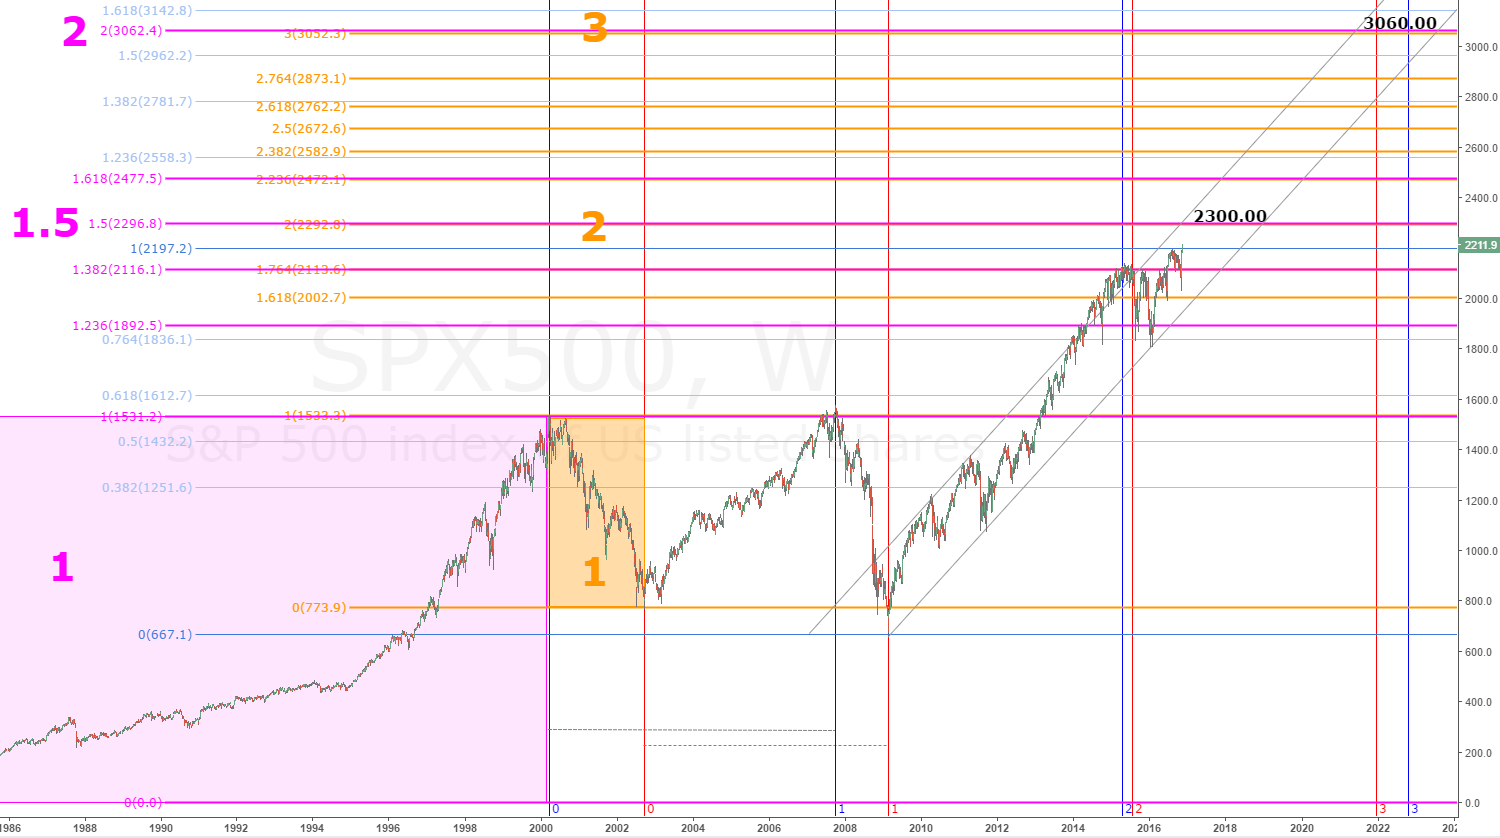
Our fist chart for SPX is taking a look at some Fibonacci price & time objectives. We've seen this chart before: take a look at the previous post where I explain the current Fib level we have reached and how it was derived.
If the market continues to lift through the current level, our next target level to look towards is 2300.00.
2300 is 1.5 x the measured distance 1, which represents the total lift of the market from 00.00 to the highs in 2000.
2300 is also 2 x the size of the drop we can see that occurs from the 2000 highs to 2002 lows.
I have also added a longer term projection, based on the Fib levels and the current channel the market has been lifting in since 2008. Note that we have a 2x and 3x confluence of the Fib extensions around 3060.00. IF the market continues on its current trajectory then this level could be reached by the end of 2021.
Note the confluence of Fib levels at 2558-82 and 2762-81. We would expect to see a market reaction of some sort at these levels (i.e.: pause, correction, pull back)
Technically this is what is possible until we see the market fall out of the grey channel. IF this occurs before we reach 3060, then we would expect it to do so at one of the indicated Fibonacci clusters.
SPX WEEKLY
The current weekly bar has broken through the Fib extension at 2200.00. Significant technicals can be seen directly above the market and we need to watch and see if these will be respected or not. Note UBB's are also aligning with the s/r's.
The market has moved back in to a long term channel (light red) - watching to see if it will again be respected and followed.
If the market finds resistance and starts to fall off, several significant technicals need to broken offering technical trigger consideration for a move to the next technical. Any reversal has the potential for a large move to retest the 2000 / 2008 highs around 1530.00.
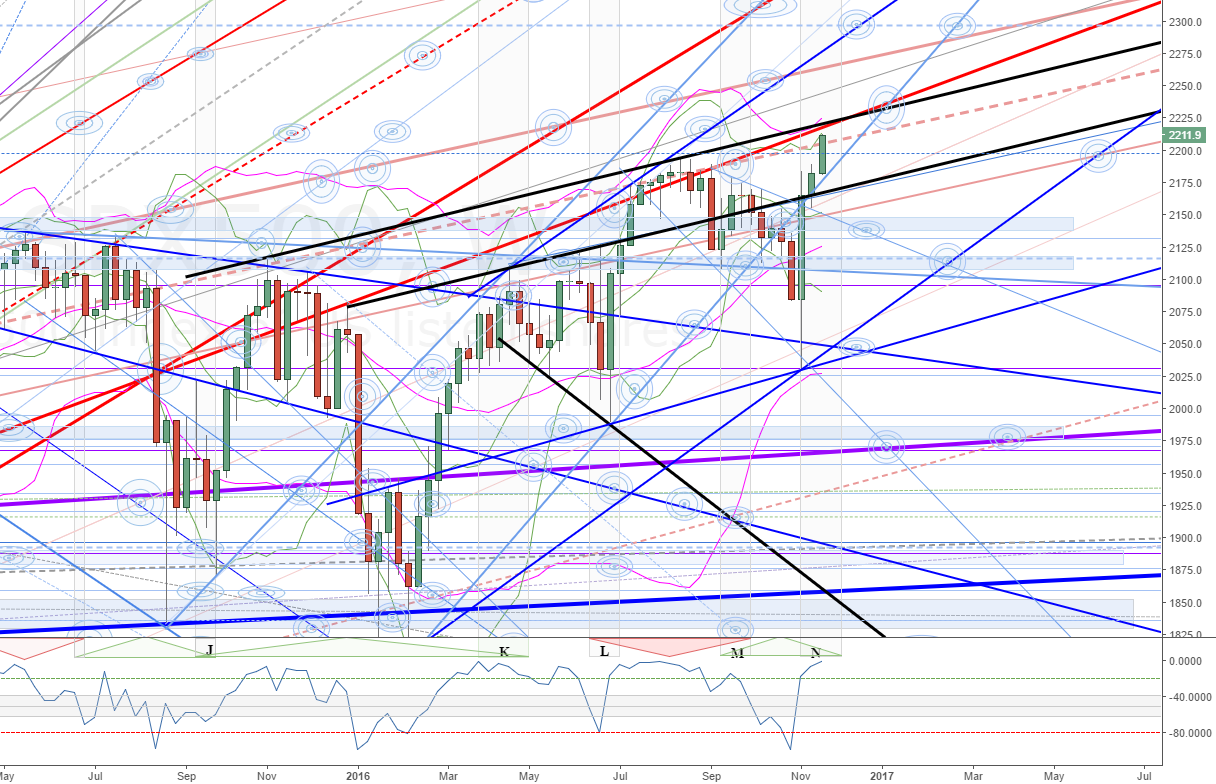
SPX DAILY
Black s/r come from the previous two highs; red s/r goes back a while and has been both support and resistance. These are the next technicals we are watching for a break or bounce from.
Lifting up through these could see another explosive move from the market, similar to the initial lift off the bottom and start of the current wave.
Resistance would have us watching for a consolidation with a potential to drop back to the lower black channel support. Breaking through this would have us considering a reversal and looking back to the lows where the current lift started.
