THE FED HAS ANOTHER INTERNAL INFLATION INDEX FEW ARE (YET) AWARE OF
Just Released: A Monthly Underlying Inflation Gauge
Today marks the launch of the monthly publication of the Underlying Inflation Gauge (UIG). We are reporting two UIG measures, describedrecently on Liberty Street Economics, that are constructed to provide an estimate of the trend, or persistent, component of inflation. One measure is derived using a large number of disaggregated price series in the consumer price index (CPI), while the second measure incorporates additional information from macroeconomic and financial variables. The trend component of inflation plays a critical role in many economic and financial decisions. Because this variable is not directly observed, researchers have proposed a number of approaches to estimate it. An attractive feature of the UIG is that it identifies sustained movements in inflation using information from a large data set. It has also shown more accurate forecasts of inflation compared with core inflation measures. More extensive discussion of the UIG’s design and usefulness for policymakers, market participants, and the public can be found in a new article in the New York Fed’s Economic Policy Review as well as in this staff report.
The monthly publication will feature a chart depicting the behaviors of CPI inflation and the UIG measures, and will include commentary and various summary points relating to the statistical framework and methodology employed. For those interested in using the inflation gauge for analysis, we are excited to announce that we will post spreadsheet data containing the values of the UIG measures, with estimates going back to 1995. In addition, we will begin to archive the corresponding report and spreadsheet data set for each monthly release.
The UIG measures will be estimated after the monthly release of the CPI report from the U.S. Bureau of Labor Statistics and will be posted that afternoon at 2:30 p.m.—subject to restrictions on communications during blackout periods surrounding Federal Open Market Committee meetings. When such restrictions apply, we will post the UIG measures on the first morning following the end of a blackout period at 7:00 a.m. (which will typically be a Friday). The UIG web page on the New York Fed’s public website provides a publication schedule for the monthly reports.
COMMENTARY:
Central bankers keep lamenting the fact that record low interest rates and record high currency creation haven’t generated enough inflation (because remember, for these guys inflation is a good thing rather than a dangerous disease).
To which the sound money community keeps responding, “You’re looking in the wrong place! Include the prices of stocks, bonds and real estate in your models and you’ll see that inflation is high and rising.”
Well it appears that someone at the Fed has finally decided to see what would happen if the CPI included those assets, and surprise! the result is inflation of 3%, or half again as high as the Fed’s target rate.
(Bloomberg) – More than 20 years ago, former Fed Chairman Alan Greenspan asked an important question “what prices are important for the conduct of monetary policy?” The query was directly related to asset prices and whether their stability was essential for economic stability and good performance. No one has ever offered a coherent answer even though the recessions of 2001 and 2008-2009 were primarily due to a sharp correction in asset prices.
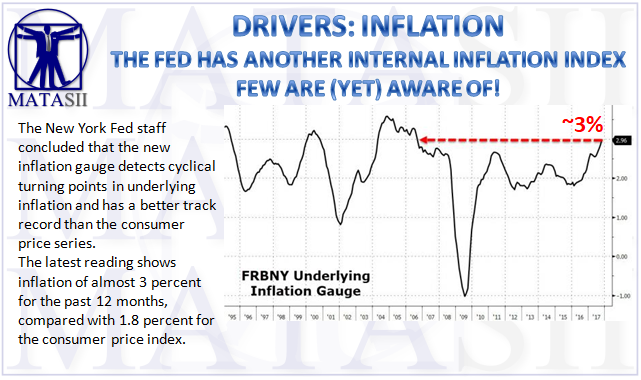
A new underlying inflation gauge, or UIG, created by the staff of the New York Fed may finally provide the answer. Its broad-based measure of inflation includes consumer and producer prices, commodity prices and real and financial asset prices. The New York Fed staff concluded that the new inflation gauge detects cyclical turning points in underlying inflation and has a better track record than the consumer price series.
The latest reading shows inflation of almost 3 percent for the past 12 months, compared with 1.8 percent for the consumer price index and 1.8 percent for core consumer prices, which exclude food and energy. Since the broad-based UIG is advancing 100 basis points above CPI, it indicates that asset prices are large, persistent and reflect too easy monetary policy.
The UIG carries three important messages to policy makers: the obsessive fears of economy-wide inflation being too low is misguided; monetary stimulus in recent years was not needed; and, the path to normalizing official rates is too slow and the intended level is too low.
Harvard University professor Martin Feldstein stated in a recent Wall Street Journal commentary that “The combination of overpriced real estate and equities has left financial sector fragile and has put the entire economy at risk.” If policy makers do not heed his advice odds of another boom and bust asset cycle will be high — and this time they will not have the defense mechanisms they had after the equity and housing bubbles burst.

To summarize, a true measure of inflation – one that is highly correlated with the business cycle – is not only above the Fed’s target but accelerating.
Note on the above chart that both times this happened in the past a recession and bear market followed shortly.
The really frustrating part of this story is that had central banks viewed stocks, bonds and real estate as part of the “cost of living” all along, the past three decades’ booms and busts might have been avoided because monetary policy would have tightened several years earlier, moderating each cycle’s volatility.
But it’s too late to moderate anything this time around. Asset prices have been allowed to soar to levels that put huge air pockets under them in the next downturn. Here’s a chart that illustrates both the repeating nature of today’s bubble and its immensity.

In other words, it is different this time - it’s much worse.