THE THE POWELL PUT
THE MOST IMPORTANT NUMBER IN 2022
First of all, POWELL’S PUT is not a market price nor is it a percentage drop in the market. It is the Real Fed Funds Rate dictated by the timing and speed of Powell’s inevitable coming rate increases.
Many are confused because Powell has begun reducing the rate of monthly liquidity injections (as well as doubling the rate further), yet the markets have only reacted with increased volatility – at least so far?
|
What few appreciate is that markets actually react with volatility when liquidity injections slow and then rise when the Fed actually begins the tightening process with Fed Fund rate increases. At least initially!
“TURBO TAPER”
|
|
|
FOMC MEETING – DECEMBER 15th, 2021
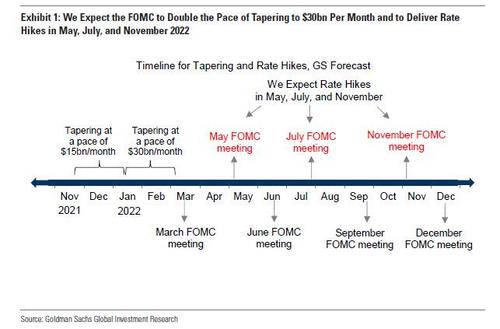
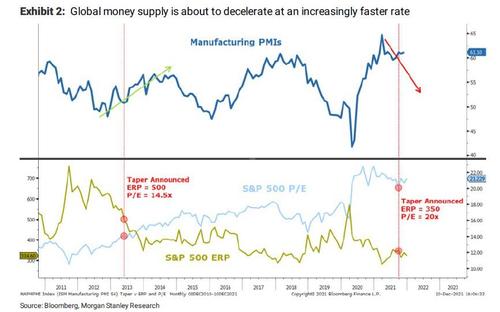
The market was not the least bit surprised by the December 15th decision by the Fed to decelerate the rate of Quantitative Easing or what is referred to as the process of “TAPER”. The Federal Reserve announced doubling its current rate to $30bn/month. The chart below is as accurate today as it was when it was issued by Morgan Stanley prior to the Powell’s announcement. Why? Because it was no surprise to anyone because the roadmap ahead is clear.
|
|
|
The only thing we disagree with is that we feel there will be three rate hikes in 2022 which will be larger and more aggressive than Morgan Stanley’s chart above. We expect 50 basis points to come out of the March FOMC meeting; with a special shock announcement of 50 points in the spring; followed by a final 25 more basis points coming out of the June FOMC meeting.
WORKING WITHIN PREDICTABLE BOUNDARY CONDITIONS
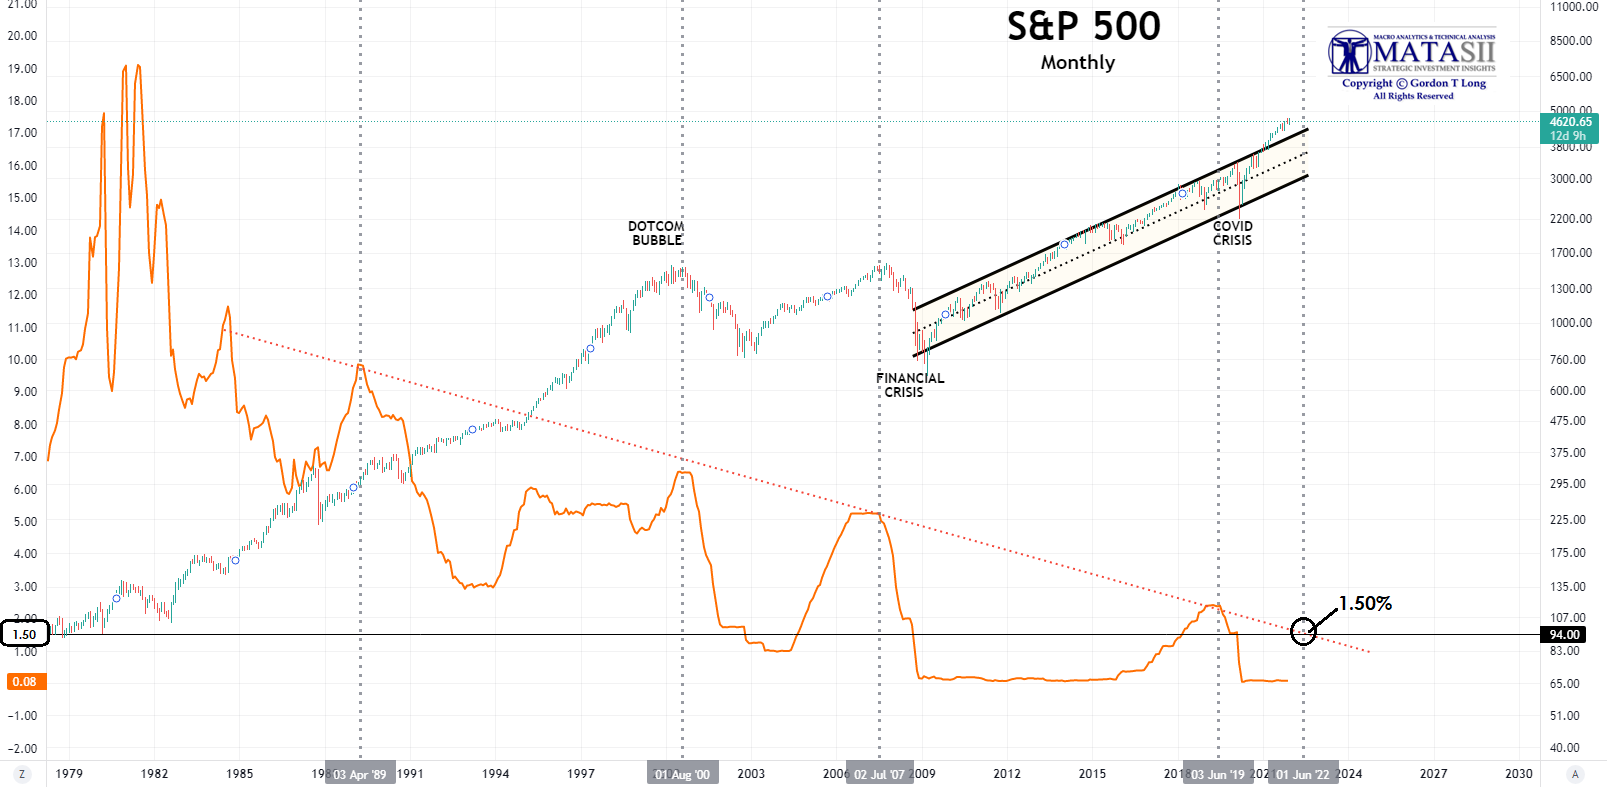
The chart below overlays the history of the Fed Funds Rate with the S&P 500. The scales of either are on opposite vertical axis. A Nominal Rate approximating 1.50% marks a potential upper limit for the Fed Funds Rate depending on how aggressive the Fed is. The more aggressive the more room it actually has to maneuver. However, too aggressive and the markets normally react badly.
|
|
|
IT’S ABOUT THE REAL RATE
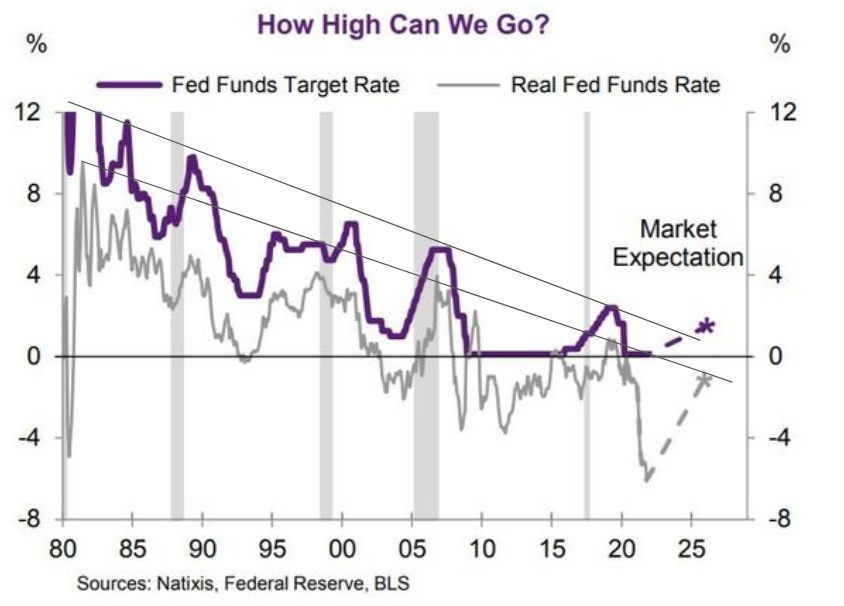
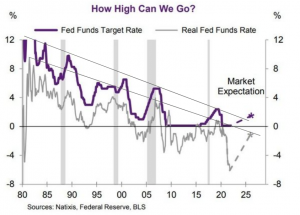 We featured the Fed Funds Rate chart (to the right) in our last newsletter, but had insufficient space to take it further. The Fed has only so much room to move before causing another Financial Crisis. We featured the Fed Funds Rate chart (to the right) in our last newsletter, but had insufficient space to take it further. The Fed has only so much room to move before causing another Financial Crisis.
As the chart illustrates, the Fed must keep the nominal Fed Funds Rate positive while having a negative Real Fed’s Rate which is desired to accommodate reducing the US debt burden (via Financial Repression).
Most importantly however is, over the four decades since price rises peaked under Paul Volcker, inflation has quite often exceeded the fed funds rate (meaning that the real fed funds rate is negative) but all hiking cycles have ended with the Fed Funds rate above inflation.
This time with inflation so high and the Fed Funds Rate so low the boundary condition may in fact be lower.
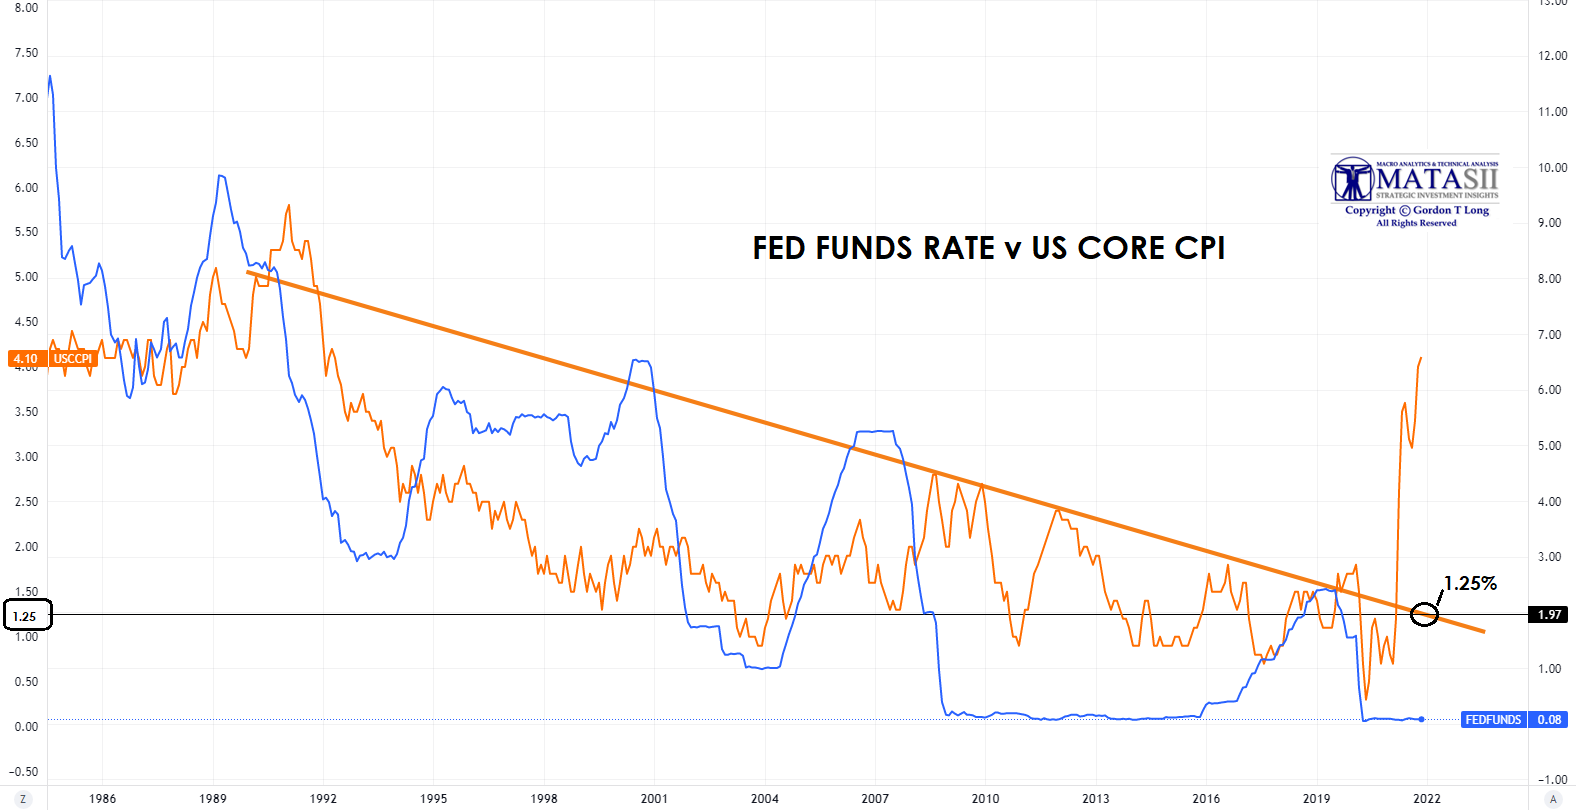
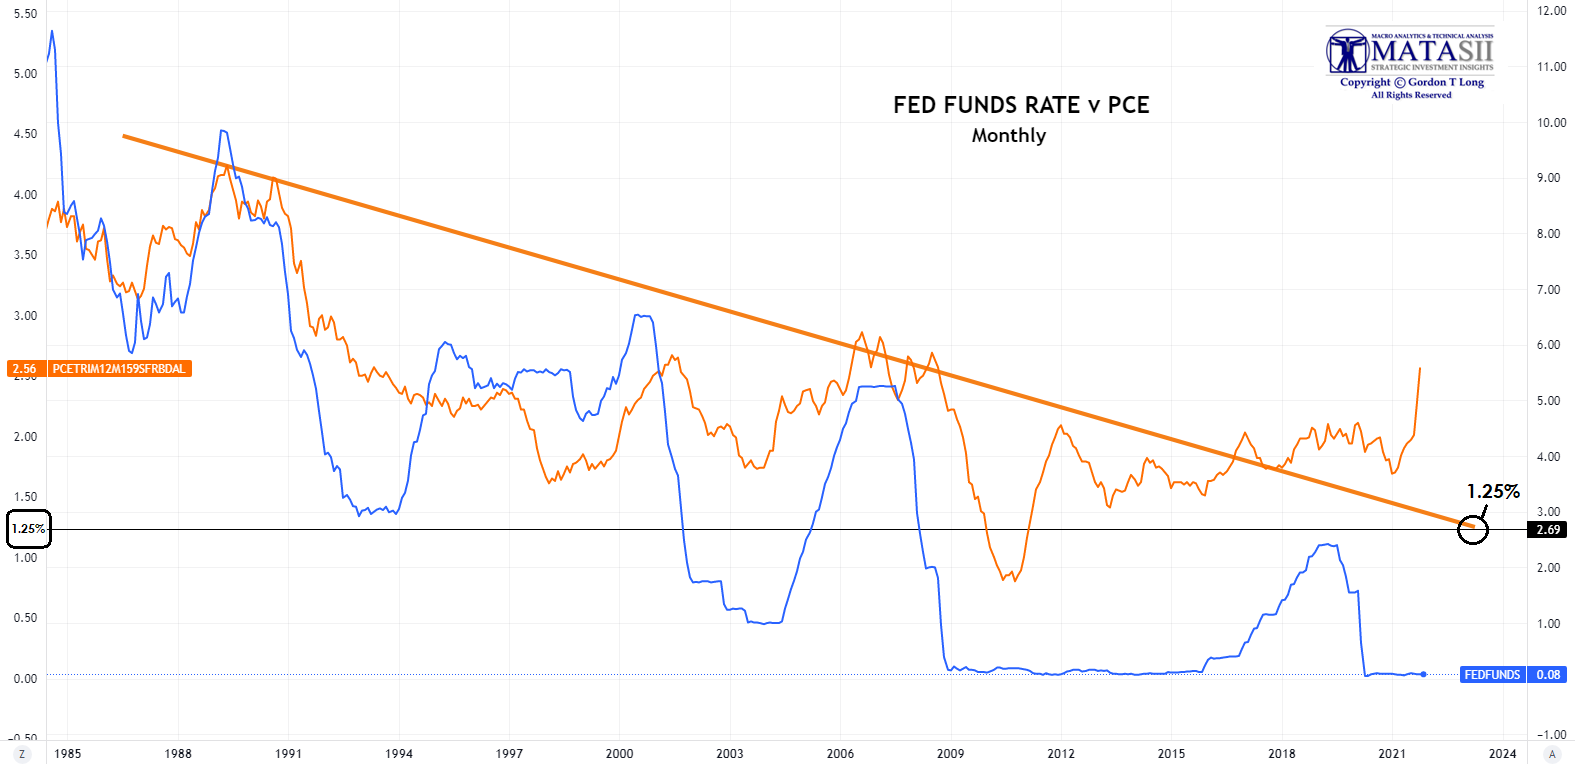
WHAT INFLATION RATE DO YOU USE??
Choosing the right Inflation rate is critically important and frankly quite difficult. We have done a lot of analysis and concluded the right ones to use are the Fed’s preferred inflation gauge (the PCE) or the Core CPI (both are shown below).
What we found was quite surprising. They both led us to the same nominal inflation rate (based on trend and ignoring the currently reported inflation rates which we will discuss below) of 1.25%. This is below the Fed Funds rate break point shown above. This is what we normally should expect as the real rate becomes positive and is lower than the Fed Funds rate trending break point.
|
|
 |
|
The Fed Funds Rate can’t go above 1.25%
|
|
|
THE RATE FIX IS IN!
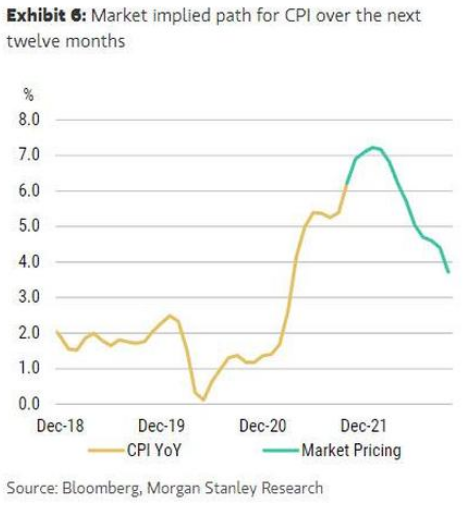
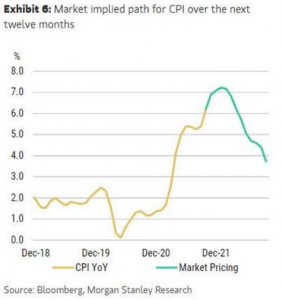 Adjustments to the CPI using Substitution, Hedonics, Imputation etc. are presently insufficient to achieve manageable “expectation” levels for the Inflation Rate. That will require what the US Government has just announced to become effective January 1st. We fully expected something like this (and more less public adjustments). The chart to the right can be expected to show something dramatically lower by June 2022. Adjustments to the CPI using Substitution, Hedonics, Imputation etc. are presently insufficient to achieve manageable “expectation” levels for the Inflation Rate. That will require what the US Government has just announced to become effective January 1st. We fully expected something like this (and more less public adjustments). The chart to the right can be expected to show something dramatically lower by June 2022.
The BLS has reported, starting next month, it will adjust the weights for its Consumer Price Index basket, which will be calculated “based on consumer expenditure data from 2019-2020.”
Alas, there is no further detail on this critical topic, although we will take any bet that post-revision reported inflation will drop significantly because of, well, “adjustments.”
The inflation projection chart to the right can therefore be expected to drop significantly because items such as Owner Occupied Rents won’t have the dramatic reporting impacts it should. This in addition to other areas that have risen significantly since the BLS’ established 2019-2020 post Covid Pandemic surge.
|
|
|
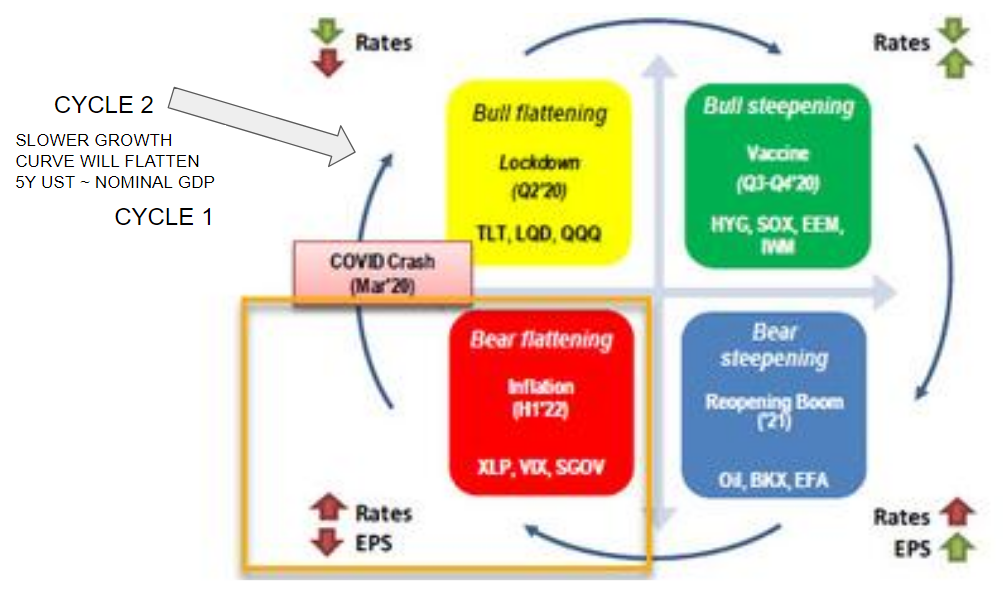
THE BUSINESS CYCLE DOES THE REST
The Fed believes that a slowing economy will put downward pressure on bond yields which will counter balance fighting the rising pressures on yields due to rising inflation.
As the cycle to the right and as we pointed out in out last newsletter there is a lot of analysis that this is a strong possibility.
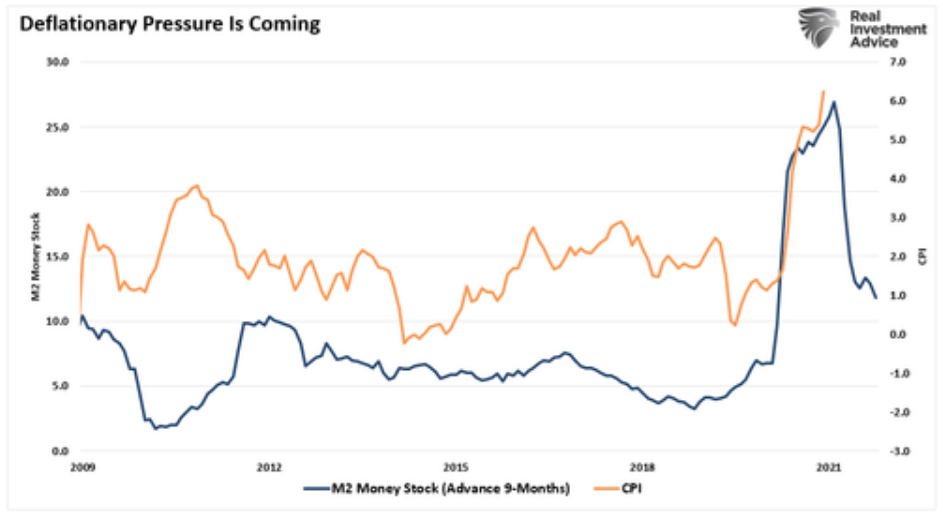
CHART 1: PEAKING INFLATION: Though inflation will stay high it is likely to abate slightly in the near term.
CHART 2: DEFLATIONARY PRESSURES due to reduced money stock are expected. Many countries (especially in Emerging Markets are already aggressively tightening).
DEMOGRAPHICS: With more workers both retiring and joining the approximately 100 thousand eligible US workers who have left the labor pool, It is expected that this will create further deflationary pressures as their spending is forced to moderate.
Time will tell if these factors assist the Fed in managing rates such that it still allows the government’s financial deficits to be funded, without surging interest expense.
|
|
|
|
CONCLUSION
Don’t be fooled by the shrinking rate of liquidity nor rising Fed Funds Rate as the real trigger for a market sell off. it is a necessary condition but not the trigger.
If you study the subscriber chart below (FED FUNDS RATE versus S&P 500 CHART: SUBSCRIBER LINK) you will see that historically markets have actually risen during these periods in advance of a market sell-off! However, a sell-off is ahead but likely further out than most currently expect.
It’s only when the Real Fed Funds Rate goes positive that financial markets come apart!
|
|
|