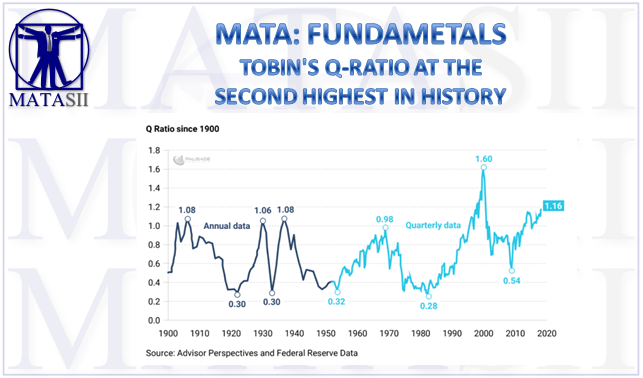
TOBIN'S Q-RATIO AT THE SECOND HIGHEST IN HISTORY
There’s an important market metric that’s signaling huge downside ahead. I’m talking about the Tobin Ratio – otherwise known as the ‘Q-Ratio’. . .
Created by Nobel Laureate James Tobin, the Q-Ratio is a method for investors to gauge the fair value of all firms relative to their combined market values.
This ratio is different than Buffet’s favorite metric (combined market caps-to-GDP). And it’s also one of Mark Spitznagel’s favorite ways to look at equity valuations. . .
The formula is to take the combined market cap value of all firms (how the markets valuing them) and divide it by the replacement costs of all its companies (how much it would cost to rebuild the business).
But a simpler method is. . .
Q-ratio = equity market value / equity book value
A one-to-one ratio means that market values and replacement costs are equal.
But if the ratio is between zero-to-one (0-1) then equities are cheap and are a “buy”. But if it’s over-one, stocks are expensive and should be avoided/sold.
Since 1901, the Q-ratio has averaged .70 – therefore anything higher than .70 is considered overvalued, and anything below is considered undervalued.
So, what’s the Q-ratio at today, and how has it held up historically?

Currently, the ratio is at 1.16 – and it’s the second highest on record.
You can see that over the last 117 years, the Q-ratio has done a good job signaling when the market is cheap and when it’s expensive.
Unfortunately, the Q-ratio isn’t good for market timing. And it’s also not a short-term metric.
This is meant to show the markets longer-term outlook.
The takeaway from all this is that when the ratio is above .70, stocks are expensive. And there’s a greater risk for a market correction.
Or putting it another way: the higher it is above .70, the more negatively asymmetric (higher risk, lower reward) equities become (vice versa when below .70)
And even though the ratio’s at it’s second all-time highest, it doesn’t mean it can’t go higher.
All I’m saying is that each time it does go higher, there’s a greater risk for future downside. . .
Equities are at very fragile levels and signaling huge downside ahead for equities.
It may not happen tomorrow. It may not happen next week. But the risk of market prices declining are increasing daily.