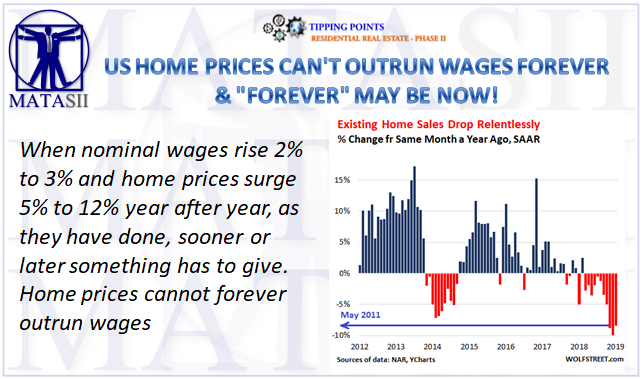
US HOME PRICES CAN'T OUTRUN WAGES FOREVER & "FOREVER" MAY BE NOW!
A PUBLIC SOURCED ARTICLE FOR MATASII (SUBSCRIBERS & PUBLIC ACCESS) READERS REFERENCE

SOURCE: 02-21-19 - WolfStreet.com - "The US Housing Market Begins to Feel the Pain"
MATASII SYNTHESIS:
Fact: Home prices cannot outrun wages forever!
- Sales of “existing homes” – single-family houses, townhouses, condos, and co-ops – across the US dropped
- 8.5% in January from a year earlier, to a seasonally adjusted annual rate (SAAR) of 4.94 million homes,
- 10.1% in December
- 8.9% in November.
- All three were the biggest year-over-year drops since May 2011, during the final throes of Housing Bust.
- Decline in sales volume is occurring despite the large drop in mortgage rates since early November.
- By region, with the West consistently in deepest trouble:
- Northeast: -1.4%, to an annual rate of 700,000.
- Midwest: -7.9%, to an annual rate of 1.16 million.
- South: -8.4%, to an annual rate of 2.08 million.
- West: -13.8%, to an annual rate of 1.00 million.
- Inventory of homes for sale at the end of January rose 4.6% year-over-year to 1.59 million homes. At the current rate of sales, this represents 3.9 months’ supply. This is not a fiasco level, but it’s up nearly 15% from a year ago
- Median home prices by region:
- Northeast: +0.4%% year-over-year, to $270,000.
- Midwest: +1.4% at $189,700
- South: + 2.5% year-over-year, to $214,800.
- West: +2.9% year-over-year, at $374,600.
When nominal wages rise 2% to 3% and home prices surge 5% to 12% year after year, as they have done, sooner or later something has to give. Home prices cannot forever outrun wages
The market, if it’s allowed to, can fix the affordability problem that exists in many cities in the US by finding price levels were first-time buyers can afford to buy a home with the income they’re making. At its glacial pace, this is starting to happen in some markets, with sales volume dropping, and inventories rising, and sellers having to step down the aspirational ladder to make deals. In some of these markets, price levels have a long way to go before they make sense, where a household with a median income on the local scale can afford a median home. And there are now enough local housing markets that have turned south to where the impact is starting to creep into national averages.
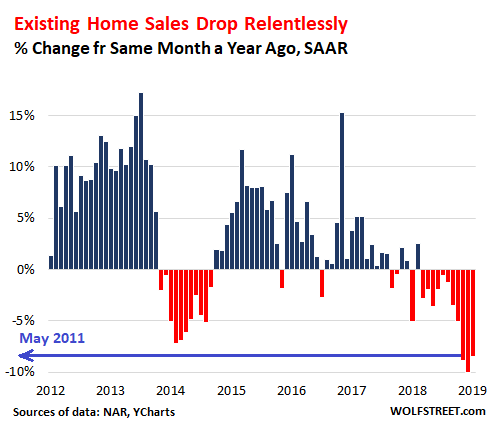
Sales of “existing homes” – single-family houses, townhouses, condos, and co-ops – across the US in January dropped 8.5% from a year earlier, to a seasonally adjusted annual rate (SAAR) of 4.94 million homes, according to the National Association of Realtors, after having dropped 10.1% year-over-year in December and 8.9% in November. All three were the biggest year-over-year drops since May 2011, during the final throes of Housing Bust 1 (data via YCharts):
This decline in sales volume is occurring despite the large drop in mortgage rates since early November. But hope continues: “Existing home sales in January were weak compared to historical norms; however, they are likely to have reached a cyclical low,” according to the report. “Moderating home prices combined with gains in household income will boost housing affordability, bringing more buyers to the market in the coming months.”
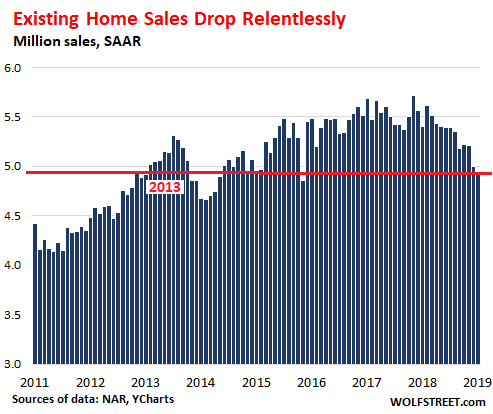
I’m not sure about the reasoning, but it could very well be that home sales ratchet up from here because nothing goes to heck in a straight line. The chart below illustrates the decline in home sales volume since late 2017 (data via YCharts):
By category, sales of single-family houses in January dropped 8.4% from a year earlier to a seasonally adjusted annual sales rate of 4.37 million. Condo sales dropped 9.5% year-over-year to a rate of 570,000. By region, with the West consistently in deepest trouble:
- Northeast: -1.4%, to an annual rate of 700,000.
- Midwest: -7.9%, to an annual rate of 1.16 million.
- South: -8.4%, to an annual rate of 2.08 million.
- West: -13.8%, to an annual rate of 1.00 million.
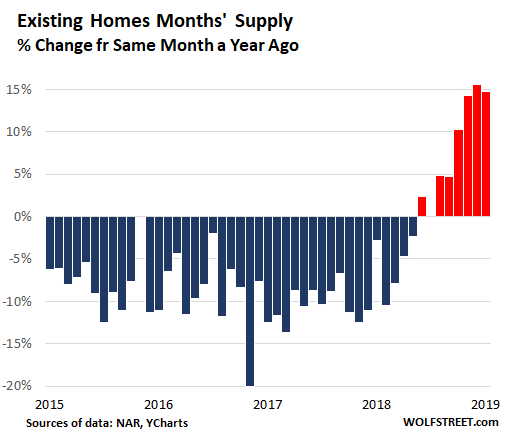
Inventory of homes for sale at the end of January rose 4.6% year-over-year to 1.59 million homes. At the current rate of sales, this represents 3.9 months’ supply. This is not a fiasco level, but it’s up nearly 15% from a year ago (data via YCharts):
Declining sales and rising inventories are gingerly starting to have an impact on prices at the national level – something we have seen play out more brutally on a local level.
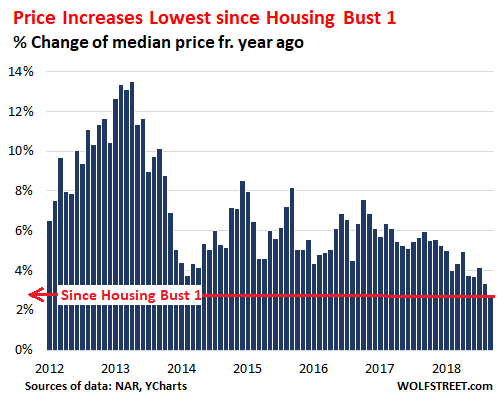
The median price in January, at $247,500, was still up 2.8% from a year earlier, the lowest year-over-year increase since 2012, with house prices rising 3.1% and condo prices remaining flat. This chart shows the year-over-year price changes in percentage terms (data via YCharts):
The chart above shows the disconnect: When nominal wages rise 2% to 3% and home prices surge 5% to 12% year after year, as they have done, sooner or later something has to give. Home prices cannot forever outrun wages – because it eliminates layer after layer of buyers. When there are no buyers at a price point, there is no sale. And for there to be a sale, the price has to come down.
Median home prices by region:
- Northeast: +0.4%% year-over-year, to $270,000.
- Midwest: +1.4% at $189,700.
- South: + 2.5% year-over-year, to $214,800.
- West: +2.9% year-over-year, at $374,600.
The disconnect between prices and where the buyers are was pointed out by the NAR report, though from a slightly different perspective. Inventories are rising and there is no shortage of housing per se, but it’s the wrong kind of inventory, after years of sharp price increases. “In particular, the lower end of the market is experiencing a greater shortage,” the NAR report explained.
That “shortage” at the low end exists because prices have outrun incomes. There is no magic to it. The market can fix that when sellers are motivated enough to make deals and cut prices across the spectrum to where the buyers are. This doesn’t happen overnight. It happens over the years, market by market. And eventually it shows up in the national averages.
There is a whole generation looking forward to the moment when they can afford to buy a home in these out-of-whack markets, though that’s still a while off. Those are the buyers of the future – and eventually prices will have to meet them. There are a host of other economic benefits triggered by lower home prices, such as buyers having more money left over to spend on other things, which would give other parts of the economy a sorely needed boost. Gradually unwinding some of the home-price inflation of recent years is not the end of the world.
FAIR USE NOTICE This site contains copyrighted material the use of which has not always been specifically authorized by the copyright owner. We are making such material available in our efforts to advance understanding of environmental, political, human rights, economic, democracy, scientific, and social justice issues, etc. We believe this constitutes a 'fair use' of any such copyrighted material as provided for in section 107 of the US Copyright Law. In accordance with Title 17 U.S.C. Section 107, the material on this site is distributed without profit to those who have expressed a prior interest in receiving the included information for research and educational purposes. If you wish to use copyrighted material from this site for purposes of your own that go beyond 'fair use', you must obtain permission from the copyright owner.
NOTICE Information on these pages contains forward-looking statements that involve risks and uncertainties. Markets and instruments profiled on this page are for informational purposes only and should not in any way come across as a recommendation to buy or sell in these assets. You should do your own thorough research before making any investment decisions. MATASII.com does not in any way guarantee that this information is free from mistakes, errors, or material misstatements. It also does not guarantee that this information is of a timely nature. Investing in Open Markets involves a great deal of risk, including the loss of all or a portion of your investment, as well as emotional distress. All risks, losses and costs associated with investing, including total loss of principal, are your responsibility.