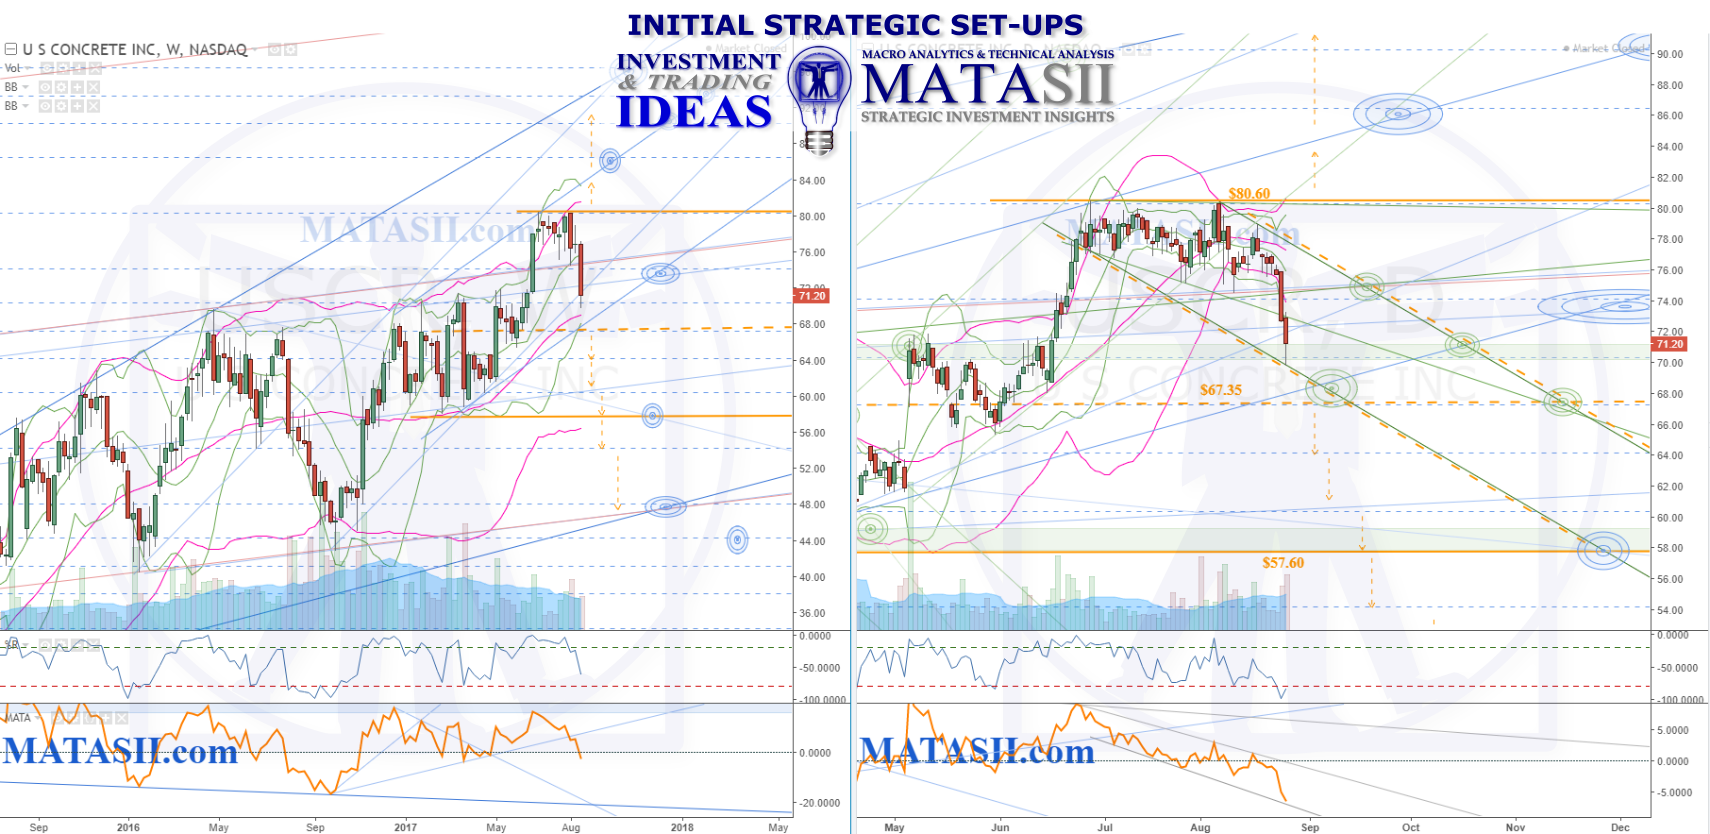
USCR has recently pulled back and and is approaching the weekly 34ma (left chart, pink ma). This offers potential opportunity for the market to bounce from the 34ma and lift to the UBB, or break through and drop to the LBB. Note that these BB's are roughly aligning with recent market highs and the lows of 2017. These levels are at significant technicals and are highlighted with solid orange. Breaking through them could mean the continuation of the recent trend up, or a drop back towards the lows of 2016.
The daily chart on the right highlights other significant technicals (orange dashed) inside those noted on the weekly. These, and the other technicals that can be seen, offer potential opportunities for a move to the next technical, up or down, if held or broken.
Note the sideways consolidation pattern that can be seen on the weekly chart from the start of 2017 until about May 2017: something similar could unfold again, if not the same pattern than another consolidation. Breaking or holding the significant technicals could offer clues as to if anything is going to occur or not.