VIDEO TRANSCRIPTION: IN DEPTH - SII Q3 UPDATE
ILLUSION OF GROWTH:
In my 2017 Thesis paper entitled: "The Illusion of Growth" (which can be found on MATASII subscriber site under Annual Thesis), I argued in 110 pages that US Economic growth is not as reported because the GDP formula is both archaic and misleading. I recently posted at MATASII.com on September 29, 2017 an article entitled "An Archaic GDP Formula Hides the Fact the USA is Already in a Depression!", that gave an additional perspective on my views.
The central issue is, do you consider debt as income? I do not!
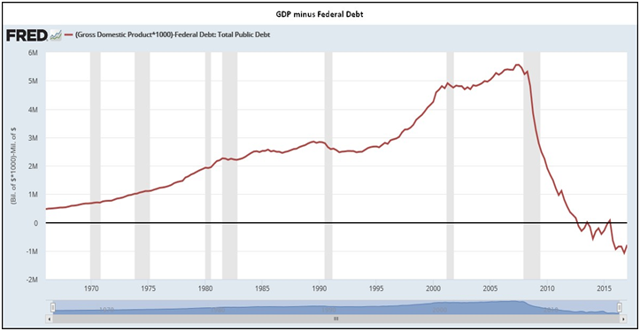
A a consequence, if you acknowledge for the sake of argument that government debt is not actual national income, the following graph is how the U.S. economy looks like excluding stimulus. This is Actual GDP excluding artificial stimulus.
The US is in actual fact in an economic depression. Only a flawed perspective shields us from the startling reality
The Internet Is Changing Everything
In addition we are facing historic pressures which are changing the underlying fabric of our economic and financial system.
- How we Do Business,
- How we Live,
- How we Communicate
As great as technology is, it has become an employment income destructive force. Someday everyone will realize this.
AN EMPLOYMENT INCOME DESTROYING FORCE

MINSKY MELT-UP
We argued in previous SII updates that we had two Tectonic Forces in play. The end of the Debt Super Cycle versus the Government & Central Bankers policy initiatives to keep the game alive.
So far the later are winning as the "Minsky Melt-up" continues higher. For how much longer may not be as important as understanding hat will occur when the central bankers loss control.
I am watching closely to see whether Japan's targeting of real per-capita growth is the dominant strategy that will unfold? As I pointed out in the latest UnderTheLens and Macro Analytics videos we may soon see new forms of "Nationalization" using Facility Guarantees and Conservatorships emerge to keep financial markets from imploding from their own weight of over leverage. 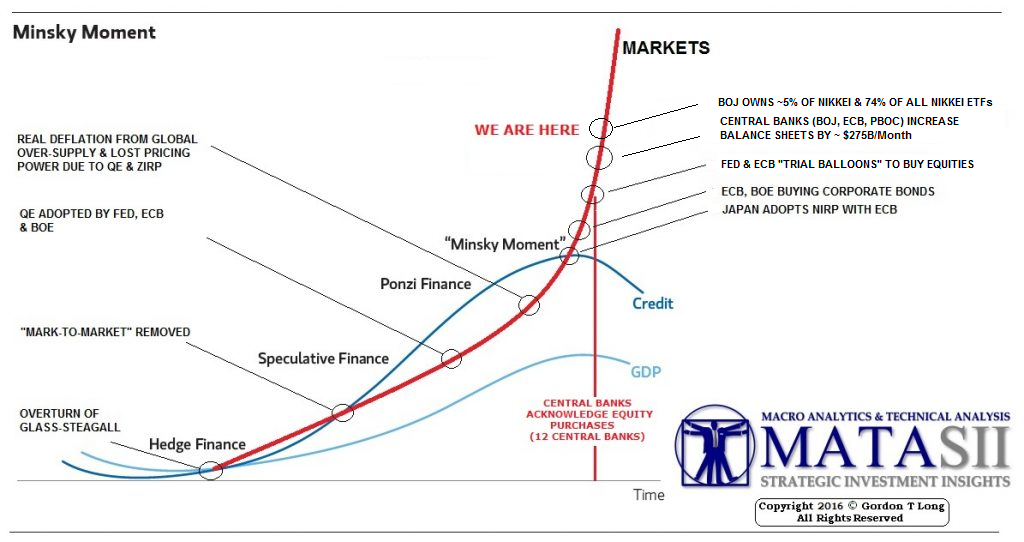
RETAIL:
Based on this lets first talk US Retail, one of our SIIs.
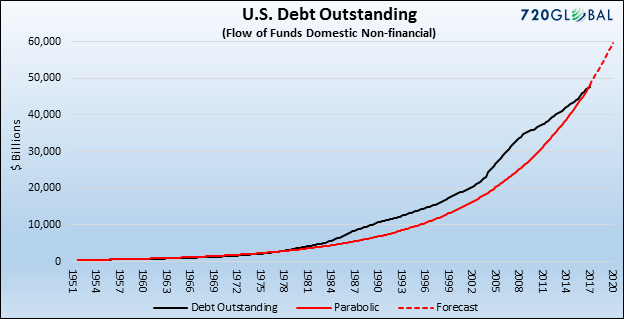
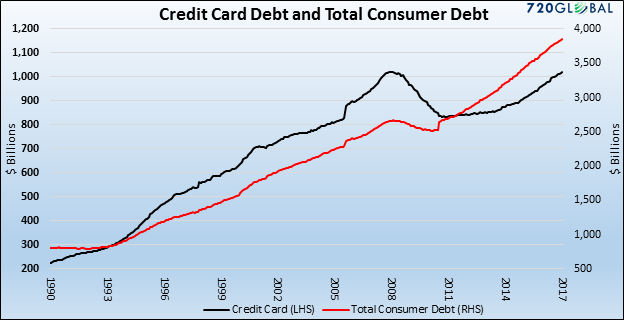
Debt Growth is Powering 70% US Economy
Currently the US Economy is nearly a 70% consumption economy. That level of consumption is dependent on debt continuing to grow parabolically as shown here in red. Is that possible?
Consumer Credit & Transfer Payments Now 44% of Consumption
Few appreciate that 44% of that economic consumption is now totally fueled by new credit creation.
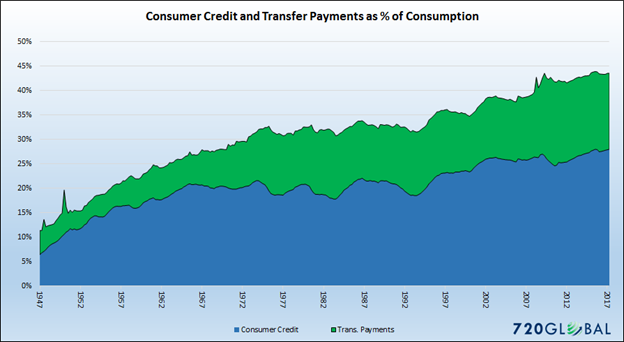
This is not a new problem. What is new is the magnitude of new credit required to be created and the methods being used to create it.
The black line in this graphic shows how Disposable Income less the Cost of Living has been squeezing American ability to consume. What has offset that is more personal debt and credit growth (shown in red) as well as government transfer payments like food stamps to 52 million Americans, Disability payments etc.
How long this can go on is not today's subject but rather the pressures it is putting on the US Retail sector.

More Being Spent on ‘Big Ticket Items”
Squeezed by weak income gains, higher healthcare and education costs, and the burdensome load of debt from years past, consumers simply have less money to spend and appear less inclined to spend what they do have on apparel and other department store goods. Further, they have little propensity to borrow to consume more!
Non-Store retailers Sales 10% of Total Retail Sales.
Since January 2016, department store sales (year over year) declined in every month except two. A continuation of these trends has major implications for retail stalwarts like Macy’s and Nordstrom as well as commercial and retail real estate.
More shopping is now done online, recently crossing the 10% mark, and how department stores have suffered a particularly steep decline in their share of overall US commerce. As a result, many big retailers are shuttering stores across the US. Sears, a venerable retailing chain that dates back to 1886, has announced plans to shutter more than 300 locations just this year. That will leave it with 1,150 stores, just over half the number five years ago.

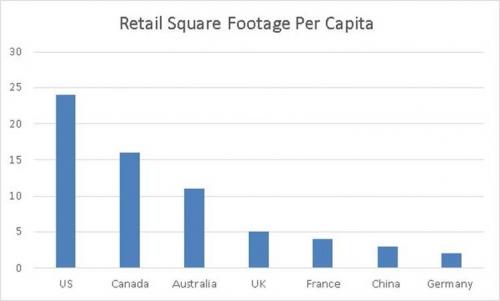
Over Stored
North America could well have too many shopping malls. On a per capita basis, the US has twice the space of Australia and 5 times that in the UK. Report estimates are for 25% of all shopping malls in the country could shut down by 2022 due to the current woes of the retail industry.
More Than 140M Sq Ft of Retail Space Closures
Credit Suisse recently estimated that as many as 8,640 stores with 147m sq ft of retailing space could close down in 2017 — which would surpass the level of closures after the financial crisis and dotcom bust.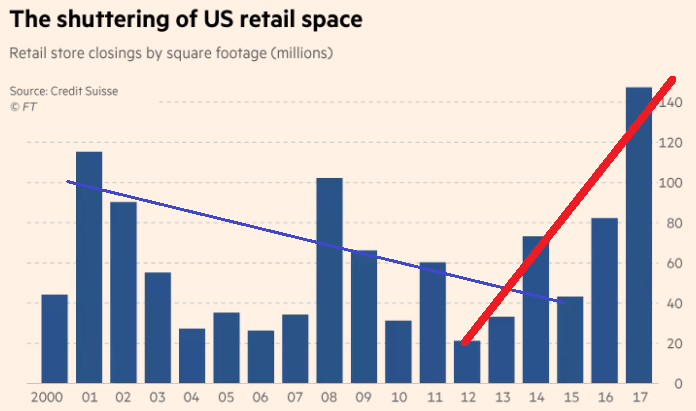
Plummeting Retail Employment
The retail sales associate is one of the most popular jobs in the country, with roughly 4.5 million Americans filling the occupation. In May, the US Bureau of Labor Statistics released data that found that 7.5 million retail jobs might be replaced by technology. The World Economic Forum predicts 30 to 50 percent of retail jobs will be gone once struggling companies like Gymboree fully hop on the digital train. Market
Watch found that over the last year, the department store space bled 29,900 jobs, while general merchandising stores cut 15,700 positions. At this rate, one Florida columnist put it soberingly, “Half of all US retail jobs could vanish. Just as ATMs replaced many bank tellers, automated check-out stations are supplanting retail clerks.”

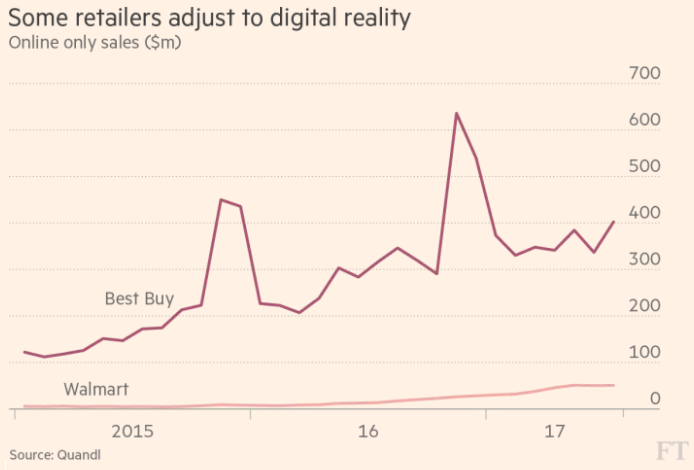
Some Are Adjusting Better Than Others
Surviving Retailers will do it the same way the savviest brick tenants are thriving today:
- By selling at the same price one can get anywhere on the net (never being undersold), by having great customer service, and
- By absorbing on-line ordering as an in-store service – you try on one shirt in the store, buy it, and then order five more on the spot from the retailer’s web site.
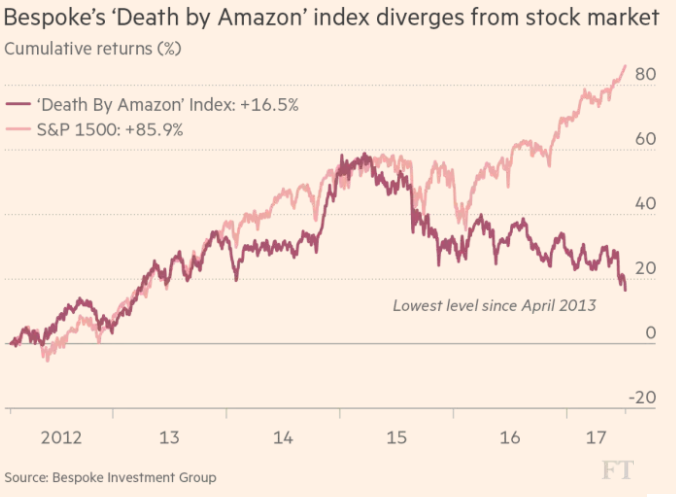
Death by Amazon!
Bespoke Investment Group has constructed a “Death by Amazon” index made up of companies most at risk from competition from Jeff Bezos’s online retailing juggernaut, and there has been a sharp divergence from the broader US stock market since 2015.
RETAIL INVESTMENT THESIS
Let's recap our Investment Thesis for Retail:
- SECULAR TREND
- Over Stored – 6 X
- 70% Consumption Economy
- Tapped Out Middle Class,
- Online Pricing Pressures
- Balance Sheet Debt Levels
- DISTRIBUTION MODELS
- Failed Dep't Store Model
- Mall Dependencies
What we saw in Q3 was:
2017 DEVELOPMENTS
- ACCELERATING -TIPPING POINT YEAR
- Worst Year In US Retail History,
- ~ 9-10K Store Location Closings,
- > 300 Bankruptcy Mid-Year Filings
- “AMAZON’ed”
- Critical Mass – Max Investment
- The “New Department” Store
- RETAIL ROBOTICS
- RESTAURANTS
- Next Wave
- Family Restaurant Chains
We refer you to the subscribers section for out targeted watch list of retailers by various categories we feel are most exposed. We have just added another section to retail focused on restaurants.
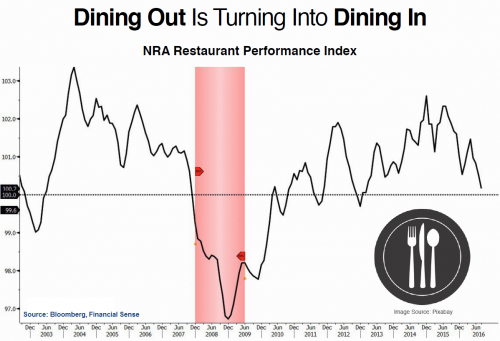
RESTAURANTS
Restaurants face similar issues as retailers with problems extending across all categories of the food service sector except the high-end segment. Restaurant same store sales have experienced 17 consecutive months of year-over-year declines. According to the July 2017 Restaurant Industry Snapshot, Black Box Intelligence reported:
“These are the weakest two-year growth rates in over three years, additional evidence that the industry has not reversed the downward trend that began in early 2015.”
Adjusting for inflation further clarifies the difficulties the sector faces. Wolf Richter at Wolfstreet.com adjusted sales at food service and drinking places for inflation (as shown below) and found that sales, as reported in June 2017, are up only 22% from the post-recession lows and have been stagnant since December 2015.
Restaurants – Casual Dining - US Mall Dependency
Our focus is on the casual dining segment with specific heavy dependency on Mall locations.
Show here is an example of what we are considering. Both for larger chains ,
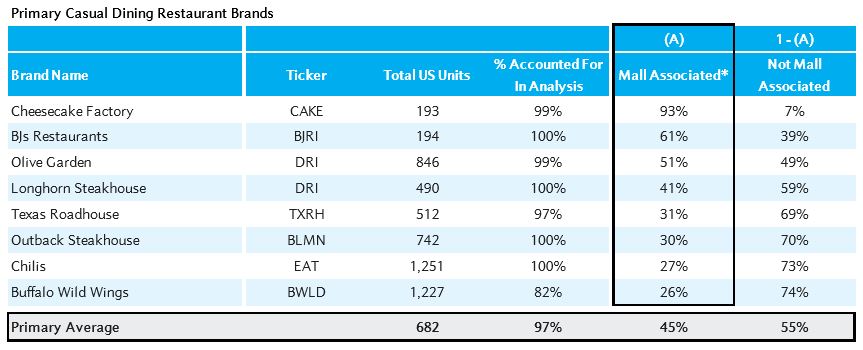
... and smaller chains.
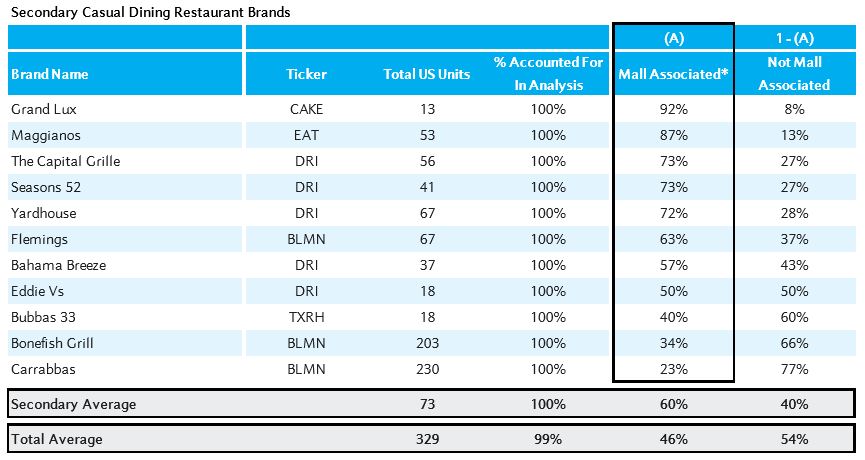
Though this chart is nearly impossible to read here (it is however available on the subscriber site).
The takeaway is which chains are most exposed and where.
- How many stores in hurricane hit areas like Florida, Texas, Louisiana or
- $15 Minimum wage pressures like California.
These and other factors are influencing our watch list selections for your consideration within your portfolio strategies for those meeting the qualifications for for shorting and being supported by your financial adviser.

RETAIL-AUTO
Let's shift to another SII - Retail Auto.
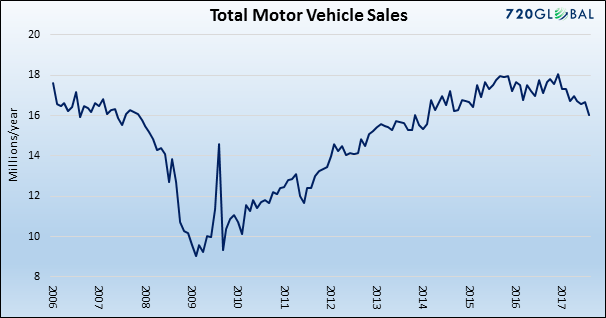
Auto sales appear to have peaked in late 2016, and used car prices have been in decline since 2014. Car and truck sales helped lead the economy out of the recession over the past eight years.
The surge in sales to new record levels was not solely due to outright sales but was heavily nourished by extensive use of lease financing.
Because of the reliance on leasing, cars rolling off leases topped 4 million units last year and are expected to rise by 11% in 2017 and 2018 and top 5 million units by 2019.
This is producing a glut of used cars on dealer lots and fueling the decline in used car prices. Projected used car prices, also known as residual value calculations, are a major component of the lease finance equation. As 11-12 million used vehicles hit the market over the next 2½ years, the stage is set for problems in the leased vehicle market and total car sales.
At their peak in February 2016, auto leases accounted for one-third of new car sales and the 6-month moving average remains above 30%. As the leasing option becomes more expensive and the used car supply continues to grow, new auto sales are likely to suffer.

The impact of the used car market on leasing can be seen through the purchase versus lease analysis table shown to the right.
A decline in used car prices (residual values) as is currently forecast dramatically alters lease payments, eliminating leasing as a lower-cost alternative.
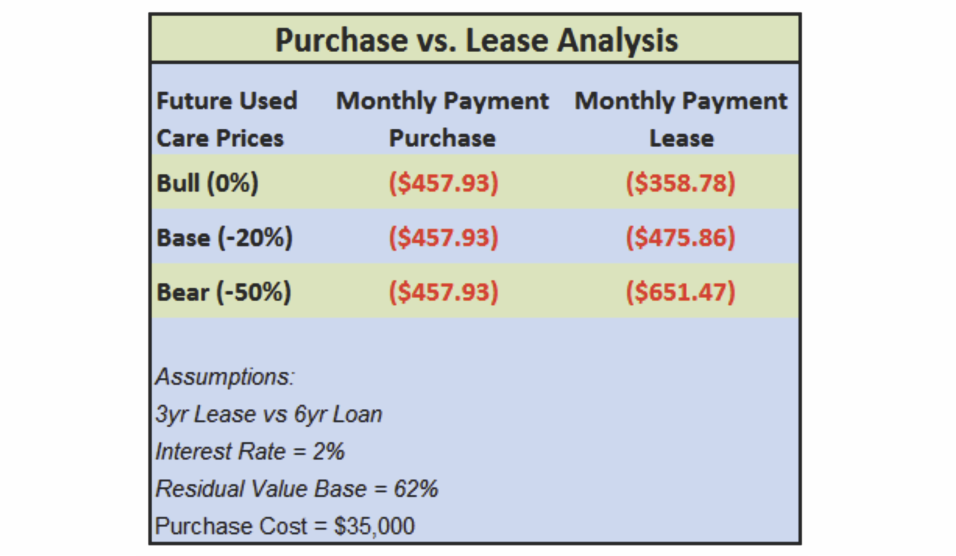
The bull, base and bear case for used car prices is based on forecasts from Manheim/Morgan Stanley.
The Investment Thesis for Retail-Auto is:
INVESTMENT THESIS
- CYCLICAL TREND
- Peak Sales ~ 18M
- Expect ~ 15.5M
- Possibly ~ 13.5,
- FINANCE TRAP
- 1/3 of Sales Are Lease
- Minimum 3 – 4 – 4 – 4 Million Returning
2017 DEVELOPMENTS
- REGULATORY ARBITRAGE
- EV Cars
- Regulations & Tax Incentives
- HURRICANE “BOOST” PANACEA
- Buying Opportunity
DEFENSE:
The Investment Thesis for Defense is:
INVESTMENT THESIS
- GEO-POLICAL TENSIONS
- Highest & Most Global Since Cold War
- ISIS, North Korea, Iran
- SOCIAL UNREST - POPULISM
- Changing of the Guard,
- Catalonia Tip of the Iceberg
2017 DEVELOPMENTS
- SMART BOMBS> STEALTH > DRONES
- Something Dramatic Coming,
- CYBERWAR
- Electromagentic Pulse (EMP) Technology
- New Disruptive Technologies
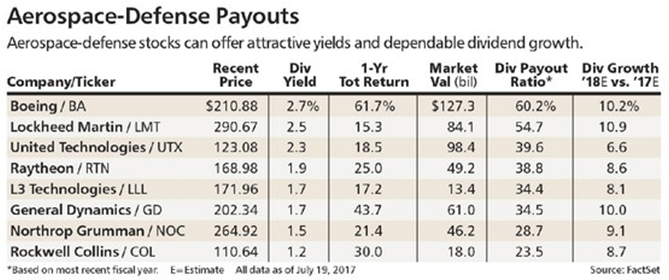
Northrop Grumman & Lockheed Martin
Something Is Going On Here!!!!

Dividend Yields & Buyback Game
INFRASTRUCTURE:
The Investment Thesis for Infrastructure as initially:
INVESTMENT THESIS
- BI-PARTISAN SUPPORT
- Both Party Election Platforms,
- CRUMBLING INFRASTRUCUTRE
- Past 50 Year Useful Life
- Maintenance Costs Prohibitive,
- Competitive Disadvantage
2017 DEVELOPMENTS
- BUDGET
- Hurricanes May Have Burnt Budget
- PPP V GOV’T OWNERSHIP
- Fees v Taxes
FANG & NOSH:
INVESTMENT THESIS
The Investment Thesis for Infrastructure as initially:
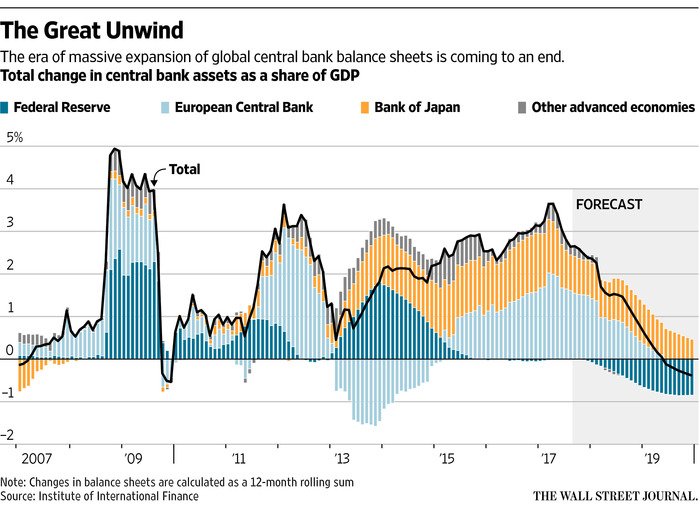
- QE & ZIRP
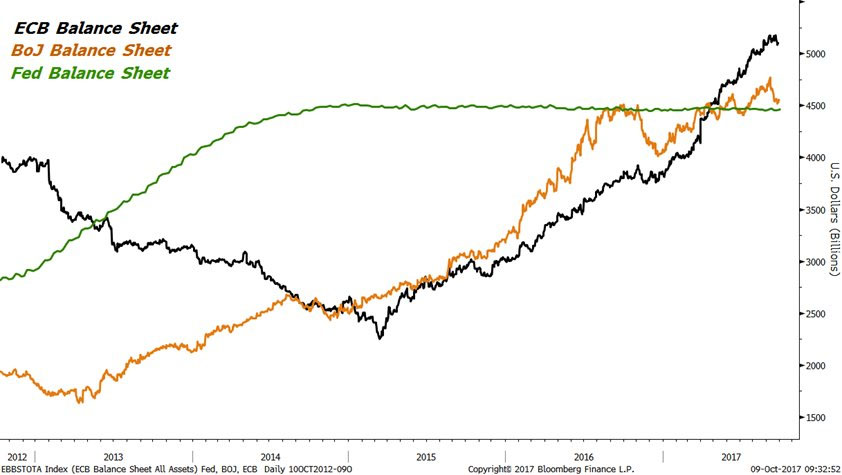
- $8.3T G3 Balance Sheet Expansion in 8 Years
- ETF
- Liquidity
- Fiduciary
2017 DEVELOPMENTS
- QT versus NATIONALIZATION
- Announced Quantitative Tightening Directives,
- Bond Market Betting Against Implementation
- REAL GDP PER CAPITAL
- Japan Appears to Have A Different Strategy.
G3 Correlation

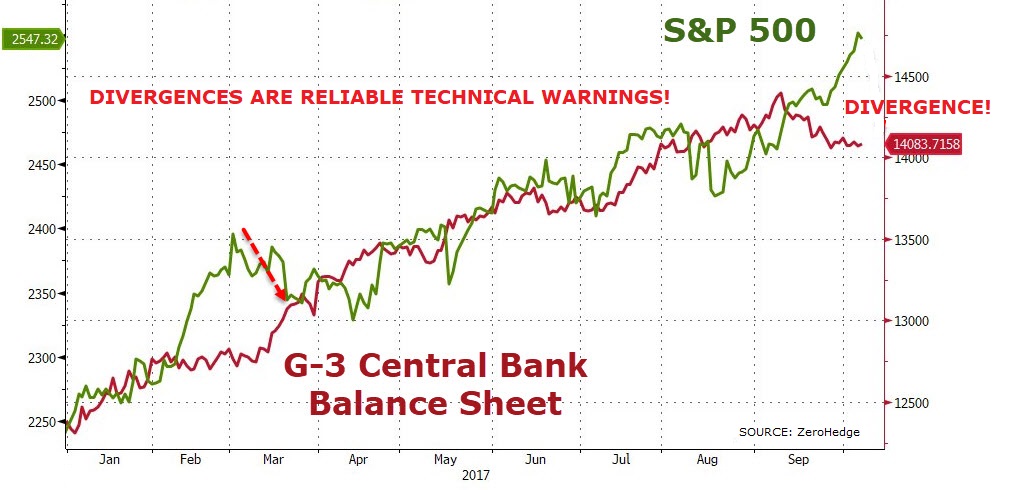
BOJ NOW DOWN, ECB NOW FLAT, US FLAT.