AMERICA IS INSOLVENT & THERE IS ONLY ONE PATH OUT: MONETIZATION, COLLAPSING STANDARDS OF LIVING & MASSIVE INFLATION
A PUBLIC SOURCED ARTICLE FOR MATASII (SUBSCRIBERS-RESEARCH & PUBLIC ACCESS ) READERS REFERENCE
MACRO: US - FISCAL
SOURCE: 02-22-19 - Chris Hamilton via Econimica blog - Census Bureau, Treasury, EIA Detail American Insolvency - "Demographics, Debt, & Debasement: A Picture Of American Insolvency"
MATASII SYNTHESIS:
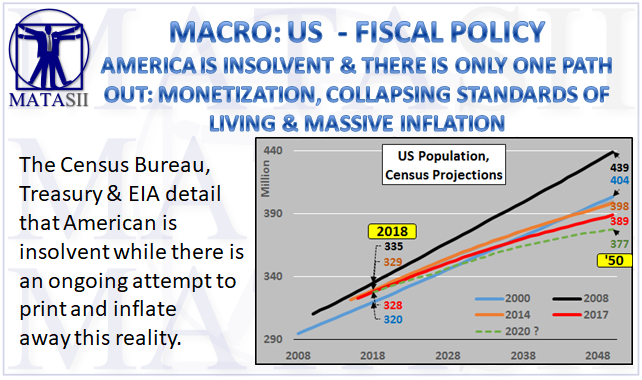
- American is insolvent and there is an ongoing attempt to print and inflate away this reality,
- America has shown it isn't afraid of (mis)using this digital printing press via collusion among the Federal Reserve, Treasury, and the Federal Government to disguise the simple truth that America is bankrupt and incapable of meeting its present and future obligations absent unlimited and unending monetization.
- The US Treasury is telling you that between the federal debt and unfunded liabilities, the US is $75 trillion in the hole and despite rising tax receipts, record stock and real estate valuations...the US is bankrupt.
- Of course, the US can never "technically" go bankrupt as it will issue new debt at an accelerating rate to pay the old debt...but this has been the "end times" for every empire.
- Debasement (or Modern Monetary Theory, as it is currently being re-branded) is the functional equivalent of national bankruptcy, the only means to pay the bills is creation of new debt at an accelerating rate.
KEY CHARTS

KEY QUOTES
- Since 2007, US births and net immigration have consistently and unexpectedly fallen sharply.
- Over the same span, US federal debt and unfunded liabilities have soared while federal tax receipts, as a percentage of the federal debt and unfunded liabilities, continue declining.
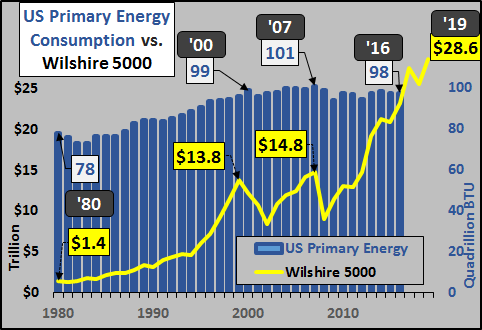
- Total US energy consumption also peaked in '07 and continues declining in contradiction to those soaring asset valuations.
DEMOGRAPHICS
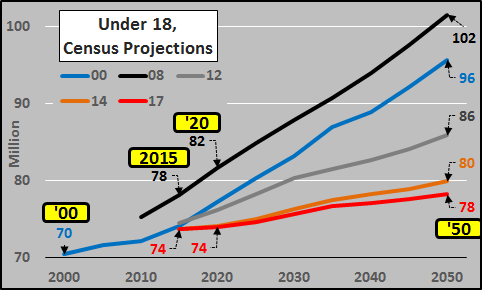
- The Census expects a near halving of population growth...or 50 million fewer Americans than it expected just 8 years earlier. But critically, nearly all the projected declines are among the under 45 year old population while the 65+ year old population growth is still on track to swell.
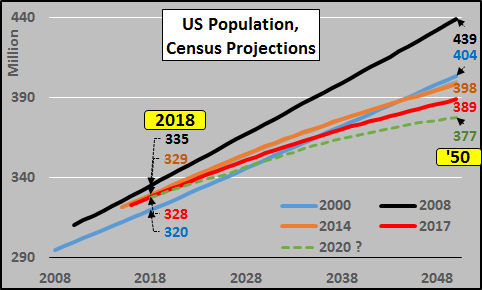
- In '00, the Census projected the total US population in 2050 would be 404 million persons. However, by '08, the projection swelled to 439 million, an astounding increase of 35 million?!?
- After the '08/'09 financial crisis and the subsequent 2010 Census, the projections were radically reduced.
- By 2014, the projection was reduced a further 6 million and as of the most recent 2017 projection, the population by 2050 was reduced by a further 9 million...to 389 million or 50 million fewer than just 9 years ago?!?
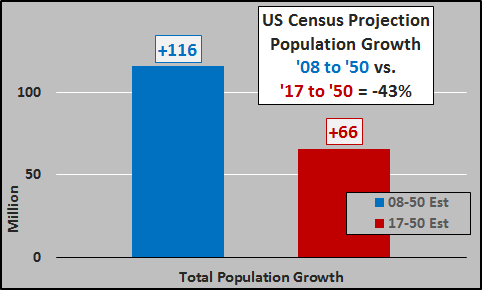
- The '08 projection versus the '17 projection shows the census reduction is a 43% decline in the anticipated US population growth over the next 30 years...that will undoubtedly only be further reduced.
- Growth among the 0-17 year old population has been slashed by 84%, the 15 to 44 year old child bearing population reduced by 60%, the post child bearing 45-64 year old population over a 20% reduction, but the 65+ year old elderly have only been reduced by 7%.
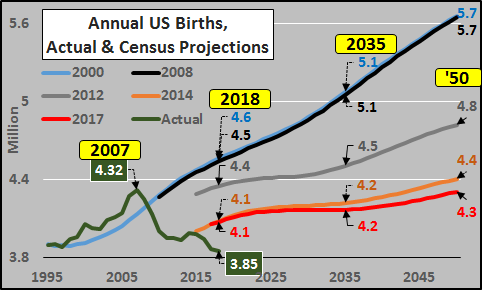
- Births are now lower by nearly a half million since '07 high water mark (-11%) but 700 thousand fewer annually than was projected in '00 and '08. This trend of flat to lower births shows no signs of turning around. The actual annual birth deficit compared to the projections only continues growing.
Census Bureau, Treasury, EIA Detail American Insolvency
Since 2007, US births and net immigration have consistently and unexpectedly fallen sharply. Over the same span, US federal debt and unfunded liabilities have soared while federal tax receipts, as a percentage of the federal debt and unfunded liabilities, continue declining. Total US energy consumption also peaked in '07 and continues declining in contradiction to those soaring asset valuations.
Simply put, this article details an American insolvency and the ongoing attempt to print and inflate away this reality. America has shown it isn't afraid of (mis)using this digital printing press via collusion among the Federal Reserve, Treasury, and the Federal Government to disguise the simple truth that America is bankrupt and incapable of meeting its present and future obligations absent unlimited and unending monetization.
Demographic Development and Population Growth
According to the latest 2017 Census projection, the Census expects a near halving of population growth...or 50 million fewer Americans than it expected just 8 years earlier. But critically, nearly all the projected declines are among the under 45 year old population while the 65+ year old population growth is still on track to swell.
Given the record low birth rates in 2017 and 2018, which came in 700 thousand annually below the '08 Census projections, plus diminishing immigration, netting at least a half million annually below '08 Census projections, the 2020 Census is likely to significantly further downgrade the potential for US population growth. The impact for US economic growth, unfunded liabilities, and outgrowing personal, corporate, and federal debt is devastating.
What Happened?
From the mid 1990's to 2007, a surge in immigration (both legal and illegal) and a rise in births resulted in significantly larger child bearing population and broad assumptions that America could outgrow its unfunded liabilities and debt issues. It was assumed, given the predominately Latin American and Catholic source of the population growth, that immigration and births would continue to surge and the American population (and demand with it) could extend the American success story indefinitely. But then in '08, everything went off the tracks and has only continued to derail since, quashing hopes for avoiding an American crisis.
The Census details this story in their ongoing population projections. The chart below shows the Census '00, '08, '14, and '17 US population projections. In '00, the Census projected the total US population in 2050 would be 404 million persons. However, by '08, the projection swelled to 439 million, an astounding increase of 35 million?!? However, after the '08/'09 financial crisis and the subsequent 2010 Census, the projections were radically reduced. By 2014, the projection was reduced a further 6 million and as of the most recent 2017 projection, the population by 2050 was reduced by a further 9 million...to 389 million or 50 million fewer than just 9 years ago?!? And the green line in the chart is my best guestimate for the next Census projection...such has been the decline in births and immigration. That is a projected reduction of at least 50 million and more likely in excess of 60 million in just over a decade.
The chart below is the '08 projection versus the '17 projection. This reduction is a 43% decline in the anticipated US population growth over the next 30 years...that will undoubtedly only be further reduced.
But which age segments were reduced should send shivers down Americans spines when considering economic growth, unfunded liabilities, and debt service/repayment. Growth among the 0-17 year old population has been slashed by 84%, the 15 to 44 year old child bearing population reduced by 60%, the post child bearing 45-64 year old population over a 20% reduction, but the 65+ year old elderly have only been reduced by 7%.
To begin, let's look at the engine to population growth, the 18 to 44 year old child bearing cadre, through five separate projections from '00 through '17. In the 2000 projection, the child bearing population was expected to fall through 2015 following long term negative birth rates and the baby bust following the baby boom. But by the 2008 projection, a massive infusion of immigrants and slightly higher births than were previously expected, resulted in a child bearing population 6 million in excess from the '00 projection...and by 2015, the child bearing population was 10 million greater than projected.
Perhaps it was reasonable for the Census to make two assumptions, that both turned out to be terribly wrong;
1- Immigration rates would continue at the early '00's pace
2- Total births would continue to rise and fertility rates would remain in positive territory
Looking at the annual births (chart below), it's very clear 2007 was an aberration with consistently declining births since. Births are now lower by nearly a half million since '07 high water mark (-11%) but 700 thousand fewer annually than was projected in '00 and '08. This trend of flat to lower births shows no signs of turning around. The actual annual birth deficit compared to the projections only continues growing.
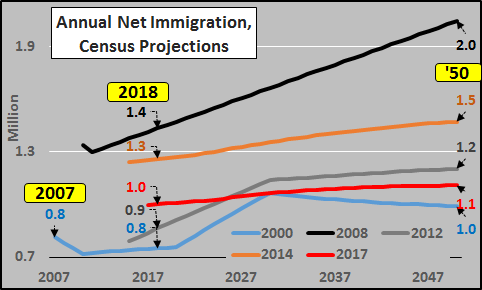
But it is also immigration that is well below projections, chart below. It is easy enough to determine the quantity of legal immigrants but given the roughly 15 million illegals in the US, determining the net flow of illegals is more guesswork than simple accounting. This is why the '10 Census was so critical in that it showed the net flow of illegals had turned negative following the '08/'09 financial crisis...and the net flow is likely to have continued this trend since.
The impact of all this on the headwaters (under 18yr/olds) of US population growth through 2050 is paramount. And this is before the next projection even further reduces what little growth remains (or perhaps projects outright declines).
Energy Consumption
Changes in energy consumption have long been considered a good proxy for real economic activity. From a total energy consumption standpoint, as of year end 2016, the US was using less energy than all the way back in 2000, according to the EIA (US Energy Information Administration).
And comparing the US primary energy consumption versus the Wilshire 5000 (representing the value of all publicly traded US equity), a funny thing shows up. Flat to declining energy consumption vs. surging asset valuations...this is typically understood as a red flag for phony wealth creation via market manipulation, monetization, and banana republic central banking.
Federal Debt & Unfunded Liabilities
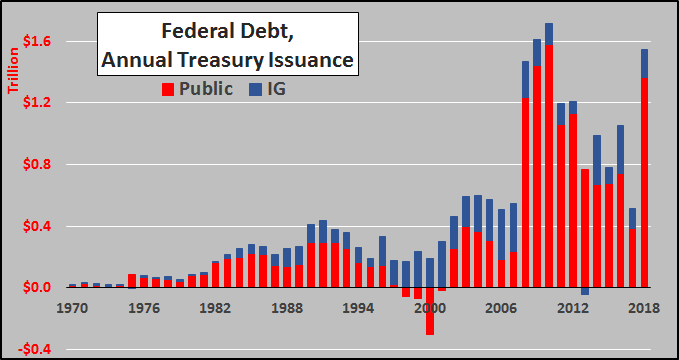
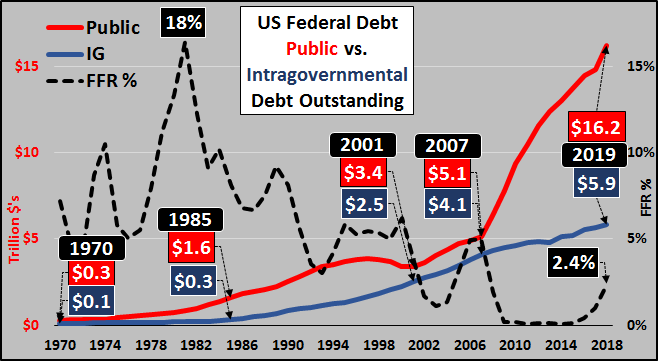
From a federal debt perspective, the surging annual issuance of Treasury debt since 2008 is in contradiction to the decelerating potential for population growth, demand growth, and potential tax revenues to repay or even service the debt.
Looking at federal debt since 1970 split between public and Intra-governmental holdings (trust fund surpluses)...and the accelerating issuance far outstripping the ability of Social Security and other trust fund "surpluses" to purchase the debt.
Treasury Demand?
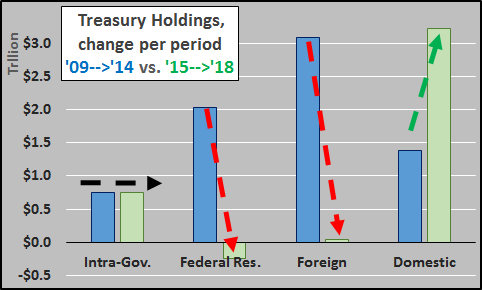
But since QE ended in late 2014, the Federal Reserve has been a net seller and Foreigners have ceased adding to their holdings, leaving all that new and rollover low yielding Treasury debt to be purchased and held domestically.
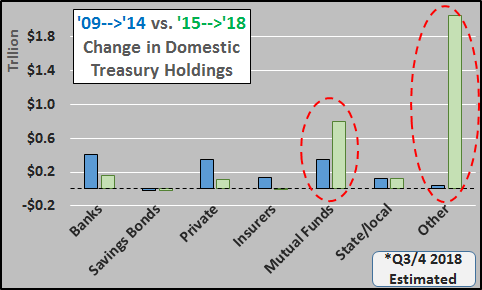
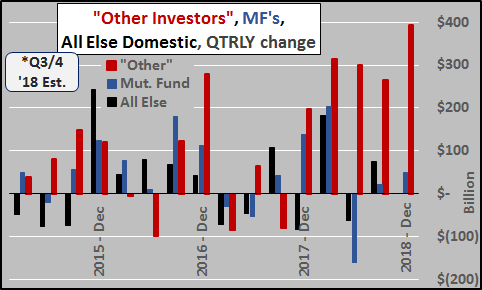
And who bought it all? According to the most recent Treasury Bulletin, since QE ended, the vast majority of buying has been among a buyer solely identified as "other investors"?!?
Since the end of QE, the quarterly changes in domestic Treasury holdings are detailed below. Surging domestic demand that is not from banks, not savings bonds, not private purchasing, not insurers, slowing among mutual funds, minimal among state/local pensions...leaving an unidentifiable "other investors" to buy and hold trillions in low yielding US Treasury debt?!?
Unfunded Liabilities
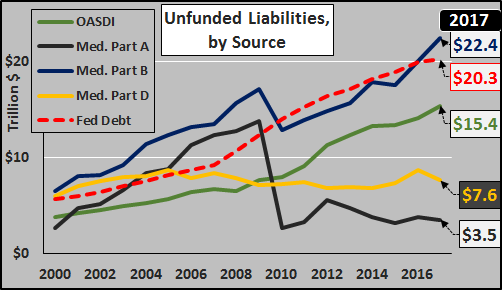
However, according to the Treasury's 2017 Financial Report of the US Government, the "total present value of future expenditures in excess of future revenues" is $49 trillion in addition to the federal debt!!! The chart below details the sources of the unfunded liabilities and federal debt from '00 through '17 (the large dips in Medicare Part A & B from '09 to '10 were apparently to do with Obama-Care and how the Treasury calculated shifting a portion of the burden from the Feds to the States or individuals).
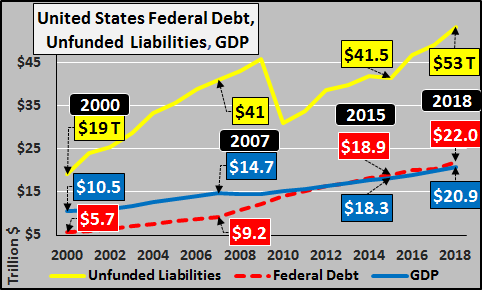
And the chart below shows known federal debt, GDP, and best guestimate for unfunded liabilities through 2018. Even according to the Treasury #'s, this is getting pretty out of hand.
Social Security and Medicare require $49+ trillion, here and now, to allow that money to grow (a compounded annual rate double or triple that currently offered by the 10yr Treasury is needed) in conjunction with (over)estimated future tax revenues and diminishing working age population growth to meet the present and future payouts that have been promised to an elderly population that isn't shrinking. However, the Census is making it clear the population growth is in all the wrong places and nowhere near enough in the right places to meet any of these goals. The EIA making it plain real US economic activity has been slowing for a decade...and further deceleration is the most likely course.
Finally, if we review federal tax receipts plus federal tax receipts as a percentage of outstanding liabilities, the picture is bleak (below). Since '00, federal liabilities have risen twice as fast as federal tax receipts despite a decade of ZIRP, Quantitative Easing, three asset bubbles, innumerable economic crutches, and stimuli.
Conclusion:
The US Treasury is telling you that between the federal debt and unfunded liabilities, the US is $75 trillion in the hole and despite rising tax receipts, record stock and real estate valuations...the US is bankrupt. Of course, the US can never "technically" go bankrupt as it will issue new debt at an accelerating rate to pay the old debt...but this has been the "end times" for every empire. Debasement (or Modern Monetary Theory, as it is currently being rebranded) is the functional equivalent of national bankruptcy, the only means to pay the bills is creation of new debt at an accelerating rate. The US situation and reaction is not unlike most of the developed and developing nations of the world, as I detailed recently HERE.
Still, ideally, a mature and sophisticated nation would stop and reconsider its priorities about now, determine how to go about a functional bankruptcy, share the pain, and start over. Unfortunately, we appear more interested in scapegoating, trade wars, walls, and countering with calls for socialism. This may not go well.