Gordon T Long
Global Macro Research | Macro-Technical Analysis
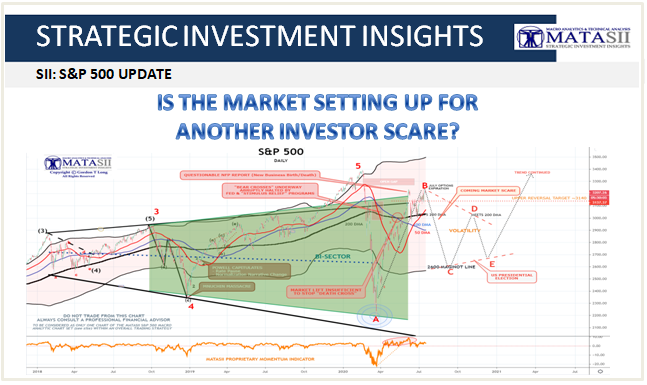
STRATEGIC INVESTMENT INSIGHTS
S&P 500
- THE FED BALANCE SHEET IS SHRINKING
- For the fourth week in a row the Fed has REDUCED its balance sheet. The is a negative rate and as we argued in previous videos it will taking an increasing rate of growth of the Fed’s Balance Sheet to sustain the current market upward trend. (See Below)
- VALUATIONS ARE COMPLETELY DISCONNECTED FROM ECONOMIC REALITY
- Market Fundamentals and Valuations are now at historic levels in almost measurement metrics. The Fed is on the verge of losing control of what has been clearly a “managed” market recover to excessive and destructive speculation. (See Below)
- TECHNICALS STEADILY BREAKING DOWN WHILE SIGNALING KEY TURN DATES OF AUGUST 18 &19th
- There is both a Phi mate turn date and a Major Bradley model turn date scheduled for August 18th and 19th, 2020.
- The Phi Mate turn dates agreed with the Bradley model on two major occasions, the December 24th, 2018 Low, and the March 23rd, 2020 Low.Both Lows led to dramatic rallies. The fact that we are getting a Phi mate turn date and a Major Bradley Model turn date scheduled within one day of each other, August 18th, and August 19th, 2020, is an important warning and increases the probability of a strong trend turn.
- PHI MATE TURN DATES are a cycle trend turn date where often the relationship of significant tops and bottoms occur a Fibonacci .618 or .382 number of trading days from each other and from the all-time inflation adjusted high for the stock market back in January 2000. This allows us to calculate future trend turn dates based upon the dates of past tops or bottoms of significance.
- THE BRADLEY MODEL is a Cycle trend turn indicator based upon astronomical alignments. If we look at the four largest trend turns over the past two and a half years, we see that the Bradley Model was predicting a turn within two weeks of the major turns February 1st, 2018, December 24th, 2019, January 17th, 2020, and March 23rd, 2020. There are major and there are minor Bradley model turn dates. There have been only two Bradley model turns so far in 2020, and both were Major turn dates that ended up being correct. The first pointed to the 2020 crash through March 23rd, the second pointed to the retracement from March 23rd through now.
* Note: Turn Dates can be either positive or negative. We presently see the upcoming turn dates to again be positive. See Red “C” in charts below.
- S&P 500 VALUATION METRICS
-
- TRAILING GAAP PE: Current 25.8, Average 19.3, 34.0% above Average,
- FORWARD CONSENSUS PE: Current 20.9, Average 15.4, 35.7% above Average,
- MEDIAN FORWARD PE: Current 19.1, Average 15.2, 25.7% above Average,
- SHILLER PE: Current 30.0, Average 17.0, 75.8% above Average,
- PRICE/BOOK VALUE: Current 3.45, Average 2.54, 36.0% above Average,
- EV/EBITDA: Current 12.8, Average 10.2, 26.3% above Average,
- TRAILING PEG: Current 1.81, Average 1.45, 24.9% above Average,
- FORWARD PEG: Current 2.07, Average 1.23, 67.8% above Average,
- PRICE/OCF: Current 14.3, Average 10.8, 32.4% above Average,
- EV/SALES: Current 2.50, Average 1.89, 32.6% above Average,
- TRAILING PE: Current 18.3, Average 16.2, 12.6% above Average,
- MARKET FUNDAMENTALS (JAN-2020 to JULY 2020)
-
- NASDAQ PRICE: 9178.86 to 10,559.54 = 15.04% Increase,
- GDP Y-o-Y GROWTH RATE: 3.97% to -7% (est) = -10.97% Decrease,
- UNEMPLOYMENT RATE: 3.60% to 11.10% = 7.50% Increase
- CONTINUING CLAIMS (Mil): 1.76 to 18.06 = 16.30 Million Increase,
- DEBT TO GDP RATIO: 106.75% to 123% (est) = 16.25% Increase,
- FED FUNDS RATE: 1.54% to 0.00% =-1.54 Decrease,
- 10 YEAR UST RATE: 1.87% to 0.67% = -1.20 Decrease,
- 2020 EARNINGS EST.: 160.92 to 91.79 = 42.96% Decrease,
- 2021 EARNINGS EST.: 171.23 to 145.66 = -14.93% Decrease,
FAIR USE NOTICE This site contains copyrighted material the use of which has not always been specifically authorized by the copyright owner. We are making such material available in our efforts to advance understanding of environmental, political, human rights, economic, democracy, scientific, and social justice issues, etc. We believe this constitutes a ‘fair use’ of any such copyrighted material as provided for in section 107 of the US Copyright Law. In accordance with Title 17 U.S.C. Section 107, the material on this site is distributed without profit to those who have expressed a prior interest in receiving the included information for research and educational purposes. If you wish to use copyrighted material from this site for purposes of your own that go beyond ‘fair use’, you must obtain permission from the copyright owner.
NOTICE Information on these pages contains forward-looking statements that involve risks and uncertainties. Markets and instruments profiled on this page are for informational purposes only and should not in any way come across as a recommendation to buy or sell in these assets. You should do your own thorough research before making any investment decisions. MATASII.com does not in any way guarantee that this information is free from mistakes, errors, or material misstatements. It also does not guarantee that this information is of a timely nature. Investing in Open Markets involves a great deal of risk, including the loss of all or a portion of your investment, as well as emotional distress. All risks, losses and costs associated with investing, including total loss of principal, are your responsibility.