WHO IS ACTUALLY BUYING THE MASSIVELY SURGING US DEBT?
Since March 2020 the US National Debt has exploded higher by historically unprecedented amounts. In only 15 months it has surged by $4.7 trillion to $28.14 trillion. This takes it to 128% of GDP in present dollars.
Who is buying this massive amount of debt? Surprisingly, It isn’t who everyone believes it is! Maybe even more importantly is why and how they are doing it?
|
SURPRISING BUYER
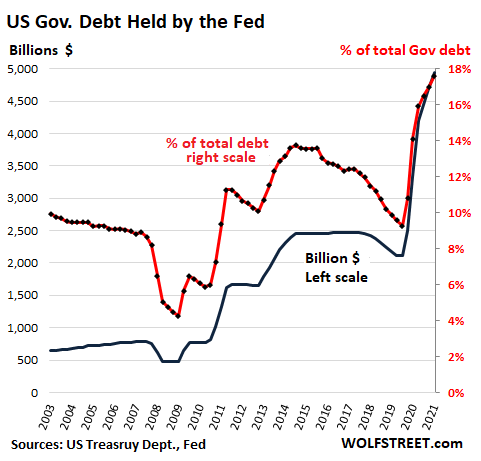
The chart to the right begins to answer some of the questions.
Basically since 2016 the historical purchasers of US debt have been flat relative to the size of the growing debt .
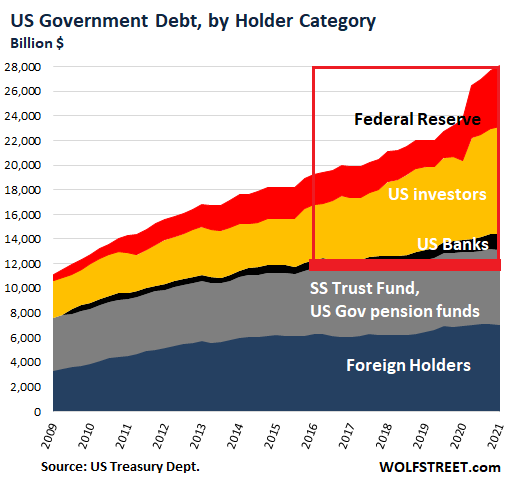 The red box highlights the three emerging buyers who have not only bought more US debt, but at a faster rate and thereby increased their holdings to a larger percentage. The red box highlights the three emerging buyers who have not only bought more US debt, but at a faster rate and thereby increased their holdings to a larger percentage.
-
- 31.2%: US Investors,
- 17.6%: Federal Reserve,
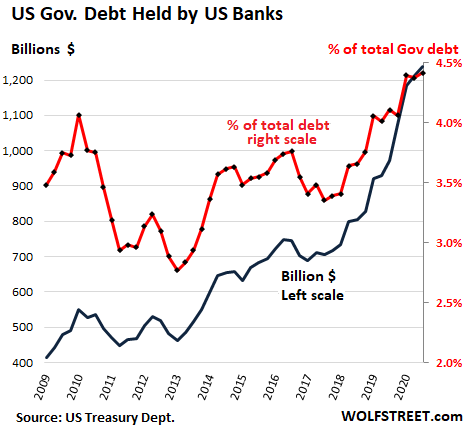
- 4.4%: US Banks
When I ask anyone for the answer, I normally hear it the Federal Reserve first, Foreigners second and US Banks third.
So why US Investors? What is this about? To understand that we need to revisit some of the points we made in our last newsletter and this month’s LONGWave video.
|
|
|
2016-2018 – INFLATION SWAPS
in this month’s LONGWave video we discussed Credit and the dramatic changes in Credit Default Swaps. Additionally, in the most recent newsletter we expanded on that and noted:
What is particularly suspicious is normally when US Yields rise, the US Dollar strengthens. This is not what happens when the difference between Breakeven and Inflation Swaps differ. This rings of calculated manipulation through OTC bank trading. Though they are exactly the same at the moment (for the first time in years) this is likely to once again differ. When it does, we will likely see marked moves in US Treasury Yields and the US Dollar.
We highlighted the time frame between 2016-2018 (with the two charts below). Note this is precisely when the marked shift from Foreigners to US Investors occurred.
|
|
| |
|
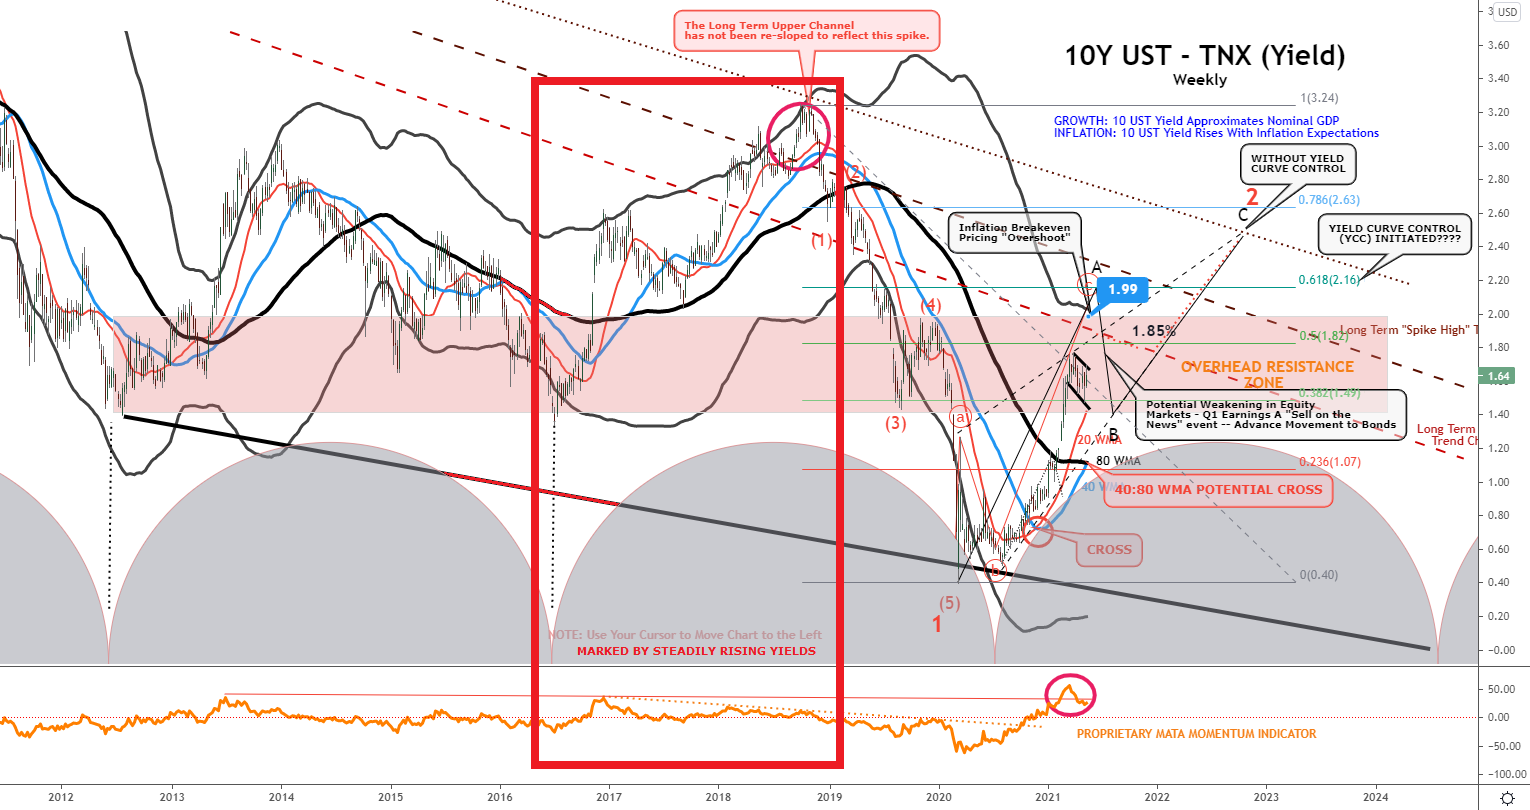
BOND MARKET – 10Y UST YIELD
MARKED BY: Noticeable & Steadily Rising Yields
|
|
|
|
|
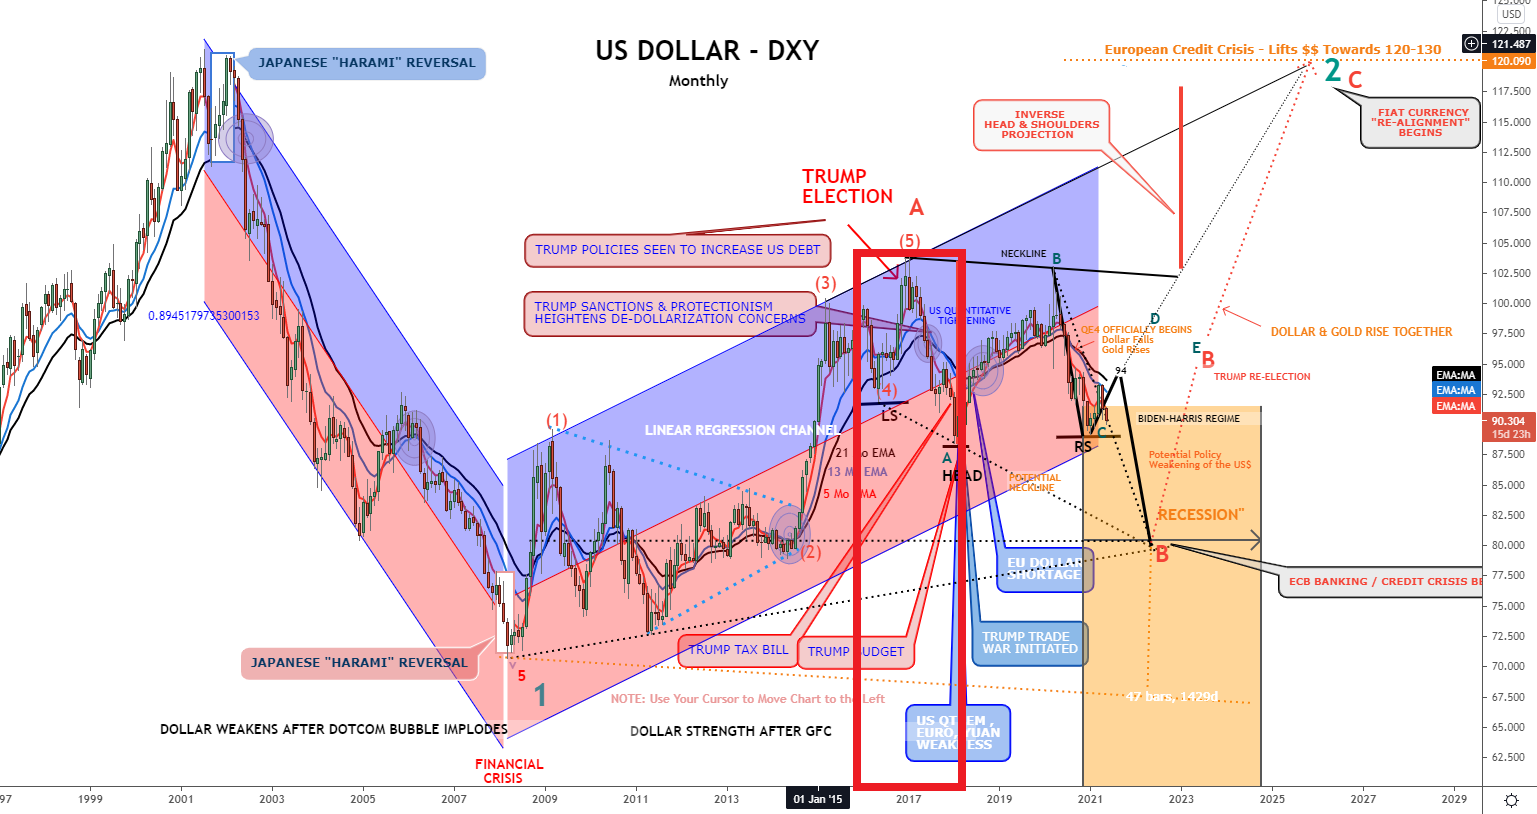
US DOLLAR – DXY
MARKED BY: A Reversing Downward US Dollar
|
|
|
|
|
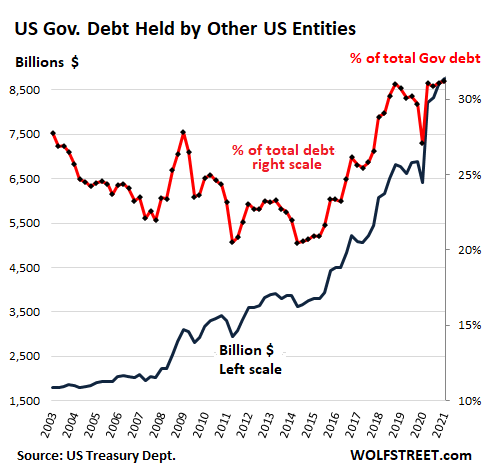
EXPLODES IN 2016
“Other US Entities” or what I referred to above as ‘US Investors’ raised their share of the total debt to 31.2% (red line, right scale on chart to the right), making these US individuals and institutions combined, the largest holder of that monstrous mountain of debt.
 These include: These include:
- Bond Funds,
- Private-Sector,
- State, and Municipal Pension Funds,
- Insurers,
- US corporations,
- Hedge funds (they use Treasuries in complex leveraged trades). i) Risk-Parity, ii) 60/40 Balanced Funds which have been the most “positively correlated” since 1999 all thanks to last year’s pandemic response-driven macro regime shift (“from Duration to Reflation”) where bonds have traditionally played the role as the perceived “low vol” / “risk-off” hedge.
- Private Equity Firms that need to park billions in “dry powder,” etc.
Their holdings surged by $149 billion in Q4 and by $2.35 trillion since March 2020, to a record $8.76 trillion (above blue line, left scale).
|
|
|
WHY
Our analysis suggests ‘Other US Entities’ are accumulating US debt aggressively due to a number of reasons despite yields being at historic levels:
-
- Major concerns with valuations, future returns and fragility of US Equity markets,
- They see a “Flight to Safety” capital gains play or minimally a portfolio insurance hedge,
- US Regulatory changes and Tax incentives,
- Unlike Foreign investors they are not necessarily impacted from an eroding US$ (which many see coming) because their profits are in US dollars and are predominately US center enterprises,
- Many perceive they are protected from inflation through Inflation Swaps (breakeven element of rising treasury yields).
MOUNTING US DOLLAR CONCERNS
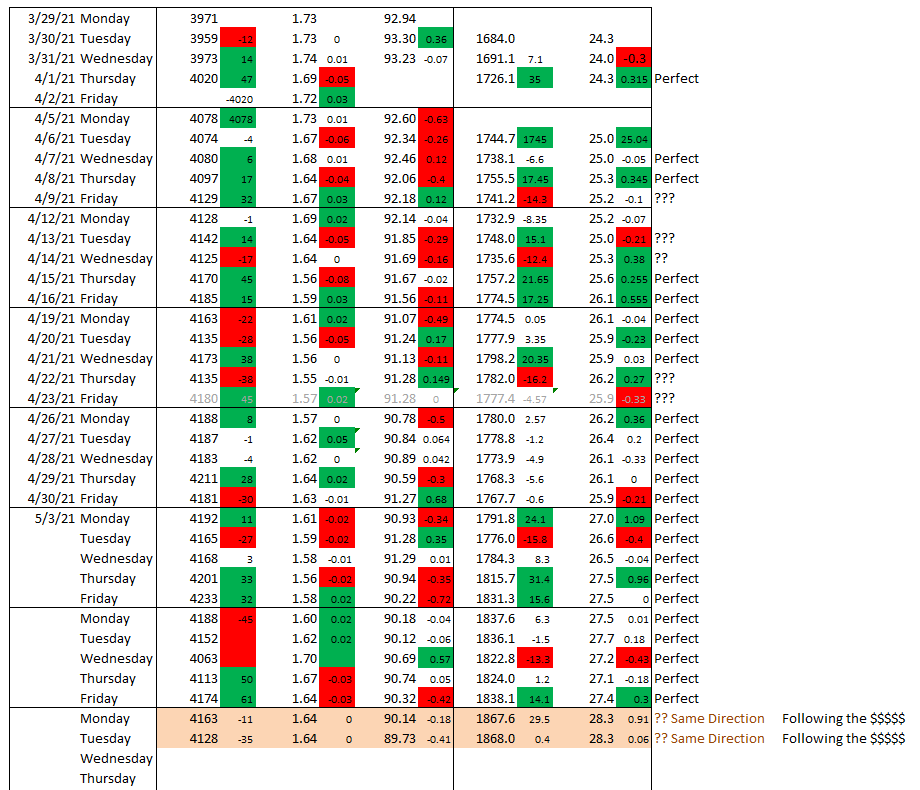
We suspect that the recent shift in our Market Correlation Grid has a lot to do with who predominately now holds US equities and who predominately holds US Treasuries. Below is our Market Correlation Grid:
CORRELATIONS & BOUNDARY RULES:
Until very recently we have witnessed a very consistent correlation of:
-
- Equity Market Rises if the 10Y UST Yields fall 2% or more OR the US Dollar falls by $0.15 or more.
- If the US Equity Market rises by more than 5 points, then Gold will rise by $10 and Silver by $0.20.
As the last couple of days show, the pattern is changing!
|
|
|
CONCLUSIONS
We believe we are seeing the early stages of a shift from a Rising Yield concern to a Falling Dollar Concern.
-
- Bond Buyers: Primarily US Institutions who see getting higher yields while new and existing holdings will be protected with Inflation Swaps & Credit Default Swaps.Effectively a way of shorting yield while additionally hedging existing bond holdings all the while capturing rising yields.
- Stock Buyers: Primarily Foreigners will increasingly perceive lower US forward equity returns with a falling dollar exposure as excessive risk and reduce holdings.
|
|
|
“Policy projections suggesting that rates may not be raised for . . . close to three years are creating a dangerous complacency. The Fed could be forced into a knee-jerk tightening of monetary policy that would spook markets and even hurt the real economy. When, as I think is quite likely, there is a strong need to adjust policy, those adjustments will come as a surprise. That “jolt” would do “real damage to financial stability, and may do real damage to the economy”
Lawrence Summers, Former US Treasury Secretary – FT,
|
|