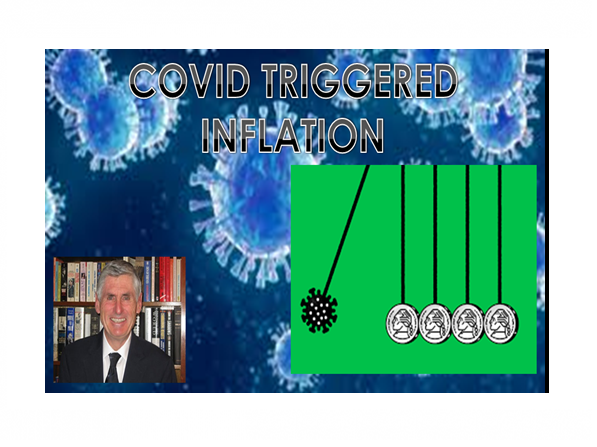
IN-DEPTH: TRANSCRIPTION - LONGWave - APRIL - Covid-19 Triggered Inflation
SLIDE DECK
TRANSCRIPTION
COVER
Thank you for joining me. I'm Gord Long.
A REMINDER BEFORE WE BEGIN: DO NO NOT TRADE FROM ANY OF THESE SLIDES - they are COMMENTARY for educational and discussions purposes ONLY.
Always consult a professional financial advisor before making any investment decisions.
AGENDA
In this session I would like to follow on from last month’s LONGWave discussion on Yield Curve Control and Negative Interest Rates with more of a focus on current Inflation expectations.
Specifically, I would like to focus on what the current surge in Inflation expectations is:
- Predicated on,
- Can and will he be sustained and
- The chances of it being transitory as the Federal Reserve currently advocates.
The simple fact that the Fed beliefs this should give everyone concern as they haven’t been right about almost anything as long as I can remember. However, to give them their due we need to remember they have a completely different set of guiding goals than what they publicly advocate – but I digress.
SLIDE 5
We have seen an abrupt shift in inflation expectations since the US Presidential elections in November 2020. The question we first need to answer is what is this actually based on?
SLIDE 6
Some argue that it is driven by:
- An explosion in the money supply due to Covid stimulus along with acceleration in government Fiscal spending associated with multi-Trillion dollar new Democratic policies such as the $2T+ Infrastructure Bill.
Others see it as a result of:
- Serious and growing chaos in the Global Supply Chain brought about by the resumption of business in a post Covid world resulting in a demand spike and the associated shortages creating pricing pressures.
It can also be reasoned that:
- In the Covid-19 recession and recovery, policy makers have not only added massive fiscal stimulus (as just mentioned), but also direct wealth transfer (aka helicopter money) to the equation with full Modern Monetary Theory (MMT). This will create a markedly different social and economic dynamic which will set the stage for a substantial new inflationary cycle.
SLIDE 7
All these points are valid and are no doubt contributing. But are they noise and not the signal?
In last fall’s October UnderTheLens video we argued that we have Inflation PLUS Deflation which appears as waves as our focus shifts in alignment with the news flows.
That shift in focus comes as a result of one or the other appearing to be increasing more than it was or one of them is shifting to a newly impacted economic area.
We must not forget that both are relentlessly increasing, with each wave getting larger and therefore economic conditions becoming more fragile and precarious.
The fact that Inflation is getting worse should not be any surprise. It should also not be any shock that the fallout from Covid will accelerate deflationary pressures markedly.
SLIDE 8
I see 2021 to be about just such a shift in focus.
We will see a shift from an initial focus on an inflation surge to the hard realities of the strong headwinds of Deflation.
Inflation will be met with recessionary deflationary pressures. This is the prescription for Stagflation.
SLIDE 9
Returning to the noise of what is driving this surge in inflation expectations is to consider what is real and what will actually be a seriously protracted driver.
SLIDE 10
I have long argued that to understand inflation as it impacts economic conditions longer term is to understand the Velocity of Money. Inflation rises when money inflation increases for all the reasons which cause this to happen. That is not happening and has not happened for a long time as this chart illustrates.
It is hard to see this changing since increasing money supply is only further increasing the denominator (as shown in the bottom right of this slide) while an increase in money supply is not presently going into productive assets which is what it would take to increase the numerator.
My colleague Richard Duncan is a former financial specialist with the World Bank and consultant to the IMF in Thailand during the Asia Crisis. He understands this topic better than anyone. He recently published a 70 plus slide video presentation specifically spelling out that surging money supply growth simply won’t cause inflation based on the realities of the new world we live in.
I encourage you to check out his work at RichardDuncanEconomics.com!
SLIDE 11
As far as the Supply Chain Shock is concerned it is transitory!
The concerns are about short term issues which we should expect after a complete shutdown with everyone trying to turn the lights back on at the same time! Few electric utilities are ever prepared for or have planned for such a surge!
1- SHORTAGES: JIT, KanBan, Pull System – No Inventory Supply Chain
2- TRANSPORTATION: Start-up Surge means bottlenecks
3- LABOR PREMIUMS: Covid Costs
4- EXPEDITE: Extra Costs
5- COVID: Recapture Lost Revenues for Fixed Costs
SLIDE 12
The evidence suggests that monetary expansion will actually not drive Inflation in the (as it currently is being perceived) but rather inflation later on through dollar depreciation and forced increases in taxation.
On the other hand the Supply Chain pressures will recede as competitive pricing pressures in a slowing world economy take over.
However, while shortages of semiconductors have been particularly disruptive to the auto industry where Ford Motor Co. for example announced last Wednesday due to chip shortages it was idling plants that make its best-selling F-150 pickup truck. This problem is much larger and more pervasive and will be with us for a couple of quarters.
SLIDE 13
According to Machinery Magazine: “We have widespread supply chain issues. Suppliers are struggling to manage demand and capacity in the face of chronic logistics and labor issues with No end short term in sight.”
“March saw manufacturers struggle to cope with surging inflows of new orders. Although output continued to rise at a solid pace, capacity is being severely strained by the combination of soaring demand and supply chain disruptions: supply chain delays and backlogs of uncompleted orders are growing at rates unprecedented in the well followed IHS Markit survey’s 14-year history, meaning inventories of finished goods are falling at a steep rate.
“Pricing power has risen accordingly as demand outstrips supply: raw material prices are increasing at the sharpest rate for a decade and factory gate selling prices have risen to a degree not seen since at least 2007.
“The fastest rates of increases for both new orders and prices was reported among producers of consumer goods, as the arrival of stimulus checks added fuel to a marked upswing in demand as the economy continued to pull out of the malaise caused by the pandemic.
“With business expectations becoming even more optimistic in March, further strong production growth looks likely in the second quarter, but the big question will be whether rising price pressures also become more entrenched.”
Chris Williamson, Chief Business Economist at IHS Markit :
SLIDE 14
The current recovery is completely different than the 2008 recovery and any other recovery for that matter. Never has the entire world’s economy been basically placed on lockdown then suddenly asked to start up again. Especially in a world that no longer holds inventory because of a globally adopted JIT framework.
It will take time. There will always be price increases which occur whenever shortage occurs but in this case it won’t last! As investors, that is all we need to know other than of course – for how long?
SLIDE 15
Let’s talk about that. But first we need to understand there are always unintended consequences of any major shocks or new government policy initiatives taken to counteract economic shocks.
SLIDE 16
Two of these factors will result in longer term non transitory Inflationary pressures. The impact of these two inflation drivers can’t be stressed strong enough.
- WE WILL SEE TAX INCREASES at all levels of Government (Income Taxes, Sales Taxes, Property Taxes, Fees, Licenses, Tolls etc
- WE WILL SEE A FALLING DOLLAR which will drive up the cost of foreign Goods which the US is now almost completely dependent on having off-shored its production capabilities and infrastructure.
A SLOWING US CONSUMER
- Will Trigger Global Demand Drop
- The US Consumer Has Long Been the Driver of Global Demand
SLIDE 17
The broad based and level of increase in coming taxes is likely to such an increase that few have ever experienced anything like it that have lived in developed economies. Those from emerging economies and banana republics are only too familiar with what is to come.
A House of Cards
Central banks are as trapped as inflation worries are creating significant pressure on mortgage rates to rise. To tampen down these forces, the Fed also had to increase its purchases of mortgage-backed securities (MBS). It has bought over $60 billion of MBS since February. If long-term interest rates continue to rise, the housing market could come under pressure. Remember, the bottom 50% own over 51% of their overall assets in real estate. It drives the “Wealth Effect”.
Tax Payers on the Hook
The chart here is perhaps one of the most important charts today. Tax rates have followed government debt almost perfectly throughout history. Fiscal excess leads to higher income taxes, like it or not. The divergence between the two lines below is unsustainable. The Fed will not be able to pay for this wall of debt alone. Individual and corporate tax rates will rise. But because new tax legislation is not official yet, most Wall Street analysts have not factored it into their earnings estimates, leaving them too optimistic.
SLIDE 18
You can only print money so long before the cost of financing it overwhelms government’s ability to fund its budget.
Looming Public Debt Crisis
In January and February alone, the US Treasury spent over $1.1 trillion, or the largest two-month amount since July. In comparison, it collected less than 60% of that amount in taxes.
Long story short, public debt continues to grow at an unprecedented pace. Meanwhile, the Congressional Budget Office (CBO) projects that the Federal budget net interest expense will soar by $800 billion per year over the next decade. To clarify, the CBO’s estimate does not factor in another economic downturn along the way.
We believe the estimate will fall short. The rising Treasury debt burden and deficits are necessarily forcing the Fed into the position of debt monetization which drives real interest rates lower and lower in negative territory and allows the Treasury to effectively collect an inflation tax. Systematic tamping down of the CPI plays a role given our government’s enormous off balance sheet Social Security and Medicare liabilities which are cost-of-living adjusted.
SLIDE 19
In good time, these new policies (like MMT) and perpetual stimmy checks will prove to be an epic failure. Here’s why…
A bountiful harvest can always be demanded from the land. So, too, a bountiful supply of money can be demanded from the central bank. But remember, in an economy, like a harvest, you reap what you sow. What we mean is all money is not created equal.
There’s real money that’s earned through productive enterprise. And there’s fake money that’s created from thin air by central bankers pressing buttons on a key pad. The fake money is indistinguishable from the real money. But it has the lasting effect of cheapening the real money’s value.
It’s real simple, folks. The quality of money stems from its quantity. The US dollar is headed lower in the Intermediate Term.
SLIDE 20
In last month’s LONGWave we discussed the Fisher Equation where:
Nominal interest rate = Expected inflation + Real interest rate
Let’s run through its components to see if we can get a better understanding of when this focus on inflation might subside and the shift to deflation may occur … and at what levels?
SLIDE 21
The 10Y US Treasury Inflation Breakeven has dramatically spiked since the Covid pandemic struck. It was headed down until that occurred in Q1 of last year.
SLIDE 22
The Long Term Breakevens give us a larger perspective and indicate overhead resistance at~2.5% and potentially even higher at 2.8%. This is not to say they can’t go higher but for our purposes that is what we should likely focus on for 2021.
SLIDE 23
The Real Rate has also been steadily rising in 2021 after bottoming at ~ -1% last summer.
SLIDE 24
The Long Term US 10 Year Treasury Real Rate shows major overhead resistance at 0.7% but in the current monetary environment of keeping yields down, even allowing a real rate of 0% in 2021 would be a major chin-up! Overhead policy resistance through YCC of -0.7 to -0.8% may be more likely.
SLIDE 25
Putting this together of
- Inflation Breakevens reaching 2.5%
- The Real Rate reaching -0.75
Would give us a 10Y US Note nominal rate of 1.75%, which is approximately where we are trading today.
SLIDE 26
The actual numbers as we write this are shown in the top right corner.
Our 10Y UST Note chart for Yield (TNX) appears to indicate we are nearing a level where rates need to consolidate in 2021 before heading in 2022.
So maybe the Inflation scare will soon begin to dissipate? The chart gives us that impression.
However, never underestimate a market’s ability to go further than you think but the chart suggests it is likely only to be a last spike before falling back.
SLIDE 27
So as investors how do we translate all this?
SLIDE 28
Presently we are witnessing the equity market continuing to rise having set a new record high last week.
Meanwhile we see that whenever the market moves higher yields fall and when it pulls back yields rise. With falling yields we see Gold rise. Through all this we have been seeing the US dollar rising.
The question is this going to keep happening and will these correlations hold up?
SLIDE 29
To answer this we may want to look at the Chinese Credit Impulse Correlation.
It has been particularly instructive since the 2008 financial crisis. The Chinese Credit Impulse leads the 30Y US Treasury Bond’s Real Rate by 12 months. This suggests between now and late Q3 there will be pressures for a rising Real Rate on the 30Y Bond.
SLIDE 30
The 10Y US Treasury Note has the same correlation.
Therefore we should expect with rates to rise for the equity markets to come under pressure! Significant pressures with yields being better in the bond market.
It also means pressures on precious metals prices at least through the end of Q3.
SLIDE 31
However markets never go straight up or down. Even in strong advances there are retracements.
That is what we see when we analyze the Real Rate chart in more detail.
We are likely to soon see yields correct in a potential “D” wave before heading higher towards maybe -0.3 or -0.25 % as a result of the Chinese Credit Impulse.
We said earlier that 0% would be a stretch but something in the area of -0.3% was likely.
The sequence we see is highlighted in black:
- We are currently in the range of 1.70% nominal rates.
- The inflation momentum is such that a final push towards 2.00% is not at all unlikely. This would be shock to the equity markets.
- We suspect that the Fed wants a near term correction in the equity markets to take some of the euphoric over pricing and reduce leverage. Weakness in the equity markets would see a move towards the Treasury market driving yields lover as in our Wave “D”.
- A post Japan YE will additionally see bond buying taking down yields and pushing bond prices up.
- As Yields correct downward this would buoy the equity market putting in a possible right shoulder as yields hit maybe a low of 1.30 to 1.45%
- The full impact of policy changes regarding Infrastructure spending, taxation and the yet to be addressed forbearance bailouts will push inflation further up towards the end of Q3 towards possibly 2.50%.
- This will force Fed actions with the implementation of YCC.
- YCC will lead us towards 0.25% nominal rates.
SLIDE 32
In summary our expectations are:
- Rates Will Consolidate In Q2
- Markets will Complete a Right Shoulder of Topping Process in Q2
- Precious Metals Will Rally in Q2 but Fall Further in Q3
- Markets Will Begin An Overdue Sell-Off in Late Q3
- The Fed Will Be Forced to Implement YCC in late Q3 or Q4
- US$ Will Begin to Fall In Q4 with YCC
- Precious Metals and Commodities will Rise Sharply in Q4
SLIDE 33
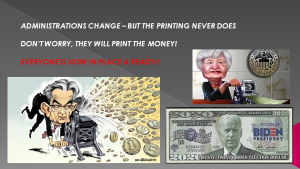
As I always remind you in these videos, remember politicians and Central Banks will print the money to solve any and all problems, until such time as no one will take the money or it is of no value.
That day is still in the future so take advantage of the opportunities as they currently exist.
Investing is always easier when you know with relative certainty how the powers to be will react. Your chances of success go up dramatically.
The powers to be are now effectively trapped by policies of fiat currencies, unsound money, political polarization and global policy paralysis.
SLIDE 34
I would like take a moment as a reminder
DO NO NOT TRADE FROM ANY OF THESE SLIDES - they are for educational and discussions purposes ONLY.
As negative as these comments often are, there has seldom been a better time for investing. However, it requires careful analysis and not following what have traditionally been the true and tried approaches.
Do your reading and make sure you have a knowledgeable and well informed financial advisor.
So until we talk again, may 2021 turn out to be an outstanding investment year for you and your family.
Thank you for listening

