LACY HUNT ON THE US TREASURY LONG BOND
Expectations and Disappointments
Coming out of 2017, expectations were widespread that a synchronized global expansion lay ahead for 2018. Forward momentum was thought to prevail in Europe, Japan and the emerging markets. A doubling of the growth rate in public and private debt in 2017 over the prior year’s rate seemingly pointed to better performance in China, and a sizable tax cut was expected to propel U.S. economic growth upward and contribute to improving global conditions.
However, business conditions outside the U.S. have significantly disappointed thus far in 2018. Europe’s growth has abruptly slowed and Japan’s GDP contracted in the first quarter. China’s GDP growth rates remain at historically low levels and, in May, China experienced the slowest year-over-year growth in retail spending in fifteen years. Additionally, numerous problems have arisen in key emerging markets including Brazil, Argentina, South Africa, Turkey and others. These developments are reflective of a noticeable deceleration in monetary expansion and the debilitating impact of high debt levels.
Synchronized Global Monetary Deceleration
All major central banks around the world – the Federal Reserve (Fed), the European Central Bank (ECB), the Bank of Japan (BOJ) and the People’s Bank of China (PBOC) – are simultaneously presiding over a significant contraction in their respective M2 year-over-year growth rates. The reduction in growth of the U.S. reserve, monetary and credit aggregates, along with a major flattening in the yield curve, has been followed by weaker M2 growth in China, the euro area and Japan. Part of this impact is captured by the concept of world dollar liquidity.
World Dollar Liquidity
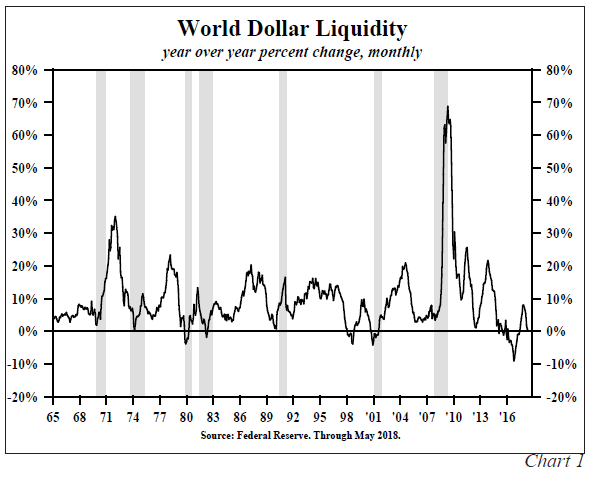
The U.S. dollar is still the world’s reserve currency and the Federal Reserve, de facto, its central bank. Under this assumption, economist Rod McKnew developed the concept of world dollar liquidity, which is the sum of the U.S. monetary base and Treasury securities owned by foreign central banks held at the Federal Reserve Bank of New York (Chart 1). This measure, which was expanding at nearly a 21% growth rate from 2009-2014, has dramatically shifted its trajectory to essentially no expansion from 2015 to May 2018. Thus, by tightening monetary conditions domestically, the Fed also drained liquidity globally.
Europe
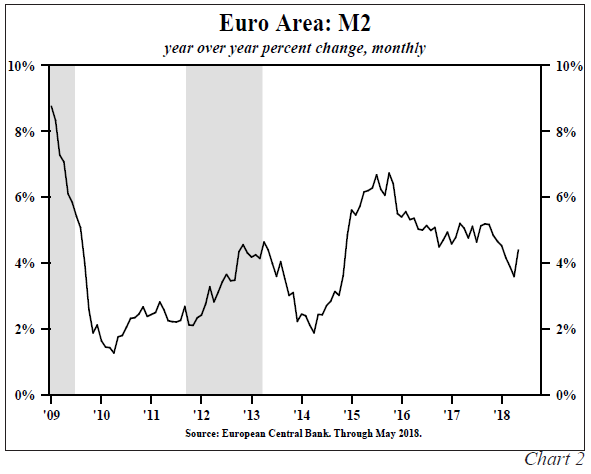
On a year-over-year basis, euro area M2 growth peaked slightly below 7% in mid- to late 2015, less than a year after the end of the Fed’s third and final quantitative easing program (QE). Since late 2015, M2 growth slowed to 5.2% for the 12 months ending September 2017 and then saw an even sharper decline to 4.4% for the 12 months ending May 2018. This downward shift continued even as the ECB engaged in QE throughout the period. The ECB will continue to pursue QE until the policy terminates in December 2018 (Chart 2).
China
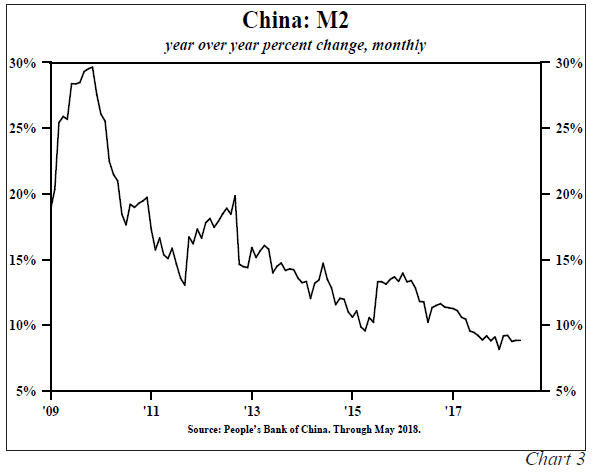
In China, year-over-year M2 growth was 13.7 % in November 2015, the last month before the current Fed tightening cycle began. In May 2018, the annual growth rate fell sharply to 8.9%, a near record low since 2000. April and May’s historically weak M2 expansion is notable since it appears the PBOC’s reserve requirement cuts failed to reverse the trend (Chart 3).
Japan
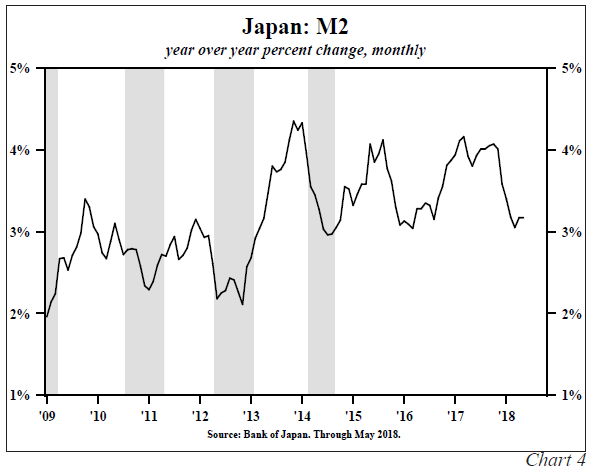
The BOJ has been engaged in QE and interest rates have been negative or near zero, and yet, Japan’s M2 growth rate has continued to fall as U.S. monetary restraint intensified. In the twelve months ending in May 2018, M2 increased by just 3.2%. This was nearly a 25% deceleration in growth from October 2017. Looking back, May’s M2 growth is below the entry point of the 2014 recession. It is not surprising, with the sharp deceleration in money, that Japan’s economy contracted in the first quarter of 2018 by 0.6% (Chart 4).
It appears that the ceasing of growth in world dollar liquidity since 2015 has had a noticeable, deleterious impact on the world’s monetary expansion.
Velocity and U.S. Recessions
Money velocity (V) is determined by a complex mathematical function and influenced by secular, short-term and cyclical factors. Secular factors are persistent and will prevail over time. Short-term factors, like massive swings in inventory investment, are quick to fade. Cyclical factors may hold sway around economic turning points, particularly when the economy is shifting from expansion to contraction. The complexity should not be surprising since V = GDP / M2 and GDP = C + I + G + X. Anything that influences consumption, investment, government spending or net exports will have some influence on velocity. Thus, Irving Fisher’s equation of exchange (GDP = M2 x V) is only the starting point in assessing fluctuations in velocity.
The dominant secular determinant of velocity appears to be the GDP-generating capacity of debt, which is declining in all major economies worldwide. Money and debt are created simultaneously. If the debt produces a sustaining income stream to repay principal and interest, then velocity will rise since GDP will eventually increase beyond the initial borrowing. If advancing debt produces increasingly smaller gains in GDP, then V falls. Financing consumption may temporarily boost GDP and velocity over short timespans, but it does not generate new funds to meet longer term debt servicing obligations. Consistent with this interpretation, velocity has dramatically fallen since 1998 for all four economies: the U.S., Europe, Japan and China (Chart 5).
Secularly, velocity is below historical norms in all four major economic powers.
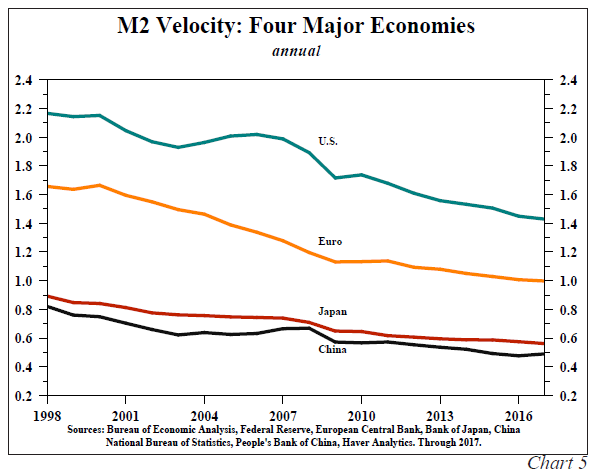
As the productivity of the debt has fallen significantly over the past twenty years, so has velocity. In the more heavily indebted Japan, China and the euro area, velocity is lower than the less indebted United States. Thus, other than for short non-sustaining episodes, velocity will reinforce, not offset, the decrease in M2 growth evident worldwide.
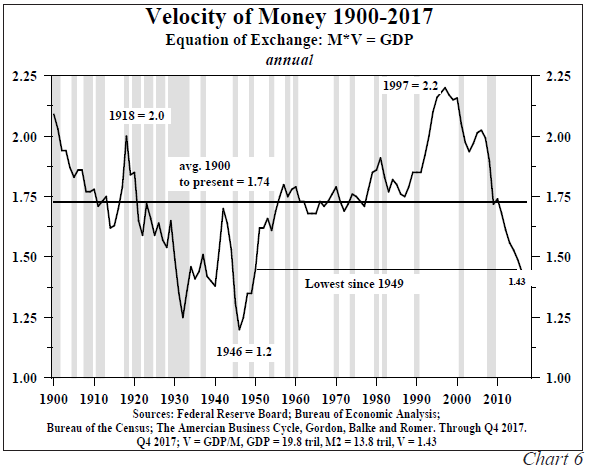
U.S. velocity is estimated to have risen again in the second quarter after small quarterly increases since mid-2017. Historically, such increases have occurred when M2’s growth has dropped sharply, as seen in the current Fed cycle. Both Milton Friedman and Irving Fisher wrote about this cyclical tendency, and Fisher’s equation of exchange is key to understanding such an event.
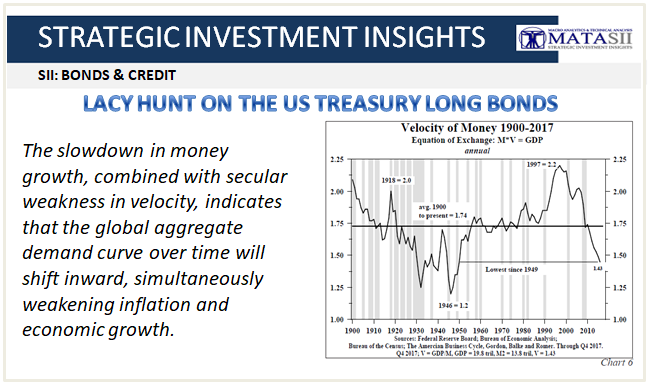
Counting the recessions of the early 1980s as one, there have been 20 contractions since 1900 and M2 growth decelerated prior to 17 of these recessions. With GDP as the ultimate coincident indicator and M2 as the leading indicator then, algebraically, velocity will lag. Consequently, velocity has risen going into the vast majority of all these recessions (Chart 6).
The slowdown in money growth, combined with secular weakness in velocity, indicates that the global aggregate demand curve over time will shift inward, simultaneously weakening inflation and economic growth.
Since inflation is a money-price-wage spiral, the longer-term inflation risks are clearly to the downside. Monetary policy operations will restrain future economic growth and the impact will be surprising due to the long-lagged effects.
Diminishing Returns -
Consequences of Excess Debt
Diminishing returns rests upon the production function that states physical output is determined by the inputs or factors of production. When a factor of production, such as capital, initially increases, output rises at an increasing rate. As excess use of that factor continues to advance, the rate of gains in output slow, flatten, and eventually turn down, a condition referred to as negative returns. Thus, the relationship between the excess use of a factor of production and the output is nonlinear.
Using this theory – that the excess application of an input will lead to diminishing returns – it is possible to see why academic work has concluded that excess application of debt within an economy leads to slower economic growth in a nonlinear fashion. If debt is adjusted for price level changes, then debt is in real or physical terms and thus consistent with the law of diminishing returns. The pattern of unexpected economic weakness in heavily indebted economies has been repeated frequently in Japan, Europe, China and the emerging markets. Japan, the most indebted nation, experienced three additional recessions after the 2008-09 recession. Among the world’s major economic areas, the U.S. economy presently stands out. The disparity in this performance is an unseen consequence from the excess use of debt.
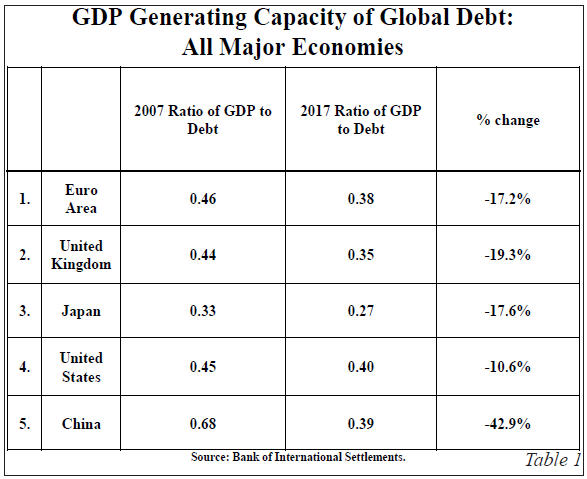
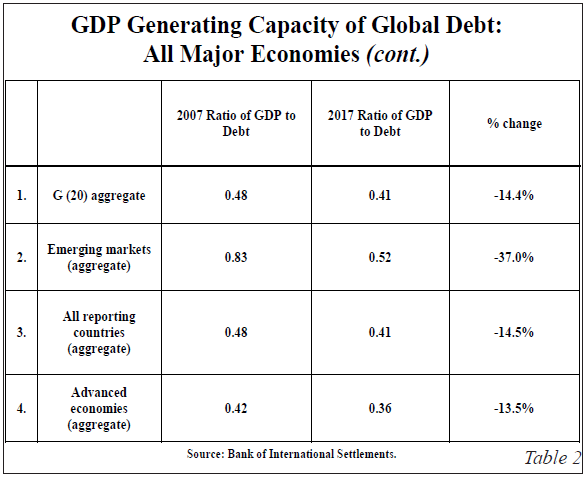
After decades of overuse, debt is increasingly less productive in all of these areas. Ten years ago, the debt overhang was centered in the U.S., the euro area and Japan. Currently, all major economic regions fit this description as China and the emerging markets now separately carry record levels of debt relative to GDP. The Bank for International Settlements (BIS) shows that in 2017, one dollar of nonfinancial debt generated $0.40, $0.38, $0.39, $0.35 and $0.27 of GDP, respectively, in the U.S., the euro area, China, the U.K. and Japan (Tables 1 & 2). All of these data points have significantly worsened over the last decade, the greatest deterioration being that of China which has declined by 43% since 2008. Among all regions, Japan’s debt exhibited the weakest level of debt productivity at $0.27. While one dollar of emerging market debt produced a seemingly enviable $0.52 of GDP in 2017, this ratio was down 38% from 2007.
Technology and Diminishing Returns
In addition to capital, output is a function of labor, natural resources and technology. Thus, one of these latter three factors must accelerate in order to offset the overuse of debt if production growth is to accelerate and thus boost the standard of living. Natural resources and labor are unlikely to be of immediate benefit. New discoveries of raw materials have been occurring, but only serve to balance exhaustion of known supplies. Labor is not promising for the near-term since demographics remain bleak in the U.S. and globally. Technology is another factor that must not be overlooked. While many dramatic advances are underway, the role of invention in the future trend of U.S. and global growth is more complex than is generally understood.
Robert J. Gordon, a distinguished Professor of Economics at Northwestern University and author of The Rise and Fall of American Growth: The U.S. Standard of Living Since the Civil War (2016), considers today’s inventions to be more evolutionary than revolutionary since they do not entail the massive use of labor and natural resources of the past. Gordon looked at inventions from the great American economic growth era of 1870 to 1970. The five major inventions – electricity, modern communications, the internal combustion engine, urban sanitation, and pharmaceuticals and chemicals – greatly enhanced the demand for labor and natural resources, and resulted in complete economic involvement. Information technology, while life changing in many ways, impacts a narrower economic segment. Furthermore, business productivity from the late 20th century’s digital revolution has stalled these past two decades due to innovation saturation. Viewed from a longer-term perspective, the differential effect of present inventions is already apparent.
In his working paper, “Why Has Economic Growth Slowed When Innovation Appears to Be Accelerating?” (National Bureau of Economic Research, 2018), Gordon calculates that the decline in economic growth in the last decade is a stunning seven times lower than the average growth rate for the fifty years between 1920 and 1970, in real GDP per capita terms.
If Gordon’s view is somewhat overstated, it nevertheless appears that some current technological inventions will tend to depress demand for two other factors of production – labor and natural resources. According to available data from the U.S. Bureau of Labor Statistics, there are approximately 3.25 million cashiers, 1.96 million driving trucks and 2 million operating machine tools and assembly lines. Using robots for these functions does not materially change the demand for natural resources but renders obsolete more than 7 million jobs.
Looking Ahead
The spring quarter’s growth will reflect a bounce from the first quarter’s noticeable weakness but a reversion to a more modest expansion will be evident in the latter half of the year since there has been no change in the long-term growth constraints on the U.S. economy. It is evident that the major policy and structural issues, such as
- Over-indebtedness,
- The reliance on additional debt to provide growth,
- Poor demographics,
- Technological constraints and
- Potential trade conflicts,
.. will continue to weigh heavily against ebullient growth.
The long end of the Treasury bond market has, in our view, reflected the harsh realities which are constraining economic expansion.
When the Fed began its current regime of restraint in late 2015, the thirty-year Treasury bond yield was around 3%, similar to where it is today. The market has been buffeted by numerous transitory factors, with the yield moving above and below this level. Many of these developments entailed market psychology and a potpourri of inconsistent developments that will not impact long-term fundamental economic conditions.
While long bond yields can rise as result of a replay of similarly unpredictable events or the current monetary stance, the structurally weak U.S. economy does not support current interest rate levels.
The excess levels of debt continue to amass and the short-term beneficial aspects of even higher levels of debt are likely to be increasingly fleeting. Moreover, the growth impediments on the U.S. economy are more serious in many other parts of the world. As Friedman rigorously proved, a noticeable period of monetary deceleration, now synchronized globally, is consistent with lower, not higher, interest rates.