Gordon T Long

Gordon T Long

Global Macro Research | Macro-Technical Analysis 

TIPPING POINTS

CREDIT TIGHTENING


LIQUIDITY IS ALREADY TIGHTENING!

Overall financial market momentum peaked in June. Stealth liquidity tightening is at the root but it is still poorly recognized just how this is occurring. I hope to expand further on this fact in this newsletter and further add to the discussion in this month’s LONGWave video.

Though momentum has peaked, equity markets however have continued to rise even as liquidity is tightening. To understand this apparent dichotomy It is important to realize that equity markets don’t normally peak until retail investors are “Full-In” to support Wyckoff Distribution also outlined in this month’s LONGWave video.

With momentum weakening, the peak in market trading arrives because at some point there is typically insufficient volumes of “bigger fool” to sell stocks to. Additionally, the public become fully leveraged in the markets (chart right) and FOMO (Fear of Missing Out) is in full swing. We have some strong indications that is the case before we discuss tightening liquidity!
 
A “TELL-TAIL” OF A MARKET TOP
 
No clearer example can be given that a MARKET TOP is near than recent reports of the retail buyer now in control of market trading.
 
 
Retail trading continues to dominate. Continuing the trend we have been watching, retail brokers’ disclosures regarding compensation for order flow show that individual investors accounted for 55% of single stock and ETF option contracts traded in Q2.
 
Separately a survey published by MarketWatch shows:
 
An astounding 59% of Gen Z traders have admitted to trading while drunk, the survey showed. That number falls to 32% when all U.S. traders of every age are queried. 
 
The hangover is going to be brutal!
Here’s what they are too drunk to comprehend!


POLICY DRIVERS OF LIQUIDITY
 
The universal concern by market professionals is any change in the rate of Federal Reserve liquidity. This liquidity is best measured by the change in Total Bank Reserves held by the Fed.
 
There are four drivers that create a CONTRACTION or tightening. Those highlighted in red are already occurring:
 
  1. Repayment within Discount Operations window (this seems remote),
  2. Currency in Circulation is increased. This is likely but not a major concern as shown by the green line, but not seen as a major concern – at least yet,
  3. Treasury Deposits at the Fed increase – this is also not a major concern, or
  4. Reverse Repo levels increase. This is a major concern since they have already spiked to $1.2T and many are calling for a doubling from this level! This is presently contracting Total Bank Reserves.
 
Additionally:
 
  • Bank Reserve Liquidity will fall if QE Tapering were to begin (market is starting to price in this possibility),
  • Overall market Liquidity will fall if the Treasury’s Debt Ceiling is not suspended once again since US Treasury Spending will be crimped,
  • Bank Reserve Balances will not grow if ongoing Treasury Supply is not issued or rolled over.


US TOTAL MONEY SUPPLY
 
TANKING BUT STILL POSITIVE:
The Y-o-Y Total Money Supply rates which creates Monetary Inflation are tanking but still positive
 
Steve Saville at the Speculative Investor (TSI) follows these measures closely and writes:
 
“The monetary backdrop will stop being supportive for the US stock market after the annual TMS growth rate drops below 6% (see chart below). This could happen as soon as the first quarter of next year, but a lot will depend on commercial bank lending. For example, if commercial banks ramp-up their lending then the US monetary inflation rate could stay in the 7%-10% range for a long time even if the Fed ‘tapers’. Something along these lines happened during 2014-2016”.
 
He also writes:.
 
“We’ve written previously that the H1-2021 global monetary inflation reversal probably won’t be a major driver of prices over the balance of this year. This is due to the time it takes for a change in the money-supply growth trend to ‘ripple through’ the financial markets and the economy. However, unless the Fed and the ECB generate a new monetary tsunami over the next several months, the G2 monetary inflation rate could become low enough by early next year to set off a boom-to-bust transition.”


NOTE: The vertical red lines on the G2 monetary inflation chart below indicate the starting times of US recessions.
 
THE MARSHALLIAN K MEASURE
 
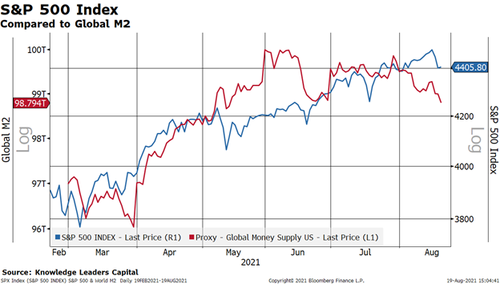
Liquidity Is evaporating even before a potential Fed Tapering hits markets. The Marshallian K shows liquidity not only deteriorating but actually contracting — and at a time when hopes (as embedded in valuations) have never been higher!
 
WHAT IS THE MARSHALLIAN K MEASURE?
 
It is the gap between the rates of growth in money supply and gross domestic product.
 
The signal is obscure, but has sent meaningful signs in the past. As a measure of U.S. financial liquidity its declines foreshadowed two of the decade’s worst equity routs and is flashing alarms even before the Federal Reserve embarks on its planned winding down of asset purchases.
 
    • The signal just turned negative for the first time since 2018, meaning GDP is rising faster than the government’s M2 account.
    • The shortfall comes from an expanding economy that’s quickly depleting the nation’s available money.
    • The deficit could become a problem for markets at a time when excess liquidity is seen as underpinning rallies in everything from Bitcoin to meme stocks.
How big a threat is this?
 
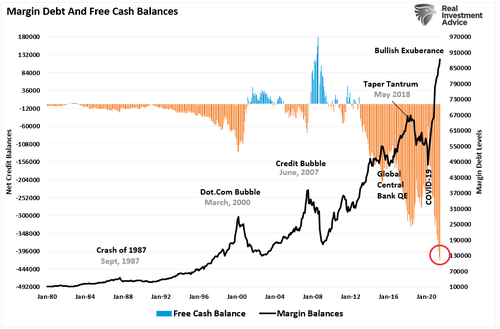
    • While stocks kept rising during frequent negative Marshallian K readings in the 1990s, the pattern since the 2008 global financial crisis — a period when the central bank was in what Ramsey calls a “perpetual crisis mode” — begs for caution.
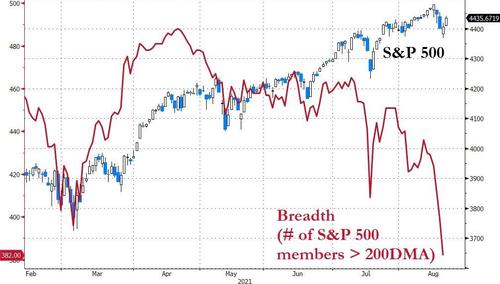
    • The Marshallian K fell below zero in 2010, a year when the S&P 500 Index suffered a 16% correction. A similar dip in 2018 portended a selloff that almost killed that bull market.
    • The Leuthold study is the latest attempt to handicap the market’s outlook from the perspective of liquidity. But not everyone is worried. In June, research from UBS Group AG showed that should the Fed turn off the spigot on its annual $1.4 trillion in quantitative-easing spending, the hit to the S&P 500 would be a paltry 3% decline in prices.
The recovering economy is now drinking from a punch bowl that the stock market
once had all to itself.


The Marshallian K indicator just slumped into negative territory faster than ever. During the second quarter, M2 money expanded 12.7% from a year ago, trailing the nominal GDP growth rate of 16.7%. That came after four quarters of excessive liquidity where the spread stayed above 20 percentage points.


CONCLUSION
 
Market momentum peaked and reversed in June:
 
    • Global M2 peaked in June and has fallen by $1 trillion,
    • The NYSE cumulative advance/decline peaked in June,
    • Corporate spreads troughed in early July,
    • The Chinese Yuan peaked at the end of May and has devalued by about 2%,
    • COVID cases began rising steeply in July.
When you overlay the S&P 500 on global M2 (chart below), Money Growth peaked on May 31, 2020 and has been trending down since. Given the consensus that this has been a liquidity-fueled stock market advance, if investors were aware that global M2 has dropped by about $1 trillion, they may have a less enthusiastic stance toward equities.
 
 
“One thing seems inevitable; absent monetary intervention (i.e. more manipulation), this thing is going to pancake in the coming months. In the short-term we’ll continue to manage what we see and hope to gauge the odds one way or the other based on new information. The Fed also sees – and probably obsesses upon – liquidity indicators like these. What’s more, per the Continuum above it has license to try to combat them.”

FOLLOWING DETAILED ANALYSIS IS SUBSCRIBER CONTENT ONLY

Subscribe to view full post content with supporting live charts
 

FAIR USE NOTICE  This site contains copyrighted material the use of which has not always been specifically authorized by the copyright owner. We are making such material available in our efforts to advance understanding of environmental, political, human rights, economic, democracy, scientific, and social justice issues, etc. We believe this constitutes a ‘fair use’ of any such copyrighted material as provided for in section 107 of the US Copyright Law. In accordance with Title 17 U.S.C. Section 107, the material on this site is distributed without profit to those who have expressed a prior interest in receiving the included information for research and educational purposes.  If you wish to use copyrighted material from this site for purposes of your own that go beyond ‘fair use’, you must obtain permission from the copyright owner.


NOTICE  Information on these pages contains forward-looking statements that involve risks and uncertainties. Markets and instruments profiled on this page are for informational purposes only and should not in any way come across as a recommendation to buy or sell in these assets. You should do your own thorough research before making any investment decisions. MATASII.com does not in any way guarantee that this information is free from mistakes, errors, or material misstatements. It also does not guarantee that this information is of a timely nature. Investing in Open Markets involves a great deal of risk, including the loss of all or a portion of your investment, as well as emotional distress. All risks, losses and costs associated with investing, including total loss of principal, are your responsibility.