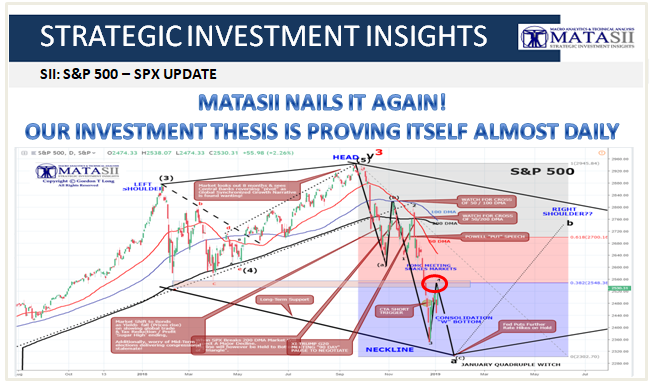
MATASII'S MACRO INVESTMENT THESIS IS PROVING ITSELF CORRECT (ALMOST DAILY)
MATASII INVESTMENT THESIS
- The market problem is liquidity. Meaning global money (including collateral flow),
- Current Financial Market Actions all Correlate with this supposition and additionally correlate from the start of the crash on Oct 4th:
- CORRELATION 1: The ungodly Repo rate spike,
- CORRELATION 2: The drop in WTI and the chaos in oil markets (benchmark spreads),
- CORRELATION 3: The straight line (almost) drop in WTI and Contango
- CORRELATION 4: The spike oddly connecting to exactly what Eurodollar futures are saying (shortage),
- CORRELATION 5: Plummet in future inflation expectations,
- CORRELATION 6: Swap and credit spread blowout,
- CORRELATION 7: UST Futures & Yield Curve,
- CORRELATION 8: An unprecedented Bond Market Rout.
4. We have a negative reinforcing feedback loop underway between Liquidity, Volume & Volatility,
5. Absent an increase in overall market volume, liquidity will collapse to even more unprecedented depths as the volume/volatility ratio hits new all time lows.
6. Without another major central bank intervention that eliminates the endogenously rising market volatility, the real chaos is yet to come. The Fed is acutely aware of this,
NOTHING WILL CHANGE UNTIL THE FED REVERSES COURSE ON RATE HIKES AND THE RATE OF QT
(Which means it is trapped and we have effectively lost control of the Global Economy to Debt Excesses & Servicing)
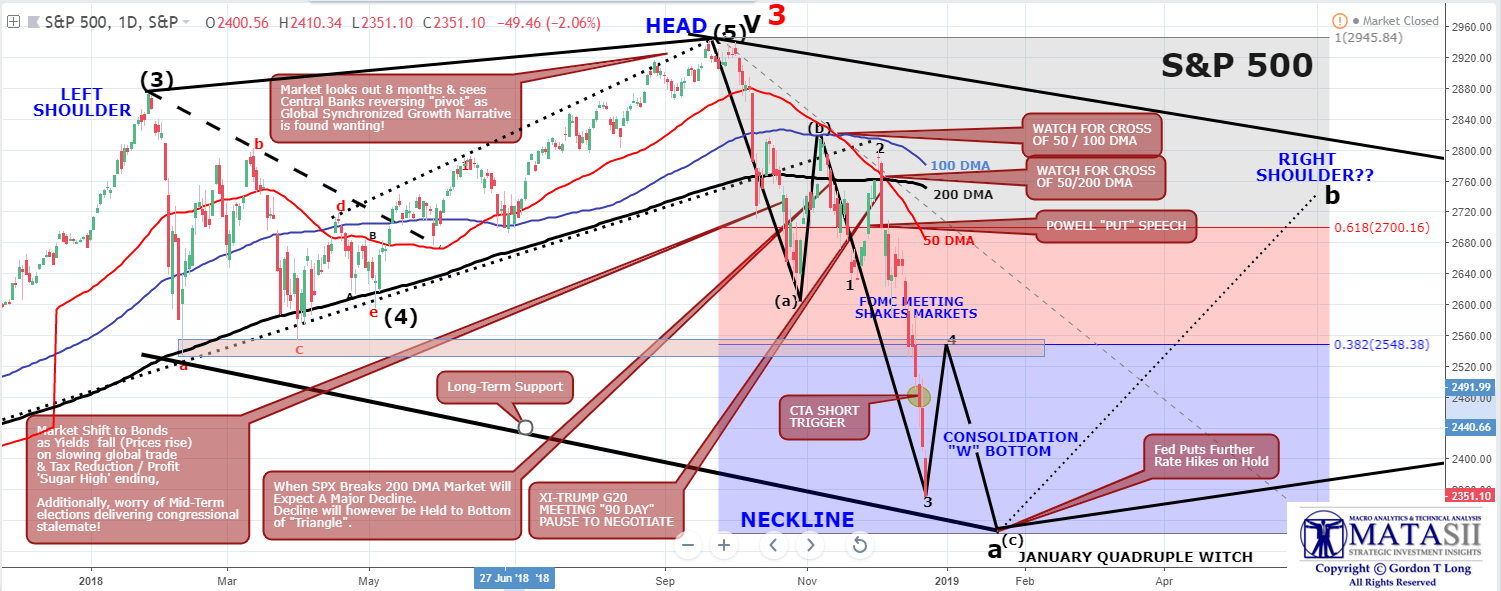
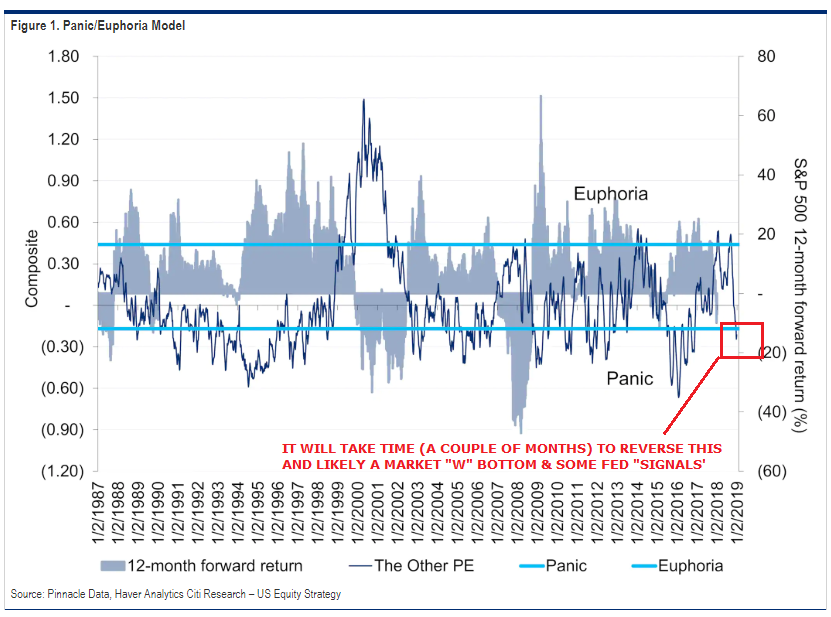
7. Consequentially we will see a "Right Shoulder" market formation in the first half of 2019.
8. The Market is likely to put in a "W" bottom before beginning building the "Right Shoulder" market formation.
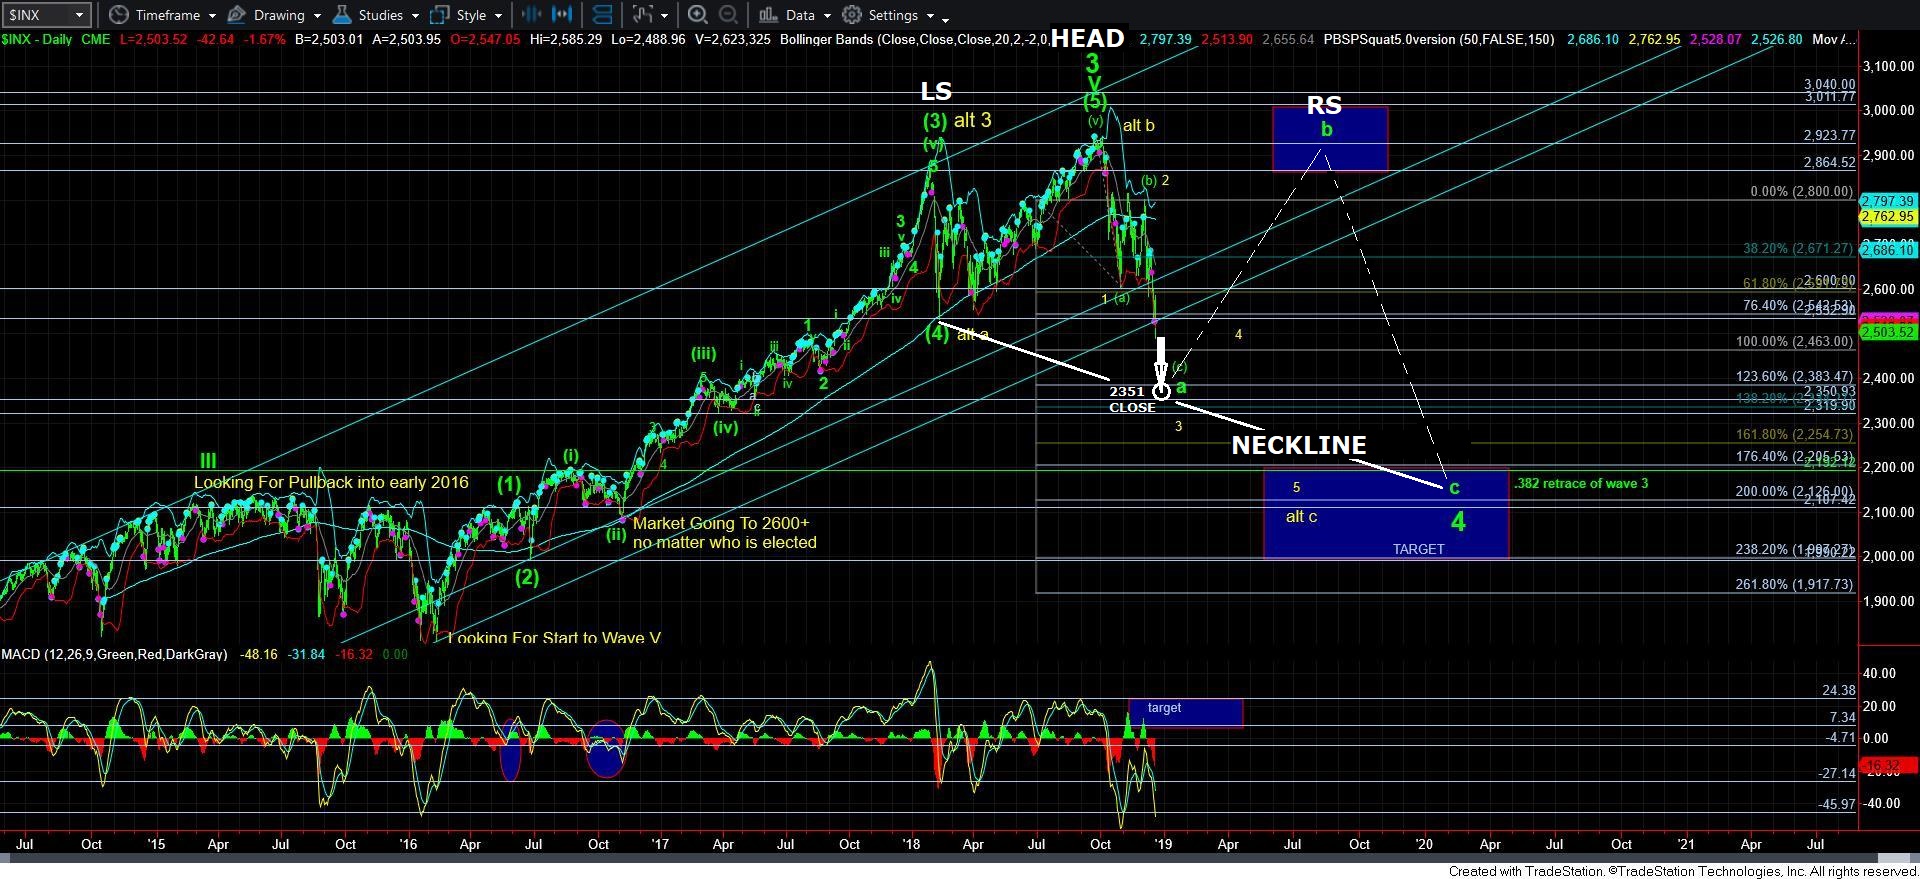
SUPPORTING TECHNICAL PATTERNS - Elliott Wave Pattern
We laid out our expectations for a Wave 4 lift when we hit our Wave 3 Target. Few believed this was in the works - never mind the "W" bottom and a potential Right Shoulder in first half 2019 based on A fed capitulation.
Well here we are today (01-04-19-) with this apparently unexpected rally:
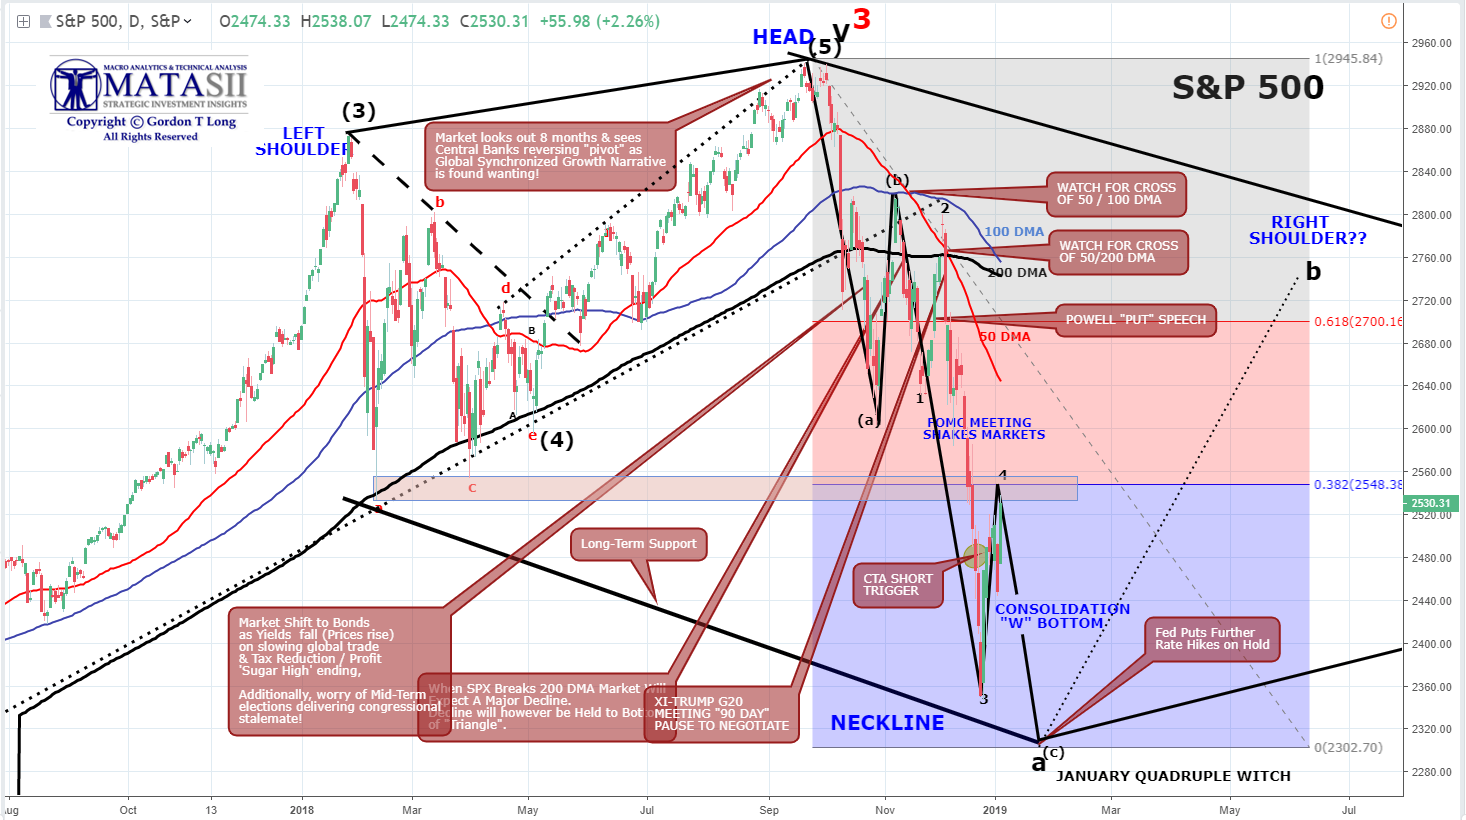
In case you believe this was a lucky guess, here is the post we made at "3" on why we were going to see a violent Bear Market Counter rally. AFTER this post we had the biggest one day lift in history. The lift took us to the "CTA Short Trigger" circle labelled above. A point we had identified earlier (here on 12/13, here on 12/21, here on 12/27)
Our assessment is that it will take a couple of months PLUS some Federal Reserve "signals" on reversing or moderating its current monetary policy direction to reverse the Panic/Euphoria Sentiment Model. We therefore expect the above "W" bottom to be required.
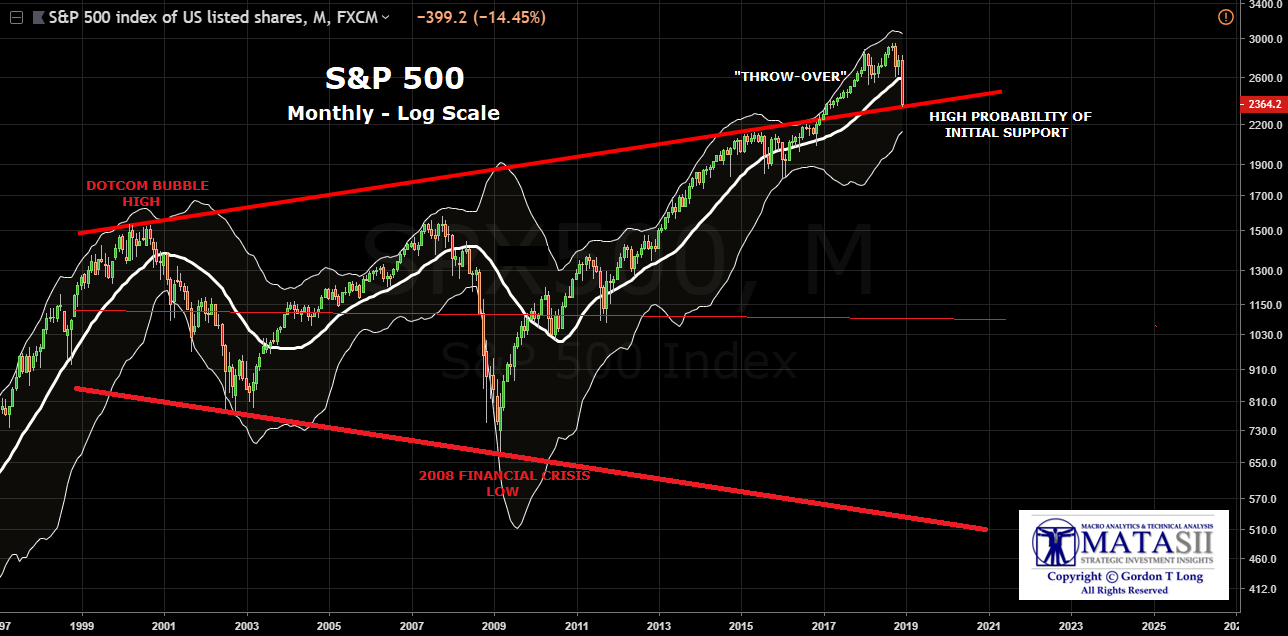
BEWARE OF A VIOLENT BEAR MARKET COUNTER RALLY
The Long Term Trend Line for the S&P 500 going back to the Dotcom Bubble Highs suggest the market may be near an initial support level. The chart is based on a log scale for dramatic price movement during this 19 year period.
Institutional Investors are prone to use Regression-to-the-Mean Analysis. Shown in red below is the Regression for this period of time. Price is now at the point of Regression.
It is interesting to note that the Trend Channel for this period (shown in blue) shows price to be near the upper channel boundary.
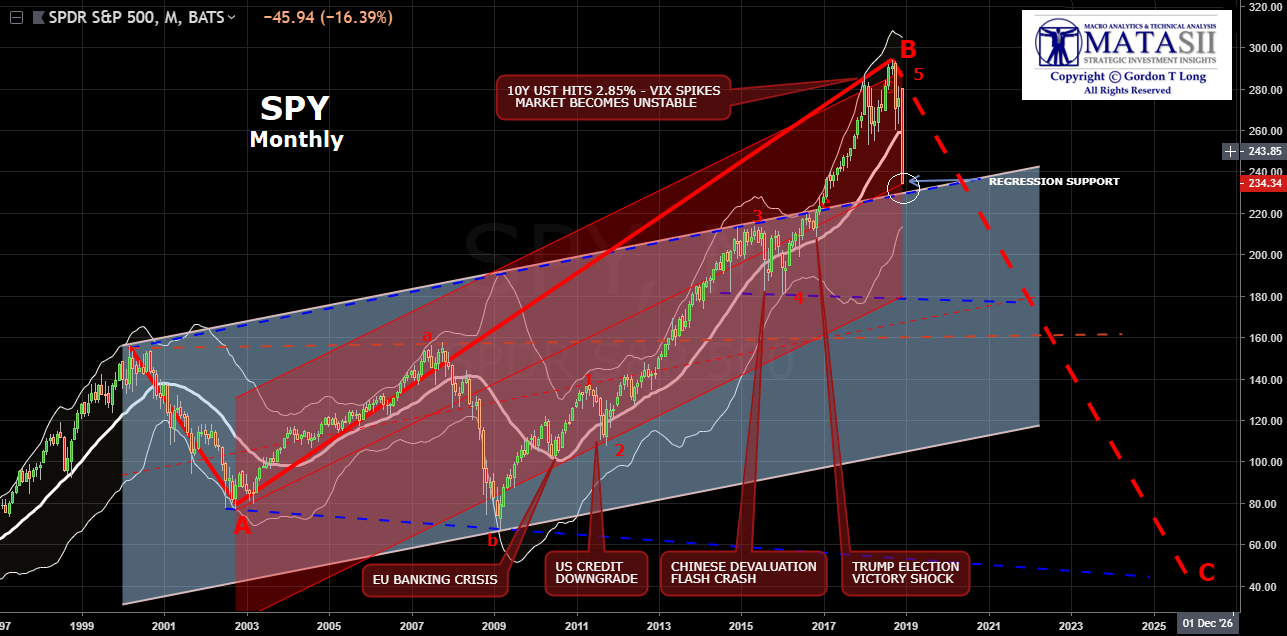
The confluence would suggest that Investors should be highly wary of a violent Bear Market Counter Rally occurring.
We hope you have been following our posts closely or you missed out on some of the best market opportunities in history
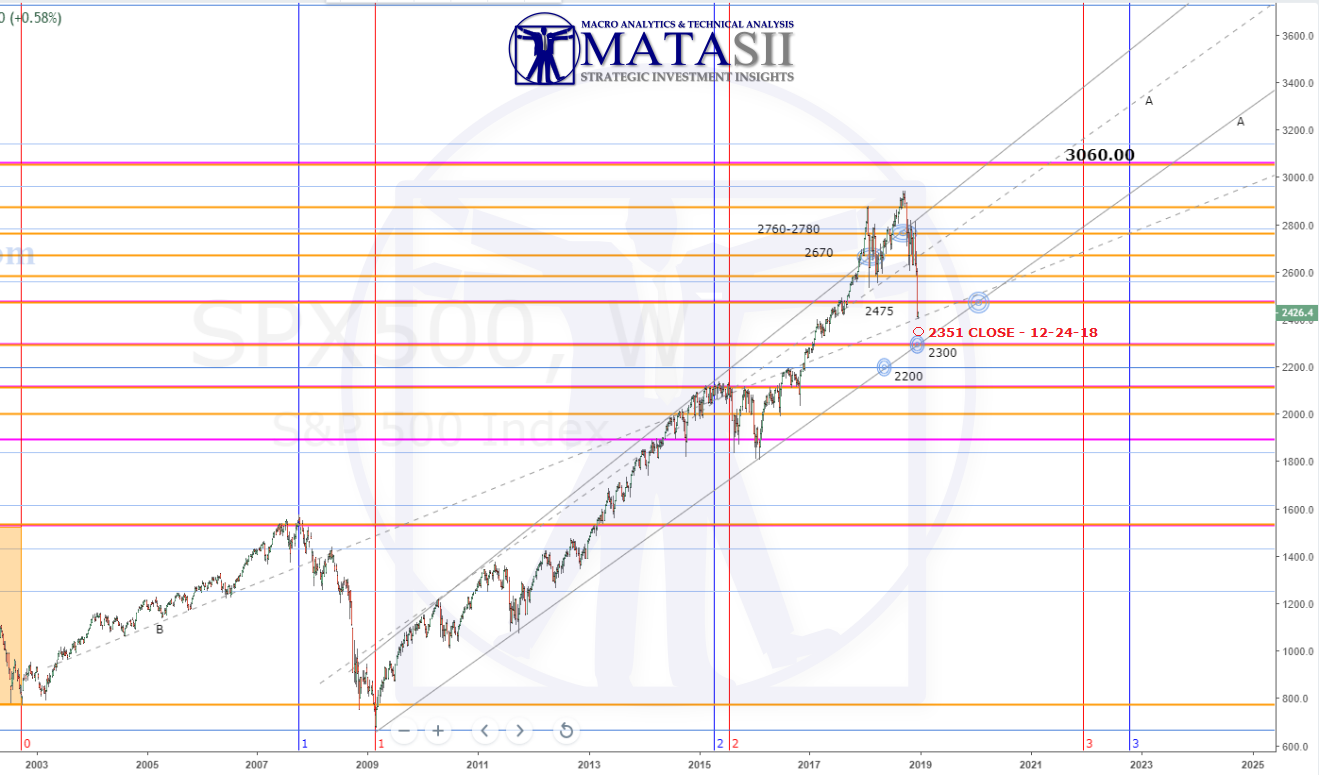
Our Prior 12/24/18 Post: Showing Our Bigger Picture View
SEARCHING FOR LONGER TERM SUPPORT: MATASII SPX UPDATE
NEAR TERM: MACRO ANALYTIC VIEW
LONG TERM: ELLIOTT WAVE VIEW
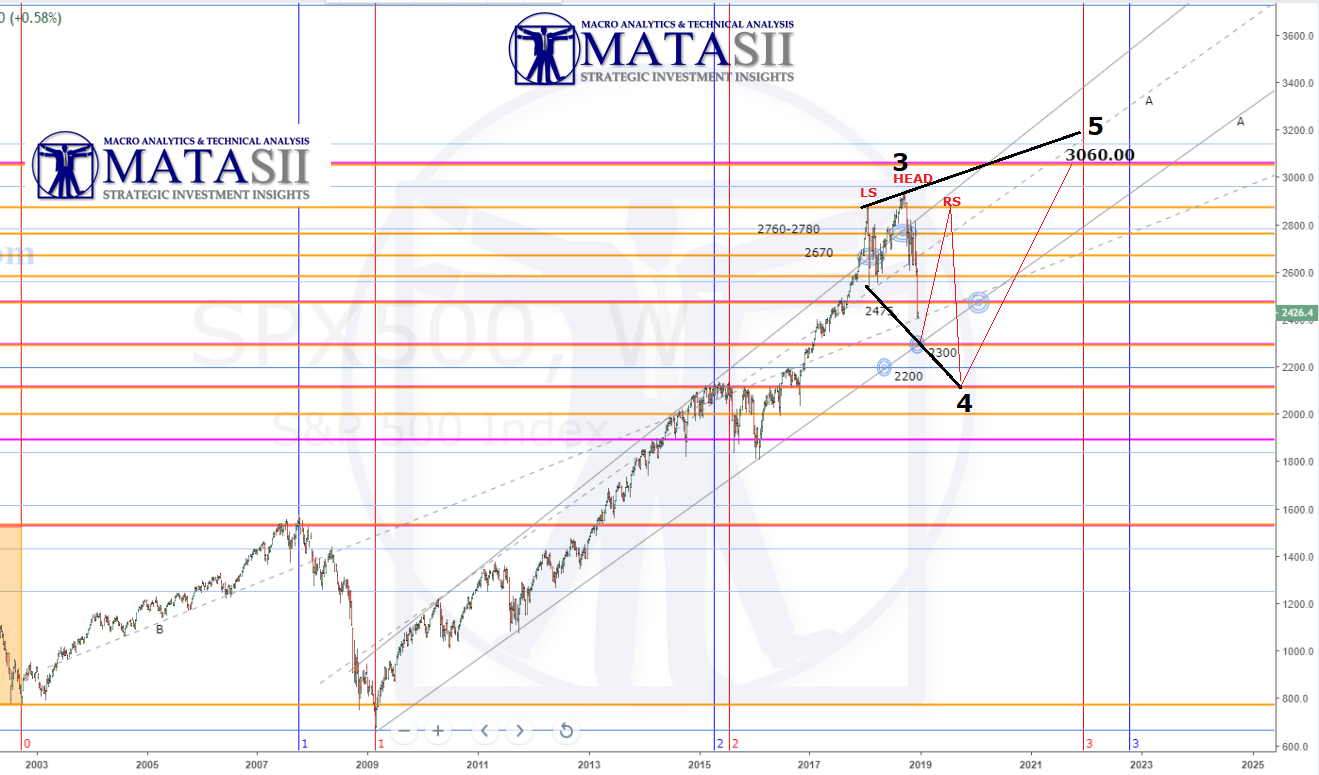
The longer term Elliott Wave Analysis below) is suggesting that the Right Shoulder may be higher than shown above.
NOTE: The Wave 5 lift from the Neckline is not shown below. It requires a larger scale which we have shown in previous posts)
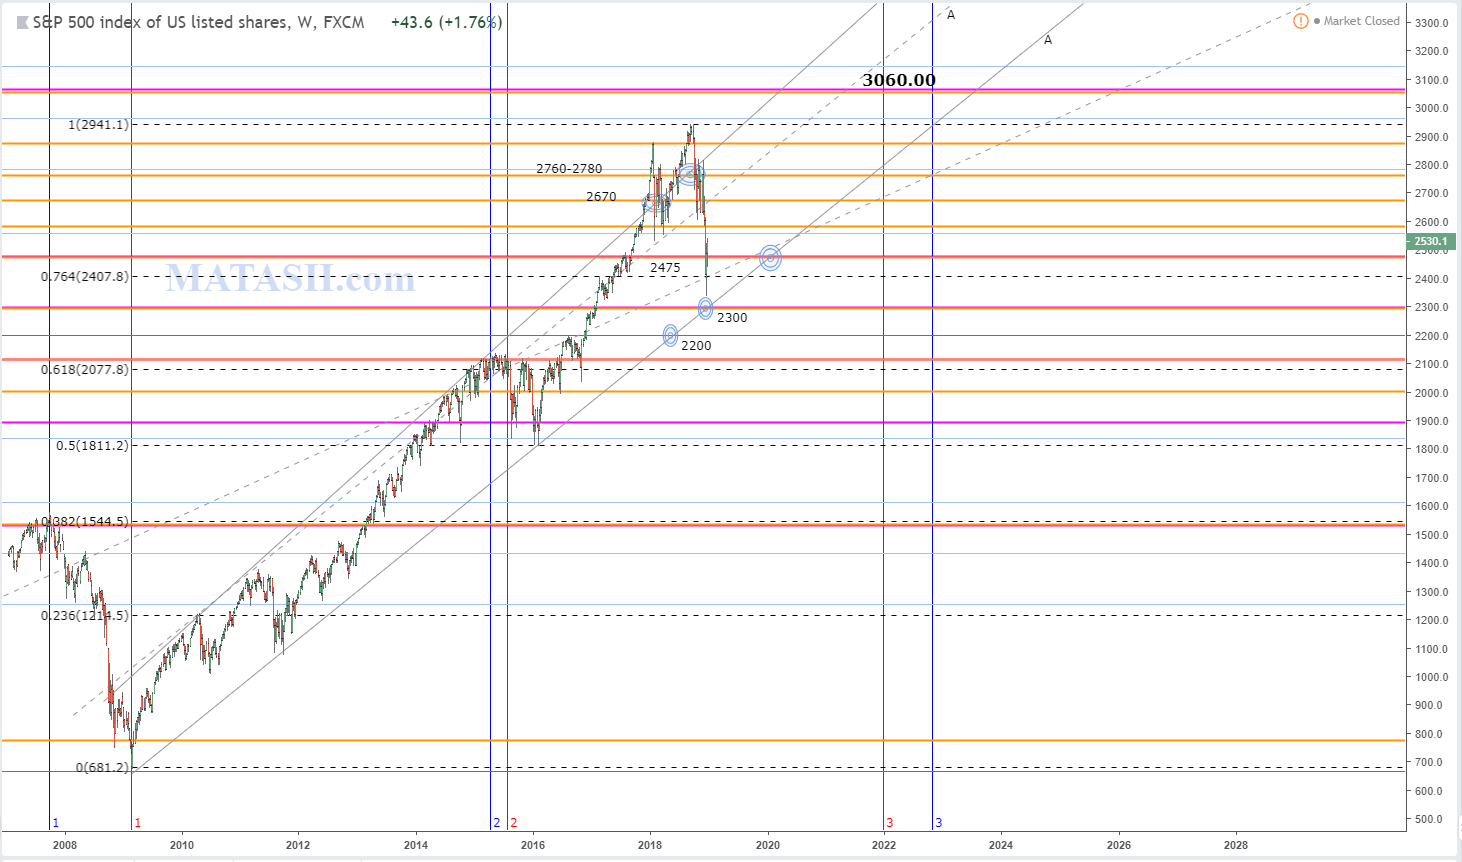
LONGER TERM: FIBONACCI EXTENSIONS WITH MATASII HPTZ's
The MATASII Fibonacci's suggest that Wave 5 (rising from the Wave 4 Neckline shown above) will end at 3050 in the 2022 time frame. From here a multi decade Fiat Currency Collapse will likely ensue.
Above Chart Updated 01-04-19 for your reference:
CONSOLIDATING THE ABOVE VIEWS: Presently Signalling the Following Potential Pattern