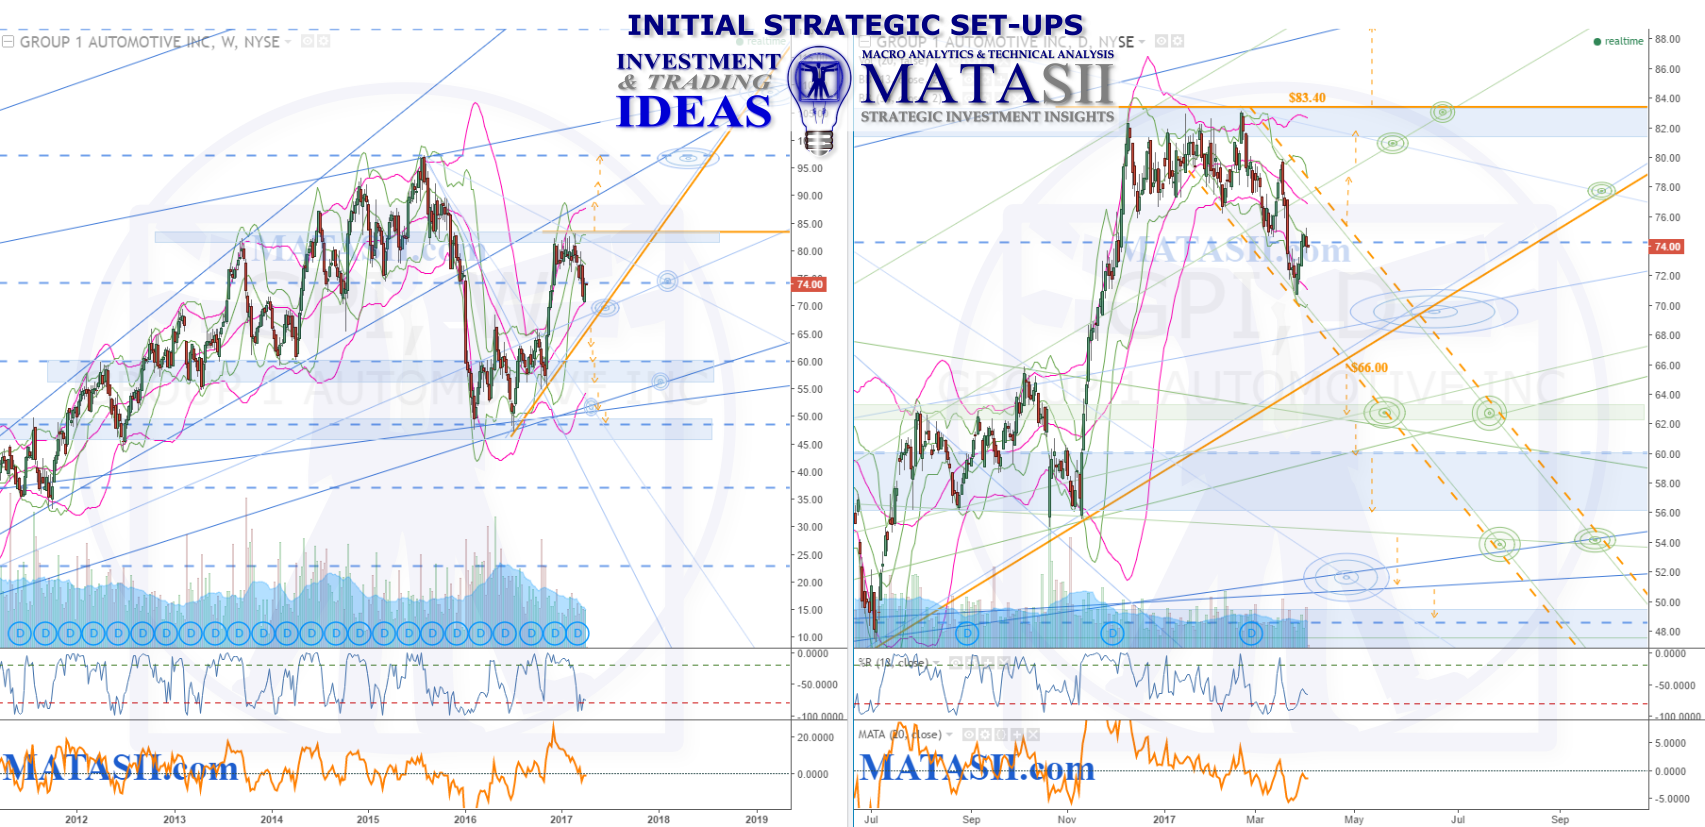
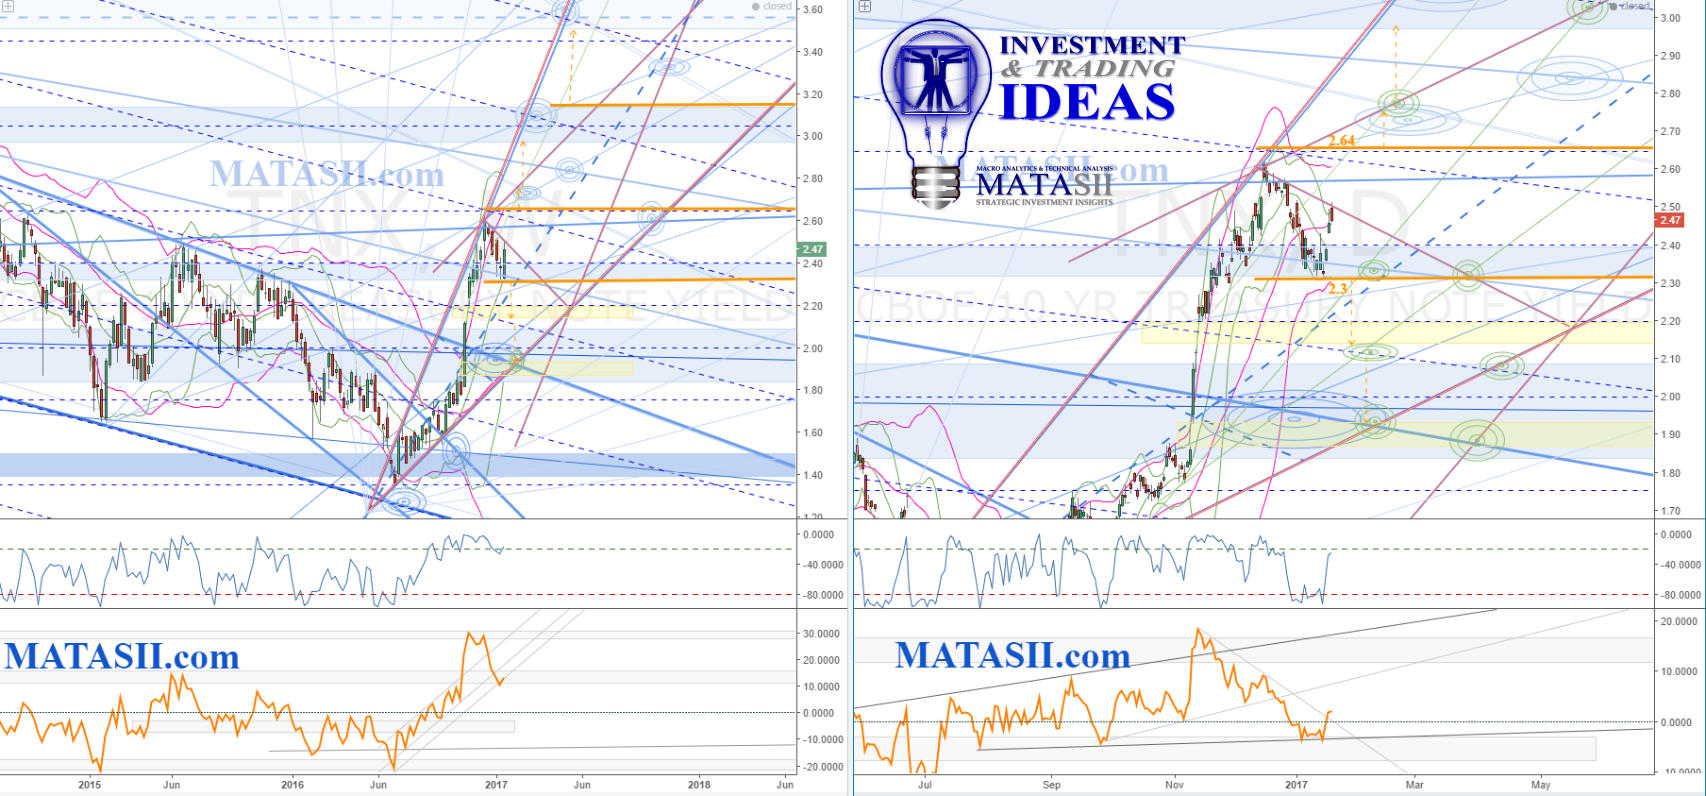
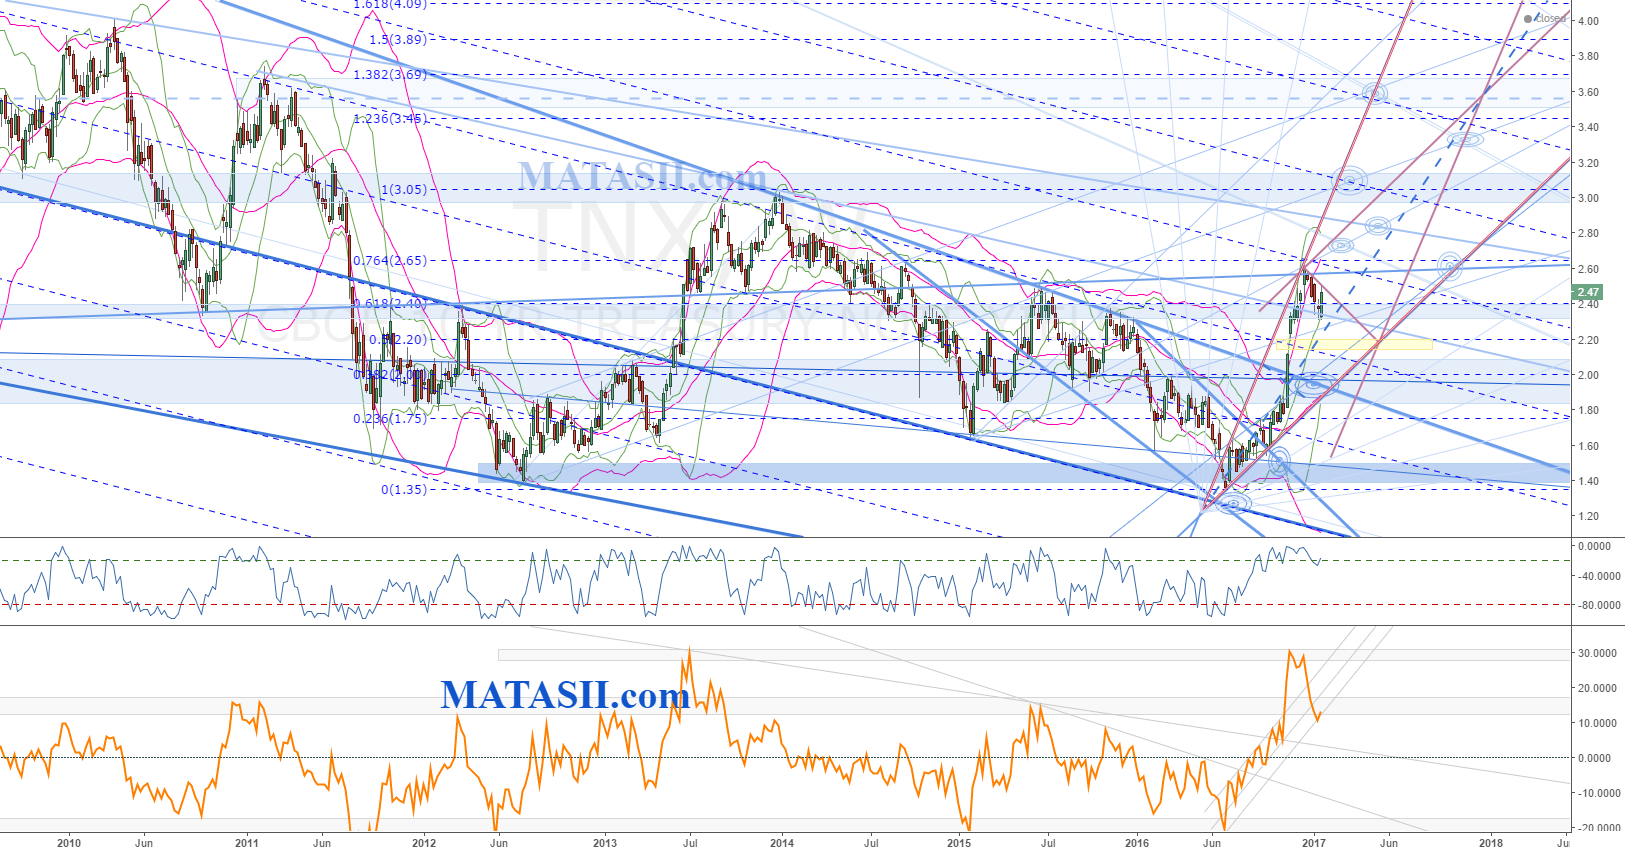
The larger pattern on the weekly chart shows a potential double top forming for GPI. The daily chart shows the most recent market movement coming off significant technicals and falling within a channel. Breaking from this channel (orange dashed highlight), up or down, would be a trigger consideration for a move to the next significant […]
Andrew J.D. Long, MFTA
About Andrew J.D. Long, MFTA
Posts by Andrew J.D. Long, MFTA:
ANF Abercrombie & Fitch OUTCOME & PERFORMANCE
In May 2016 we posted ANF with some potential technical opportunities to consider. The left hand chart is the daily at that time; the right hand chart shows the current market as of March 21st, 2017. “X” marks the same location on both charts to help with orientation. From X we see a wiggle […]
SHLD Sears Holdings Corporation IDEA
Down significantly, SHLD has bounced from lows in Feb 2017. The larger trend remains negative, however the market is currently in a positive trend that can bee seen on the dialy bound by a green channel. The support for the channel is highlighted with a dashed orange line, indicating a potential risky trigger consideration. Risky […]
JCP IDEA OUTCOME, HPTZ Method & Market Roadmap
Our original post and ideas can be seen on the left hand chart (JCP daily), posted May 11th, 2016. The right hand chart is the current daily JCP (March 14th, 2016). The long term macro bias for this has been negative, and overall the market is now down 25% ($8 – $6). It could have […]
WMT IDEA OUTCOME, HPTZ Method & Market Road Map
The High Probability Target Zones methodology (HPTZ) that is used to assess our charts provides a detailed and accurate market road map that can be used to facilitate any investment or trading strategies. Below we show an example of this using WMT, originally posted May 11th, 2016. The solid orange lines seen on the left […]
XLY IDEA OUTCOME +6.46%
After our initial posting the market continued sideways with a slight positive slant. An initial drop off and then lift stay within the potential trigger consideration boundaries before finally breaking to the up side. An orange dashed arrow highlights a potential move to watch for, and we can see that the market has now reached […]
HL Hecla Mining Company IDEA
HL has been in a sideways consolidation (Daily) since August 2016 after a significant run-up that saw the stock at least triple ($2-$6 +) in 2016. Current sideways movement can be bounded wiith technicals, offering some guidance for when the consolidation has ended. Solid orange lines offer breaks of significant technicals for consideration; orange dashed […]
SPX Technical Update 2017 02 25
Last update we were looking for a lift to 2300 for the SPX, where we were watching for potential resistance. This was based on Fibonacci extensions, and we can see the market has followed them well. Resistance did occur and the market held at the 2300 level for 2 weeks before finally breaking through. The […]
SII 10yr Treasury Note Yield Technical Update & IDEA
TNX has recently broken from a long term weekly pattern (blue s/r, wedge pattern resistance) and we are currently watching the degree of pull back. There is potential for a drop back to the larger weekly pattern to retest the s/r that has been broken out of. An initial break of 2.3 offers potential opportunity […]
TNX CBOE 10yr Treasury Note Yield Technical Update
WEEKLY View: A long term descending wedge pattern can be seen coming from the left of the chart; this has recently been violently broken through: the lift can be seen to reach significant pattern resistance. The last few weeks have seen the market fall off slightly from the recently made high, dropping back in to […]